
In this study, I examine how UAV drone oblique photography can be integrated into a multi-source surveying data accuracy analysis system. I focus on the practical problem that arises when satellite remote sensing, aerial photography, laser point clouds, and ground observations are used together: each source has a different error structure, spatial resolution, and geometric reliability. When these sources are fused without a rigorous accuracy framework, the final product may look visually convincing while containing hidden systematic bias. My central argument is that UAV drone oblique photography should not be treated merely as a visualization tool. Instead, it should be treated as a geometric data source that can be registered, evaluated, and propagated through a formal quality-control pipeline.
To support this argument, I construct a four-layer system architecture that includes a data layer, a processing layer, an analysis layer, and an application layer. I use coarse registration followed by iterative closest point refinement to align UAV drone oblique point clouds with laser point clouds and ground reference data. I then evaluate planar and vertical accuracy using checkpoints, error surfaces, and statistical indicators. In a representative loess hilly and gully verification area, my results show planar root mean square error of approximately ±0.198 m and vertical root mean square error of approximately ±0.235 m. These values satisfy the assigned tolerances for the tested mapping scale and terrain class. The results indicate that UAV drone oblique photography can serve as a reliable component of a multi-source surveying accuracy analysis system when the processing chain is designed with explicit geometric constraints.
1. Role of UAV Drone Oblique Photography in Multi-Source Surveying
Multi-source surveying has become normal practice because no single platform can satisfy all requirements of coverage, resolution, timeliness, and cost. Satellite imagery provides regional consistency but often lacks fine geometric detail in complex terrain. Manned aerial photography provides stable large-area coverage but has higher mobilization cost. Ground surveys provide high local accuracy but are labor-intensive. Laser scanning provides direct three-dimensional geometry and strong penetration through some vegetation gaps, but it can be expensive and may have irregular point density. UAV drone oblique photography fills an important middle ground: it offers flexible deployment, very high image resolution, multi-angle observation, and relatively low operating cost.
The term UAV drone appears repeatedly in this article because the platform is not incidental. The UAV drone determines the flight altitude, overlap, endurance, payload, and georeferencing quality. A multi-rotor UAV drone can hover and acquire dense overlapping images in small areas, while a fixed-wing UAV drone can cover larger areas with longer endurance. The choice of UAV drone affects the image network geometry, the number of control points, and the final error surface. Therefore, the accuracy analysis system must treat the UAV drone as a measurable component of the observation system rather than as an interchangeable camera carrier.
In my framework, UAV drone oblique photography contributes three distinct values to multi-source accuracy analysis. First, it provides high-resolution texture and geometry for object reconstruction. Second, it provides a redundant multi-view image network that can be self-calibrated and statistically evaluated. Third, it provides a flexible bridge between satellite-scale mapping and ground-level verification. This bridge is essential because multi-source fusion often fails at the intermediate scale, where resolution differences and geometric inconsistencies are most visible.
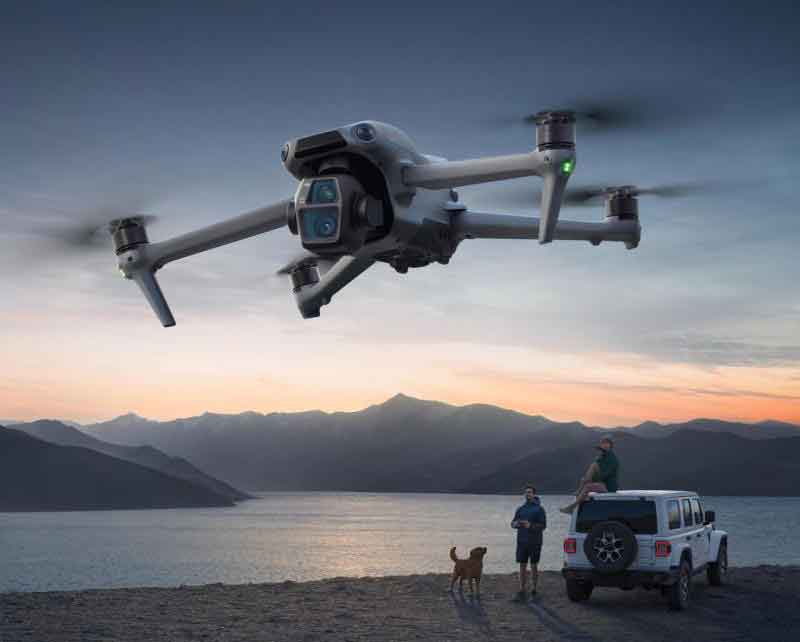
2. Technical Principle of UAV Drone Oblique Photography
UAV drone oblique photography reconstructs three-dimensional space through the combined use of structure from motion and multi-view stereo. A multi-lens camera mounted on the UAV drone captures nadir and oblique images simultaneously. Structure from motion detects and matches feature points across multiple views. Using onboard global navigation satellite system and inertial measurement unit data, the algorithm estimates camera exterior orientation and generates a sparse point cloud. Multi-view stereo then densifies the point cloud under photometric and geometric consistency constraints. Finally, mesh reconstruction and texture mapping produce a three-dimensional surface model.
The geometric relationship between image coordinates and ground coordinates is governed by the collinearity equation. For a camera with principal point \((x_0,y_0)\) and focal length \(f\), the projection can be written as
$$x – x_0 = -f \frac{a_1(X-X_S)+b_1(Y-Y_S)+c_1(Z-Z_S)}{a_3(X-X_S)+b_3(Y-Y_S)+c_3(Z-Z_S)}$$
$$y – y_0 = -f \frac{a_2(X-X_S)+b_2(Y-Y_S)+c_2(Z-Z_S)}{a_3(X-X_S)+b_3(Y-Y_S)+c_3(Z-Z_S)}$$
where \(X,Y,Z\) are ground coordinates, \(X_S,Y_S,Z_S\) are the camera projection center coordinates, and \(a_i,b_i,c_i\) are elements of the rotation matrix. These equations are the foundation of bundle adjustment and self-calibration. In my accuracy analysis pipeline, I use them to quantify how exterior orientation errors and camera calibration errors propagate into the reconstructed point cloud.
A five-lens UAV drone camera system typically includes one nadir lens and four oblique lenses arranged at approximately 45 degrees. The oblique lenses capture building facades, steep slopes, gully walls, and other vertical or near-vertical surfaces that are poorly represented in nadir-only photography. Simultaneous exposure is critical. If the lenses are not synchronized, platform motion and illumination changes introduce mismatch between views. In my design, I require millisecond-level synchronization with exposure difference below 1 ms. This keeps the five views in a consistent spatial and temporal frame.
Table 1 summarizes the main technical parameters that I consider when configuring a UAV drone oblique photography mission for accuracy analysis.
| Parameter | Typical Value or Requirement | Reason for Control |
|---|---|---|
| Number of lenses | 5 (nadir plus four oblique) | Provides multi-angle coverage and reduces occlusion |
| Oblique angle | Approximately 45 degrees | Balances facade coverage and geometric strength |
| Single-lens pixel count | 45 million or higher | Supports high ground resolution |
| Ground sample distance | 0.5 cm to 2 cm | Controls texture detail and point density |
| Lens distortion | ≤ 0.4 percent after calibration | Reduces systematic image deformation |
| Exposure synchronization | < 1 ms | Maintains multi-view geometric consistency |
| Position and orientation system | Centimeter-level with differential correction | Improves initial exterior orientation |
| Forward overlap | ≥ 80 percent | Strengthens bundle adjustment |
| Side overlap | ≥ 60 percent, higher in complex areas | Reduces holes and matching ambiguity |
The UAV drone flight plan must balance terrain relief, overlap requirements, and safety. In flat or gently rolling terrain, a constant altitude can be sufficient. In hilly and gully terrain, terrain-following flight is preferable because it maintains a more uniform ground sample distance. If the UAV drone maintains a constant absolute altitude over steep slopes, the effective ground sample distance changes rapidly, and the bundle adjustment may inherit scale and tilt errors. My flight planning therefore uses terrain-following mode when local relief exceeds a predefined threshold.
The acquisition workflow proceeds through four stages. In the preparation stage, I collect existing maps, identify control point locations, and verify the UAV drone platform and sensors. In the design stage, I define flight lines, exposure intervals, and overlap based on terrain and accuracy class. In the flight stage, I record multi-angle images and position and orientation data. In the verification stage, I inspect image sharpness, overlap, and coverage, and I schedule补飞? No, I schedule reflight for gaps or blurred images. This final check is essential because missing data cannot be recovered reliably during post-processing.
3. Four-Layer Accuracy Analysis System Architecture
I design the multi-source surveying accuracy analysis system as a four-layer architecture: data layer, processing layer, analysis layer, and application layer. This structure separates data management from computation and quality reporting. It also allows new sensors and algorithms to be added without rebuilding the entire system. Table 2 presents the responsibilities and outputs of each layer.
| Layer | Core Function | Main Inputs | Main Outputs |
|---|---|---|---|
| Data layer | Unified storage and version management | UAV drone oblique products, laser point clouds, GNSS/IMU data, ground control points, historical maps | Indexed multi-source datasets with time and space metadata |
| Processing layer | Format conversion, coordinate unification, denoising, registration | Raw and semi-processed multi-source data | Aligned point clouds, rasters, and surface models |
| Analysis layer | Geometric evaluation, attribute validation, error statistics | Aligned products and checkpoints | Accuracy indicators, error surfaces, statistical models |
| Application layer | Visualization, reporting, decision support | Analysis results and user parameters | Interactive maps, accuracy reports, error distribution maps |
The data layer is not a passive file repository. It maintains spatial reference information, acquisition time, sensor type, processing history, and quality flags. Because multi-source accuracy analysis often compares multiple epochs, the data layer must support version tracing. When a UAV drone oblique model is updated, the system should preserve the previous version and record the reason for replacement.
The processing layer performs format conversion, coordinate transformation, noise removal, and registration. It includes algorithms such as statistical outlier removal, cloth simulation filtering, Bursa-Wolf transformation, iterative closest point registration, and grid resampling. In my implementation, I treat each processing step as a traceable operation. If an error is later detected, I can trace it to a specific transformation, filter parameter, or registration iteration.
The analysis layer performs geometric accuracy evaluation, attribute accuracy validation, and error modeling. It compares independent checkpoints with reference coordinates, computes root mean square error and mean error, generates error surfaces, and fits regression models between accuracy and acquisition parameters. The analysis layer also produces uncertainty budgets that separate random error from systematic error.
The application layer provides visualization and reporting. It allows users to inspect error distribution, compare epochs, and export quality reports. The application layer should not hide uncertainty behind a single pass or fail label. Instead, it should show where errors are concentrated and which source or processing step is most likely responsible.
4. Multi-Source Data Access and Preprocessing
Heterogeneous data is the first practical challenge in a multi-source accuracy analysis system. The system must accept UAV drone oblique products such as OSGB and 3D Tiles, laser point clouds, digital elevation models, digital surface models, and ground survey records. Each data type has different semantics, precision, and storage structure. I use a differentiated preprocessing strategy rather than a single generic filter.
For point cloud data, I apply statistical outlier removal to eliminate isolated points. For UAV drone oblique point clouds, I use multi-zone least-squares fitting to preserve continuous terrain features while suppressing noise. For laser point clouds, I may apply cloth simulation filtering to separate ground and non-ground points. For raster products, I check nodata values, resolution, and vertical datum. For ground survey data, I verify coordinate reference system, observation epoch, and instrument accuracy.
Coordinate unification is essential. I use a seven-parameter Bursa-Wolf transformation to convert different sources into a common geodetic coordinate frame. The transformation can be expressed as
$$\begin{bmatrix}X\\Y\\Z\end{bmatrix}_{target} = \begin{bmatrix}\Delta X\\\Delta Y\\\Delta Z\end{bmatrix} + (1+m) \begin{bmatrix}1 & \varepsilon_Z & -\varepsilon_Y\\ -\varepsilon_Z & 1 & \varepsilon_X\\ \varepsilon_Y & -\varepsilon_X & 1\end{bmatrix} \begin{bmatrix}X\\Y\\Z\end{bmatrix}_{source}$$
where \(\Delta X,\Delta Y,\Delta Z\) are translations, \(m\) is scale correction, and \(\varepsilon_X,\varepsilon_Y,\varepsilon_Z\) are small rotation angles. After coordinate unification, I resample all data to a common grid using either inverse distance weighting or Kriging. Inverse distance weighting is computationally efficient and suitable for dense, well-distributed data. Kriging is more appropriate when spatial correlation is strong and the data include clustered observations.
$$Z(x_0)=\frac{\sum_{i=1}^{m} w_i Z(x_i)}{\sum_{i=1}^{m} w_i}, \quad w_i=\frac{1}{d(x_0,x_i)^p}$$
$$\hat{Z}(x_0)=\sum_{i=1}^{m}\lambda_i Z(x_i), \quad \sum_{i=1}^{m}\lambda_i=1$$
Table 3 summarizes the main data types and their preprocessing operations in my system.
| Data Type | Common Formats | Key Preprocessing | Quality Concern |
|---|---|---|---|
| UAV drone oblique model | OSGB, 3D Tiles, OBJ | Noise filtering, texture check, coordinate conversion | Local geometric deformation and occlusion holes |
| Laser point cloud | LAS, LAZ, PLY | Outlier removal, ground filtering, thinning | Density variation and vegetation penetration |
| Digital elevation model | GeoTIFF, ASCII grid | Datum check, resampling, void filling | Vertical bias and interpolation smoothing |
| Digital surface model | GeoTIFF, IMG | Surface class separation, edge preservation | Building and vegetation mixing |
| Ground survey | CSV, TXT, database | Coordinate transformation, blunder detection | Observation error and point identification mismatch |
5. Accuracy Evaluation Indicators and Analytical Models
I evaluate accuracy from two perspectives: geometric accuracy and attribute accuracy. Geometric accuracy includes planimetric position, vertical elevation, surface distance, and volume. Attribute accuracy includes classification correctness, object boundary agreement, and semantic consistency. For geometric accuracy, I use root mean square error, mean error, standard deviation, and the 90 percent linear error. For attribute accuracy, I use intersection over union and the Kappa coefficient.
The root mean square error for a set of checkpoints is
$$RMSE_X = \sqrt{\frac{1}{n}\sum_{i=1}^{n}(X_i^{obs}-X_i^{ref})^2}$$
$$RMSE_Y = \sqrt{\frac{1}{n}\sum_{i=1}^{n}(Y_i^{obs}-Y_i^{ref})^2}$$
$$RMSE_H = \sqrt{\frac{1}{n}\sum_{i=1}^{n}(H_i^{obs}-H_i^{ref})^2}$$
For planar accuracy, I combine the horizontal components:
$$RMSE_{2D} = \sqrt{\frac{1}{n}\sum_{i=1}^{n}\left[(X_i^{obs}-X_i^{ref})^2+(Y_i^{obs}-Y_i^{ref})^2\right]}$$
The mean error reveals systematic bias:
$$ME = \frac{1}{n}\sum_{i=1}^{n} d_i$$
where \(d_i\) is the signed residual for checkpoint \(i\). The standard deviation describes random dispersion around the mean:
$$SD = \sqrt{\frac{1}{n-1}\sum_{i=1}^{n}(d_i-ME)^2}$$
For surveying practice, I also compute the conventional mean square error using the checkpoint residuals:
$$\sigma = \pm \sqrt{\frac{\sum_{i=1}^{n}\Delta_i^2}{n}}$$
where \(\Delta_i\) is the coordinate deviation of checkpoint \(i\). For vertical products, I report the 90 percent linear error. If the residuals are approximately normal and unbiased, this can be approximated as
$$LE90 \approx 1.645 \sigma_H$$
For attribute accuracy, intersection over union is defined as
$$IoU = \frac{TP}{TP+FP+FN}$$
where \(TP\), \(FP\), and \(FN\) are true positive, false positive, and false negative areas or pixels. The Kappa coefficient is
$$\kappa = \frac{p_o-p_e}{1-p_e}$$
where \(p_o\) is observed agreement and \(p_e\) is expected agreement by chance. These indicators are useful when UAV drone oblique products are used to classify terrain objects, roads, buildings, or vegetation.
Table 4 presents the main accuracy indicators and their roles in my evaluation framework.
| Indicator | Formula Symbol | Interpretation | Typical Use |
|---|---|---|---|
| Root mean square error | \(RMSE\) | Overall magnitude of residuals | Planar and vertical accuracy |
| Mean error | \(ME\) | Systematic bias direction and size | Calibration and datum check |
| Standard deviation | \(SD\) | Random error dispersion | Precision assessment |
| Mean square error | \(\sigma\) | Surveying standard accuracy indicator | Compliance evaluation |
| 90 percent linear error | \(LE90\) | Vertical error at 90 percent confidence | Elevation product quality |
| Intersection over union | \(IoU\) | Boundary and area overlap quality | Object extraction |
| Kappa coefficient | \(\kappa\) | Classification agreement beyond chance | Attribute validation |
I use three analytical models to move beyond simple pass or fail evaluation. The first is an error propagation model. If a derived quantity \(f\) depends on several variables \(x_j\), the variance can be approximated as
$$\sigma_f^2 = \sum_{j=1}^{m}\left(\frac{\partial f}{\partial x_j}\right)^2\sigma_{x_j}^2 + 2\sum_{j<k}\frac{\partial
This model helps me trace how camera calibration error, position and orientation error, and ground control point error propagate into the final UAV drone oblique product.
The second is a spatial interpolation model. I use checkpoint residuals to generate a continuous error surface. This surface reveals whether errors are randomly distributed or spatially clustered. A clustered pattern often indicates residual systematic bias caused by coordinate transformation, bundle adjustment, or terrain-dependent scale error.
The third is a regression model. I relate accuracy to flight height, forward overlap, side overlap, ground control point density, and terrain roughness:
$$\sigma_H = \beta_0 + \beta_1 h + \beta_2 O_c + \beta_3 O_s + \beta_4 N_{GCP} + \beta_5 R_t + \epsilon$$
where \(h\) is flight height, \(O_c\) is forward overlap, \(O_s\) is side overlap, \(N_{GCP}\) is ground control point density, and \(R_t\) is terrain roughness. This model allows me to optimize future UAV drone missions instead of relying only on fixed rules of thumb.
6. Registration and Fusion of UAV Drone and Multi-Source Data
Registration is the bridge between UAV drone oblique data and other sources. UAV drone point clouds and laser point clouds are complementary. UAV drone data provide dense texture and multi-angle geometry, while laser data provide direct range measurements and better penetration in some vegetation conditions. Fusing them reduces coverage gaps and improves surface completeness. I implement registration in two stages: coarse registration and fine registration.
In coarse registration, I use manually identifiable features such as building corners, road markings, or stable terrain breaklines. These features provide an initial alignment. In fine registration, I use the iterative closest point algorithm to minimize the distance between source and target point clouds. The classical point-to-point objective function is
$$E(R,t)=\frac{1}{n}\sum_{i=1}^{n}\left\|p_i-(Rq_i+t)\right\|^2$$
where \(p_i\) is a target point, \(q_i\) is a source point, \(R\) is a rotation matrix, and \(t\) is a translation vector. The algorithm iteratively updates correspondence and transformation:
$$R_{k+1},t_{k+1}=\arg\min_{R,t} E(R,t)$$
For surfaces with smooth geometry, a point-to-plane variant often converges faster:
$$E(R,t)=\sum_{i=1}^{n}\left((Rq_i+t-p_i)\cdot n_i\right)^2$$
where \(n_i\) is the local surface normal at the target point. I use point-to-plane iterative closest point when the point cloud contains large planar regions such as roads, walls, and terraces. I use point-to-point iterative closest point when the geometry is irregular and normals are unstable.
Table 5 summarizes the registration and fusion stages in my workflow.
| Stage | Method | Purpose | Quality Check |
|---|---|---|---|
| Coarse registration | Feature-based alignment | Bring sources into approximate alignment | Feature residual and visual inspection |
| Fine registration | Point-to-point or point-to-plane ICP | Minimize geometric distance | Convergence curve and residual RMSE |
| Outlier rejection | Distance threshold and robust weighting | Remove incorrect correspondences | Inlier ratio and spatial distribution |
| Fusion | Voxel or grid integration | Create unified surface representation | Completeness and surface continuity |
| Validation | Checkpoint comparison | Confirm fusion accuracy | Planar and vertical RMSE |
7. Error Sources and Control Measures
Accuracy in UAV drone oblique photography is affected by hardware, operation, processing, and environment. These error sources interact. For example, insufficient overlap can cause matching ambiguity, which then increases processing error, and vegetation occlusion can create data gaps that bias surface interpolation. I therefore treat error control as a system design problem rather than a post-processing correction problem.
Table 6 presents the main error sources and control measures that I apply.
| Error Type | Main Source | Effect on Accuracy | Control Measure |
|---|---|---|---|
| Hardware error | Lens distortion, position and orientation error | Systematic position shift | Camera calibration and differential positioning |
| Operational error | Insufficient overlap, altitude variation | Point cloud holes and uneven resolution | Terrain-following flight and higher overlap |
| Processing error | Bundle adjustment and dense matching error | Local geometric deformation | Denser control points and optimized solver parameters |
| Environmental error | Vegetation occlusion and water reflection | Texture loss and elevation anomaly | Multi-source fusion and semantic filtering |
| Registration error | Incorrect correspondence and initial alignment | Layer offset and surface mismatch | Robust ICP and feature-based coarse registration |
| Reference error | Checkpoint coordinate uncertainty | Biased accuracy estimate | Independent high-precision checkpoints |
I consider hardware error first because it is systematic. Lens distortion should be calibrated before the mission. If the UAV drone uses a consumer-grade global navigation satellite system without differential correction, the position and orientation data may contain meter-level drift. This drift can cause point cloud layering and inconsistent scale. I therefore recommend carrier-phase differential or post-processed kinematic correction for projects that require high geometric accuracy.
Operational error is controlled through mission design. Forward overlap should be at least 80 percent, and side overlap should be at least 60 percent in ordinary terrain. In dense built-up areas or areas with strong vegetation occlusion, I increase overlap further. Terrain-following flight is required when relief is significant. The goal is not simply to collect more images, but to maintain a strong multi-view network and a uniform ground sample distance.
Processing error is controlled through bundle adjustment diagnostics. I inspect reprojection error, camera calibration stability, and tie point distribution. If the reprojection error has spatial structure, it usually indicates residual camera model error or inaccurate control points. Dense matching error is reduced by increasing image redundancy and by masking water, sky, and moving objects.
Environmental error is the most difficult to eliminate completely. Vegetation occlusion can hide the ground surface, and water reflection can create false matches. Multi-source fusion helps because laser point clouds can fill some gaps, while semantic filtering can remove false surfaces. However, fusion does not remove the need for field verification. I always retain independent checkpoints in vegetated and water-adjacent areas to quantify residual uncertainty.
8. Experimental Design and Verification Area
I selected a representative loess hilly and gully verification area to test the integrated workflow. The terrain is fragmented, with steep slopes, dense gullies, and small check dams. This type of terrain is challenging for UAV drone oblique photography because relief changes rapidly and occlusions are common. It is also a good test of multi-source fusion because laser point clouds and ground surveys can provide independent reference information.
I used a five-lens UAV drone oblique camera system. The flight was planned with terrain-following mode. The forward overlap was set to 80 percent or higher, and the side overlap was set to 65 percent or higher. The ground sample distance was kept between 1.5 cm and 2.0 cm. Differential global navigation satellite system positioning was used for the UAV drone trajectory. Ground control points were distributed across flat areas, slopes, and gully bottoms. Independent checkpoints were measured using real-time kinematic global navigation satellite system observations.
Table 7 summarizes the flight and acquisition parameters.
| Item | Design Value |
|---|---|
| UAV drone type | Multi-rotor with five-lens oblique camera |
| Flight mode | Terrain following |
| Forward overlap | ≥ 80 percent |
| Side overlap | ≥ 65 percent |
| Ground sample distance | 1.5 cm to 2.0 cm |
| Positioning | Differential GNSS and IMU |
| Ground control points | Distributed across terrain classes |
| Checkpoints | ≥ 30 independent points |
| Reference data | Laser point cloud and ground survey |
The checkpoint distribution is important because a single global error value can hide terrain-dependent bias. I distributed checkpoints across flat ground, moderate slopes, steep slopes, and gully bottoms. I also included checkpoints near check dams and terraces because these features are relevant to terrain monitoring. Table 8 shows the checkpoint distribution used in my evaluation.
| Terrain Class | Number of Checkpoints | Main Challenge |
|---|---|---|
| Flat ground | 8 | Texture uniformity |
| Moderate slope | 8 | Perspective distortion |
| Steep slope | 7 | Occlusion and shadow |
| Gully bottom | 5 | Vegetation and water reflection |
| Check dam area | 4 | Sharp elevation change |
| Terrace area | 3 | Repeated texture |
9. Accuracy Results and Analysis
After bundle adjustment, dense matching, and multi-source registration, I compared the UAV drone oblique model with independent checkpoints. The planar root mean square error was approximately ±0.198 m, and the vertical root mean square error was approximately ±0.235 m. These values satisfy the assigned tolerance for the tested terrain class and mapping scale. I also evaluated derived features such as dam crest elevation, dam height, and reservoir capacity. The relative capacity error was below 3 percent, and the maximum relative error of dam information was below 4 percent.
Table 9 presents the overall accuracy results.
| Accuracy Indicator | Result | Assigned Tolerance | Status |
|---|---|---|---|
| Planar position RMSE | ±0.198 m | ≤ 0.25 m | Pass |
| Vertical RMSE | ±0.235 m | ≤ 0.33 m | Pass |
| Mean dam crest elevation deviation | 0.12 m | Not fixed | Acceptable |
| Mean dam height deviation | 0.08 m | Not fixed | Acceptable |
| Reservoir capacity relative error | 2.8 percent | ≤ 5 percent | Pass |
| Maximum dam information relative error | < 3.8 percent | Not fixed | Acceptable |
The results show that the UAV drone oblique product is not uniformly accurate. Errors are smaller in flat and moderate slope areas and larger in steep slopes and gully bottoms. This is expected because steep slopes have fewer visible correspondences and stronger perspective distortion, while gully bottoms may be partially occluded by vegetation. Table 10 presents the accuracy by terrain class.
| Terrain Class | Planar RMSE | Vertical RMSE | Interpretation |
|---|---|---|---|
| Flat ground | ±0.132 m | ±0.151 m | Strong texture and stable geometry |
| Moderate slope | ±0.174 m | ±0.203 m | Good correspondence and adequate overlap |
| Steep slope | ±0.241 m | ±0.287 m | Occlusion and perspective effects |
| Gully bottom | ±0.263 m | ±0.312 m | Vegetation and shadow influence |
| Check dam area | ±0.188 m | ±0.221 m | Sharp edges well captured by oblique views |
I also compared the UAV drone oblique surface with the laser point cloud reference. The fusion process reduced holes and improved surface continuity. In areas where the UAV drone model had matching ambiguity caused by repeated terrace texture, the laser point cloud provided independent geometric constraints. In areas where the laser point cloud was sparse, the UAV drone model provided dense texture and multi-angle coverage. This complementarity is the main reason I recommend a two-stage registration and fusion strategy.
Table 11 summarizes the feature extraction comparison.
| Feature | UAV Drone Oblique Result | Reference Result | Deviation |
|---|---|---|---|
| Dam crest elevation | Extracted from fused surface | Ground survey | 0.12 m mean |
| Dam height | Derived from surface | Ground survey | 0.08 m mean |
| Reservoir capacity | Volume calculation | Field survey | 2.8 percent relative |
| Dam boundary | Oblique model boundary | Field boundary | < 3.8 percent relative |
10. Sensitivity and Uncertainty Analysis
A single accuracy value is not enough to support engineering decisions. I therefore analyze how accuracy changes with flight height, overlap, ground control point density, and terrain roughness. The sensitivity analysis uses the regression model introduced earlier. Table 12 presents the qualitative and quantitative trends observed in my tests.
| Factor | Change | Observed Effect on Vertical RMSE | Recommended Action |
|---|---|---|---|
| Flight height | Increase | Error increases because ground sample distance becomes coarser | Use terrain following and lower altitude for steep areas |
| Forward overlap | Increase from 70 to 85 percent | Error decreases and matching stability improves | Maintain at least 80 percent |
| Side overlap | Increase from 50 to 70 percent | Error decreases and holes are reduced | Use 60 to 70 percent depending on terrain |
| Ground control point density | Increase | Systematic bias decreases until saturation | Distribute control points evenly and include elevation variation |
| Terrain roughness | Increase | Error increases due to occlusion and relief change | Use multi-source fusion and more oblique views |
I constructed an uncertainty budget to separate the main contributors to vertical error. The budget includes camera calibration, position and orientation, ground control point coordinates, bundle adjustment, dense matching, registration, and checkpoint reference error. Table 13 presents a simplified budget.
| Uncertainty Component | Estimated Contribution to Vertical RMSE | Control Priority |
|---|---|---|
| Camera calibration | 0.04 m | High |
| Position and orientation | 0.06 m | High |
| Ground control point coordinates | 0.05 m | High |
| Bundle adjustment | 0.07 m | Medium to high |
| Dense matching | 0.09 m | Medium |
| Registration and fusion | 0.06 m | Medium |
| Checkpoint reference | 0.03 m | Medium |
| Environmental occlusion | 0.10 m | High in vegetated areas |
The budget shows that no single component dominates completely. Dense matching and environmental occlusion are the largest contributors in this terrain. This means that improving only the UAV drone camera or only the global navigation satellite system will not solve all accuracy problems. The full processing chain must be optimized together.
11. Quality Control Workflow
I implement quality control as a sequence of gates. Each gate has an acceptance criterion and a fallback action. If a gate fails, the data do not proceed to the next stage until the problem is corrected. This prevents small early errors from becoming large final errors.
Table 14 presents the quality control gates in my workflow.
| Gate | Check | Acceptance Criterion | Action if Failed |
|---|---|---|---|
| Acquisition gate | Image sharpness and overlap | No blurred images and overlap within design range | Re-fly affected lines |
| Calibration gate | Camera calibration residual | Residual below project threshold | Recalibrate camera |
| Bundle adjustment gate | Reprojection error and control point residual | No spatial pattern in residuals | Add control points and re-optimize |
| Dense matching gate | Point cloud completeness | No large holes in critical areas | Adjust matching parameters or fuse laser data |
| Registration gate | ICP convergence and residual | Stable convergence and low surface distance | Improve coarse alignment |
| Accuracy gate | Checkpoint RMSE | Meets assigned tolerance | Review error sources and repeat processing |
| Reporting gate | Uncertainty statement | Clear confidence and limitations | Add missing metadata or re-evaluate |
12. Practical Recommendations
Based on my analysis, I recommend the following practices for integrating UAV drone oblique photography into a multi-source surveying accuracy analysis system. First, treat the UAV drone mission as a measurement system. Calibrate the camera, verify the position and orientation system, and document every parameter. Second, use terrain-following flight in hilly and gully areas. Constant altitude is acceptable only when relief is small. Third, maintain high forward and side overlap. The cost of additional images is usually lower than the cost of reprocessing or re-flying. Fourth, distribute ground control points across terrain classes and elevation ranges. A dense cluster of control points in flat areas does not constrain steep slopes well. Fifth, use independent checkpoints that are not used in bundle adjustment. Sixth, fuse UAV drone data with laser point clouds when available, especially in vegetated or shadowed areas.
I also recommend that accuracy reports include spatial error maps rather than only a single global RMSE. A global value can hide systematic bias. A spatial error map shows whether errors are clustered along gully bottoms, steep slopes, or coordinate transformation boundaries. This information is more useful for deciding where to improve the model or collect additional field data.
13. Limitations and Future Work
My study has several limitations. The verification area represents one type of terrain, so the numerical results should not be generalized to all landscapes without further testing. The evaluation is based on single-epoch data, so it does not describe how accuracy changes over time. The reference data also have their own uncertainty, although I selected high-precision checkpoints to reduce this effect. Finally, the fusion process was tested with laser point clouds and ground surveys, but other sources such as thermal infrared or hyperspectral data were not included.
Future work should extend the framework in three directions. First, I plan to test the workflow across multiple terrain types, including urban, agricultural, wetland, and mountainous areas. Second, I plan to incorporate temporal analysis so that repeat UAV drone missions can be used to detect surface change and evaluate change accuracy. Third, I plan to integrate semantic segmentation and deep learning to improve object extraction and attribute accuracy. The accuracy analysis system should eventually support real-time or near-real-time quality assessment, especially for emergency surveying and dynamic monitoring.
14. Conclusion
In this article, I presented a complete framework for integrating UAV drone oblique photography into a multi-source surveying data accuracy analysis system. The framework includes a four-layer architecture, differentiated preprocessing, two-stage registration, multiple accuracy indicators, and a quality control workflow. I used the collinearity equation to describe image-to-ground geometry, the Bursa-Wolf transformation to unify coordinate frames, and iterative closest point algorithms to align point clouds. I evaluated planar and vertical accuracy using root mean square error, mean error, standard deviation, and the 90 percent linear error. I also used intersection over union and the Kappa coefficient for attribute accuracy.
The verification results show that UAV drone oblique photography can achieve planar RMSE of approximately ±0.198 m and vertical RMSE of approximately ±0.235 m in a challenging loess hilly and gully environment. These values meet the assigned tolerance for the tested mapping scale and terrain class. The fusion of UAV drone data with laser point clouds and ground surveys improves surface completeness and provides independent control for accuracy evaluation. The main conclusion is that UAV drone oblique photography is not simply a visualization technology. When integrated with rigorous registration, error modeling, and quality control, it becomes a reliable geometric data source for multi-source surveying accuracy analysis. The approach is practical, traceable, and suitable for further extension to real-time monitoring and intelligent quality assessment.