
In recent years, the proliferation of unmanned aerial vehicles (UAVs), particularly small and miniaturized drones, has posed significant challenges to security systems worldwide. These UAVs, often referred to as “low, slow, and small” (LSS) targets, can be used for surveillance, smuggling, or even attacks, threatening critical infrastructure, public events, and military installations. The need for effective anti-UAV systems has become urgent, driving research into integrated defense solutions that combine detection, identification, and neutralization capabilities. However, designing such systems is complex due to the dynamic nature of UAV threats, especially when deployed in swarms, which exhibit emergent behaviors that are difficult to counter with traditional methods. This necessitates a system-of-systems approach, where multiple components interact to form a cohesive defense network. In this context, the Observe-Orient-Decide-Act (OODA) loop, a classic military command and control model, provides a valuable framework for understanding and optimizing anti-UAV operations. This article explores the application of the OODA model to anti-UAV system-of-systems combat, leveraging multi-agent modeling and simulation via the NetLogo platform to analyze interactions and improve effectiveness.
The OODA loop, originally developed by military strategist John Boyd, describes a cyclic process of observation, orientation, decision, and action that underpins decision-making in competitive environments. In anti-UAV scenarios, this model can be applied to both the UAV attackers and the defensive systems, creating a layered adversarial dynamic. The core idea is that the side with a faster OODA cycle can gain a decisive advantage by acting more quickly and adaptively. For anti-UAV systems, this means accelerating the detection, assessment, and engagement of UAV threats while disrupting the OODA cycles of the attackers. The OODA cycle time, denoted as \( T_{\text{OODA}} \), is a critical metric that can be broken down into components: the time from observation to orientation (\( \Delta t_1 \)), orientation to decision (\( \Delta t_2 \)), decision to action (\( \Delta t_3 \)), and action to the next observation (\( \Delta t_4 \)). Mathematically, this is expressed as:
$$ T_{\text{OODA}} = \Delta t_1 + \Delta t_2 + \Delta t_3 + \Delta t_4 $$
Each component depends on various factors, such as sensor network efficiency (\( \lambda_T \) for information exchange rate), decision-making speed (\( \lambda_{C2} \) for command and control), deployment rate (\( \lambda_E \)), and engagement rate (\( \lambda_F \)). A simplified formulation relates these rates to the OODA time:
$$ T_{\text{OODA}} \approx \frac{1}{\lambda_T} + \frac{1}{\lambda_{C2}} + \frac{1}{\lambda_E} + \frac{1}{\lambda_F} $$
This highlights the importance of optimizing each phase to reduce \( T_{\text{OODA}} \). In anti-UAV operations, shortening the defensive OODA cycle while prolonging the attacker’s cycle is key to success. This article delves into how the OODA model structures anti-UAV systems, enabling a holistic approach to counter-drone defense.
To understand the anti-UAV OODA system-of-systems combat, it is essential to analyze both the UAV and anti-UAV systems independently. A typical UAV system consists of the air vehicle, a mission planning and control station (MPCS), payloads, and a data link. The air vehicle, which can be fixed-wing or rotary-wing, carries sensors and effectors, while the MPCS processes data and issues commands. The operational flow follows the OODA loop: sensors observe the environment, data is transmitted to the MPCS for orientation (e.g., threat assessment), operators decide on actions, and the UAV executes them. This cycle allows UAVs to perform tasks like reconnaissance or strikes adaptively. For instance, a UAV swarm can coordinate attacks through shared information, creating a distributed OODA network that enhances resilience and effectiveness.
In contrast, anti-UAV systems are designed to detect, identify, and neutralize UAV threats. They typically integrate multiple sensors (e.g., radar, radio frequency detectors, electro-optical systems), a command and control (C2) center, and various countermeasures (e.g., jamming, spoofing, directed energy weapons). The anti-UAV OODA loop mirrors that of the UAV: sensors observe incoming drones, the C2 fuses data for orientation (e.g., classifying threats), decisions are made on response tactics, and countermeasures are activated. This creates a competitive OODA dynamic where both sides strive to outpace each other. The anti-UAV system must be agile enough to handle diverse threats, from single drones to swarms, requiring robust networking and real-time processing. The integration of these components into a cohesive system-of-systems is critical for effective anti-UAV operations.
The anti-UAV OODA system-of-systems combat model formalizes this interaction. It views UAVs and anti-UAV systems as interconnected agents operating within their OODA cycles. The model emphasizes time competition: reducing the defensive OODA cycle (\( T_{\text{defense}} \)) and increasing the offensive cycle (\( T_{\text{attack}} \)) to achieve superiority. This can be represented as a differential equation where the probability of successful defense \( P_d \) depends on the cycle time difference:
$$ P_d = f(T_{\text{attack}} – T_{\text{defense}}) $$
If \( T_{\text{defense}} < T_{\text{attack}} \), the anti-UAV system is more likely to intercept threats. The model also considers emergent behaviors, such as swarm intelligence in UAVs, which can shorten \( T_{\text{attack}} \) through collaborative sensing and decision-making. To counteract this, anti-UAV systems must employ distributed sensors and adaptive C2 to maintain a faster cycle. This model provides a theoretical foundation for designing and evaluating anti-UAV architectures.
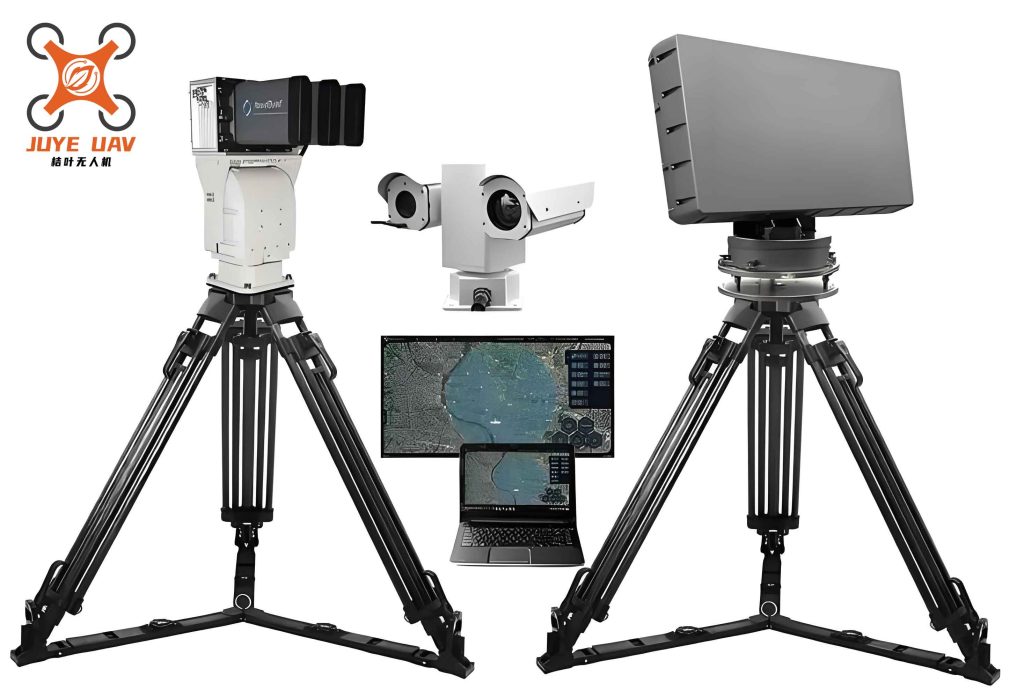
To simulate and analyze the anti-UAV OODA system-of-systems combat, multi-agent modeling is employed, utilizing the NetLogo platform. NetLogo is ideal for this purpose due to its ability to model complex systems with interacting agents, simulating emergent phenomena from simple rules. In our simulation, agents represent UAVs, sensors, C2 centers, and countermeasures, each following OODA-based behaviors. The simulation environment is a 20 km × 20 km grid, with each patch representing 200 m × 200 m, and time advances in ticks (1 tick = 1 second). Key agents and their attributes are summarized in the table below, which includes parameters for detection capability, probability, response times, and engagement ranges. These parameters are derived from typical anti-UAV system specifications, allowing for realistic scenario modeling.
| Agent Type | Quantity (Default) | Speed (m/s) | Detection Range (km) / Probability (%) | Orientation Time (s) | Decision Time (s) | Engagement Range (km) / Probability (%) |
|---|---|---|---|---|---|---|
| Fixed-Wing UAV | 25 | 30 | 5 / 50 | 25 | 50 | 1 / 30 |
| Rotary-Wing UAV | 25 | 15 | 2 / 50 | 25 | 50 | 0.4 / 10 |
| Radar Sensor | 1 | 0 | 9 (fixed-wing) / 6 (rotary) / 90 | — | — | — |
| RF Sensor | 1 | 0 | 8 / 5 / 50 | — | — | — |
| Electro-Optical Sensor | 1 | 0 | 7 / 4 / 50 | — | — | — |
| Command and Control (C2) | 1 | 0 | — | 5 | 10 | — |
| RF Jammer | 1 | 0 | — | — | — | 5 / 3 / 50 |
| Navigation Spoofer | 1 | 0 | — | — | — | 5 / 3 / 50 |
| High-Power Microwave | 1 | 0 | — | — | — | 3 / 2 / 80 |
| Laser Weapon | 1 | 0 | — | — | — | 1.5 / 1 / 80 |
The simulation rules define interactions based on OODA phases. For example, when a UAV enters a sensor’s detection range, it is observed with a certain probability, triggering the orientation phase in the C2 after a delay. The C2 then decides on a response, and if the UAV enters an effector’s range, it is engaged. Similarly, UAVs observe the C2 and decide to attack. The simulation tracks metrics such as the number of UAVs detected (\( n_{\text{C2-Ob}} \)), average detection time (\( t_{\text{C2-Ob}} \)), and engagement success rates. These metrics quantify the OODA cycle performance for both sides, enabling analysis of anti-UAV system effectiveness. The simulation program, written in NetLogo’s language, initializes agents, updates their states per tick, and logs data for post-analysis. The interface includes sliders for parameter adjustment, real-time visualization, and plots for key metrics.
Experiments were conducted to study the impact of OODA cycle times on anti-UAV outcomes. Three groups of simulations were run: Group I (reference with default parameters), Group II (varied C2 capabilities to assess defensive OODA effects), and Group III (varied UAV capabilities to assess offensive OODA effects). Each group comprised 15 simulation runs, and average results were computed. The metrics focused on OODA-related measures, such as detection counts and times, orientation times, decision times, and engagement times. For instance, the defensive OODA cycle time \( T_{\text{defense}} \) can be approximated from simulation data as:
$$ T_{\text{defense}} = t_{\text{C2-Ob}} + (t_{\text{C2-Or}} – t_{\text{C2-Ob}}) + (t_{\text{C2-De}} – t_{\text{C2-Or}}) + (t_{\text{C2-A}} – t_{\text{C2-De}}) $$
where \( t_{\text{C2-Ob}} \) is the average observation time, \( t_{\text{C2-Or}} \) the orientation time, \( t_{\text{C2-De}} \) the decision time, and \( t_{\text{C2-A}} \) the action time. Similarly, for UAVs, \( T_{\text{attack}} \) is derived from corresponding metrics. The results, summarized in tables below, show how changes in parameters affect these times and overall success rates.
| Group | \( n_{\text{C2-Ob}} \) (UAVs Detected) | \( n_{\text{C2-Or}} \) (UAVs Oriented) | \( n_{\text{C2-A}} \) (UAVs Engaged) | \( t_{\text{C2-Ob}} \) (s) | \( t_{\text{C2-Or}} \) (s) | \( t_{\text{C2-A}} \) (s) | Defense Win Rate (%) |
|---|---|---|---|---|---|---|---|
| I (Reference) | 49.8 | 49.0 | 47.4 | 105.4 | 206.3 | 278.6 | 66.7 |
| II-1 (Enhanced C2) | 49.9 | 49.5 | 49.0 | 78.3 | 172.8 | 248.6 | 80.0 |
| II-2 (Degraded C2) | 49.1 | 46.0 | 43.8 | 135.5 | 225.2 | 291.9 | 46.7 |
In Group II-1, where C2 orientation and decision times were reduced (e.g., orientation time decreased from 5s to 2s, decision time from 10s to 5s), the defensive OODA cycle shortened, leading to higher engagement counts and a 13.3% increase in win rate. Conversely, in Group II-2, with longer response times, the cycle prolonged, resulting in fewer engagements and a 20% decrease in win rate. This demonstrates that optimizing the orientation and decision phases is crucial for anti-UAV systems. The data supports the OODA theory that faster cycles confer advantages in dynamic engagements.
| Group | \( n_{\text{UAV-Ob}} \) (C2 Detections) | \( n_{\text{UAV-Or}} \) (C2 Orientations) | \( n_{\text{UAV-A}} \) (C2 Attacks) | \( t_{\text{UAV-Ob}} \) (s) | \( t_{\text{UAV-Or}} \) (s) | \( t_{\text{UAV-A}} \) (s) | UAV Win Rate (%) |
|---|---|---|---|---|---|---|---|
| I (Reference) | 6.5 | 6.4 | 0.4 | 206.5 | 235.5 | 455.6 | 33.3 |
| III-1 (Enhanced UAV) | 30.1 | 29.9 | 0.6 | 184.4 | 196.0 | 386.6 | 53.3 |
| III-2 (Degraded UAV) | 4.3 | 1.9 | 0.3 | 233.6 | 316.6 | 529.3 | 26.7 |
In Group III-1, UAVs had improved detection and faster decision times, shortening their OODA cycle and increasing attacks on the C2, raising their win rate by 20%. In Group III-2, degraded UAV capabilities lengthened the cycle, reducing effectiveness. Interestingly, even with inferior individual OODA cycles, UAV swarms can still threaten C2 through numbers, highlighting the asymmetric nature of anti-UAV challenges. This underscores the need for anti-UAV systems to not only speed up their own cycles but also disrupt swarm coordination, perhaps by jamming communications or employing area-denial weapons.
The simulation also reveals emergent behaviors. For example, when UAVs operate in swarms, they can share observation data, effectively reducing \( \Delta t_1 \) for the group. This can be modeled as a network effect where the swarm OODA cycle time \( T_{\text{swarm}} \) is a function of individual times and communication latency \( \lambda_c \):
$$ T_{\text{swarm}} = \frac{1}{N} \sum_{i=1}^{N} T_{\text{OODA},i} – \alpha \lambda_c $$
where \( N \) is the number of UAVs, and \( \alpha \) is a coupling coefficient. Anti-UAV systems can counter this by targeting the swarm’s communication links, increasing \( \lambda_c \) and thus \( T_{\text{swarm}} \). The simulation allows testing such tactics by adjusting parameters like jamming ranges and probabilities.
Furthermore, the model can be extended to include more realistic factors. For instance, detection probability could vary with distance, following an inverse-square law: \( P_d = P_0 / d^2 \), where \( P_0 \) is a baseline probability and \( d \) is distance. This adds nuance to the observation phase. Similarly, engagement success might depend on countermeasure type and environmental conditions. By incorporating these details, the simulation becomes a powerful tool for anti-UAV system design and evaluation.
In conclusion, the OODA model provides a robust framework for understanding and optimizing anti-UAV system-of-systems combat. Through multi-agent simulation in NetLogo, we have demonstrated that OODA cycle times significantly impact engagement outcomes, with faster defensive cycles correlating to higher success rates. The anti-UAV system must integrate sensors, C2, and effectors into a seamless loop to detect, orient, decide, and act rapidly against UAV threats. Key insights include the importance of reducing orientation and decision delays, the asymmetric threat posed by UAV swarms, and the value of simulation for exploring “what-if” scenarios. Future work could enhance the model by adding stochastic elements, distributed sensor networks, and machine learning for adaptive decision-making. Ultimately, this approach aids in developing more effective anti-UAV defenses, ensuring security against evolving drone threats. As UAV technology advances, continuous refinement of OODA-based models will be essential for staying ahead in the anti-UAV domain.
The anti-UAV field is rapidly evolving, and simulations like this help bridge theory and practice. By leveraging multi-agent modeling, researchers and engineers can test anti-UAV strategies in virtual environments, reducing costs and risks. The OODA loop, with its emphasis on speed and adaptability, offers a timeless principle for countering agile threats. Whether defending critical infrastructure or military bases, a well-designed anti-UAV system that masters the OODA cycle can turn the tide against drone incursions, safeguarding assets and lives in an increasingly automated world.