The management of atmospheric emissions from industrial and municipal facilities, particularly those handling biodegradable waste, presents a significant environmental challenge. Traditional monitoring methodologies, often reliant on fixed-point sensors or manual sampling campaigns, are increasingly recognized as inadequate for capturing the complex, dynamic, and spatially heterogeneous nature of pollutant plumes. These conventional approaches suffer from inherent limitations in spatial coverage, temporal resolution, and operational safety, especially in complex terrains or near active emission sources. In response to these challenges, the integration of Unmanned Aerial Vehicles (UAVs) or drones with advanced multi-parameter sensor payloads has emerged as a transformative paradigm for environmental surveillance. This article details the application of a UAV drone-based monitoring system for characterizing the distribution of key pollutant gases—namely Methane (CH4), Hydrogen Sulfide (H2S), Ammonia (NH3), and Volatile Organic Compounds (VOCs)—within a wet waste treatment plant. The core objective is to demonstrate the efficacy of UAV drone technology in mapping horizontal and vertical concentration gradients, identifying emission hotspots, and analyzing the influence of environmental factors on gas dispersion.
The operational principle of our UAV drone monitoring system hinges on the strategic deployment of lightweight, high-precision gas sensors onboard a versatile aerial platform. The system’s configuration is designed to mitigate common pitfalls such as rotor downwash interference, which can distort concentration measurements. Key sensors include a Tunable Diode Laser Absorption Spectroscopy (TDLAS) module for CH4, electrochemical cells for H2S and NH3, a photoionization detector (PID) for VOCs, and an integrated ultrasonic anemometer for meteorological parameters (wind speed, direction, temperature, humidity, pressure). The data acquisition unit logs georeferenced concentration and meteorological data at a high frequency (typically 1 Hz), enabling the construction of detailed spatial models. The flight strategy for a comprehensive site survey often involves a combination of pre-programmed raster scan patterns at multiple altitudes and adaptive plume tracking algorithms. The fundamental advantage of the UAV drone platform is its ability to perform in-situ measurements in three-dimensional space, providing data that is complementary to, and often more revealing than, ground-based or satellite observations.
The comparative advantages of UAV drone-based monitoring over traditional methods are summarized in Table 1.
| Parameter | Traditional Fixed-Point/Mobile Monitoring | UAV Drone-Based Monitoring |
|---|---|---|
| Spatial Coverage | Limited to accessible ground points; poor vertical resolution. | High-density 3D coverage over large and complex areas. |
| Temporal Resolution | Low for manual surveys; fixed stations provide continuous but localized data. | On-demand, rapid deployment for snapshot or quasi-continuous mapping. |
| Access & Safety | Risky or impossible in hazardous, elevated, or confined areas. | Safe, remote access to dangerous or difficult-to-reach locations. |
| Data Integration | Often disparate datasets requiring complex interpolation. | Inherently georeferenced, time-synced multi-parameter data streams. |
| Operational Cost | High for extensive manual campaigns; infrastructure cost for fixed networks. | Relatively low per-survey cost, highly flexible operational planning. |
The core sensing technology on the UAV drone relies on the physical or chemical interaction between the target gas and the sensor. For the quantitative measurement of gas concentration \( C \) along a path, the fundamental relationship for optical sensors like TDLAS is derived from the Beer-Lambert law:
$$ I = I_0 \exp(-\sigma(\nu) \cdot C \cdot L) $$
where \( I \) is the transmitted light intensity, \( I_0 \) is the incident intensity, \( \sigma(\nu) \) is the frequency-dependent absorption cross-section of the target gas, and \( L \) is the optical path length. For electrochemical and PID sensors onboard the UAV drone, the sensor output voltage \( V_{out} \) is typically linearly proportional to the gas concentration over a defined range:
$$ V_{out} = S \cdot C + V_{offset} $$
Here, \( S \) represents the sensor sensitivity, and \( V_{offset} \) is the baseline voltage in clean air. The UAV drone’s flight control system and data logger synchronize these sensor readings with precise positional data from the Global Navigation Satellite System (GNSS) and inertial measurement unit (IMU).
A critical step in UAV drone monitoring is data processing and spatial analysis. Raw concentration data must be corrected for environmental conditions (e.g., temperature and pressure effects on sensor response) and synchronized with positional data. Interpolation techniques, such as Kriging or Inverse Distance Weighting (IDW), are then applied to generate continuous concentration contour maps from the discrete measurement points collected by the UAV drone. The concentration \( Z \) at an unsampled location \( x_0 \) using IDW can be estimated as:
$$ Z(x_0) = \frac{\sum_{i=1}^{n} w_i Z(x_i)}{\sum_{i=1}^{n} w_i}, \quad w_i = \frac{1}{d(x_0, x_i)^p} $$
where \( Z(x_i) \) is the concentration at the \( i \)-th measured point, \( d \) is the distance, \( p \) is a power parameter (typically 2), and \( n \) is the number of neighboring points used. For vertical profile analysis, data from level flights at different altitudes are aggregated to construct concentration-height relationships, revealing buoyancy effects and atmospheric mixing layers.
The technical specifications of the UAV drone and its sensor payload used in this study are detailed in Table 2.
| Component | Model/Specification | Key Parameters & Performance |
|---|---|---|
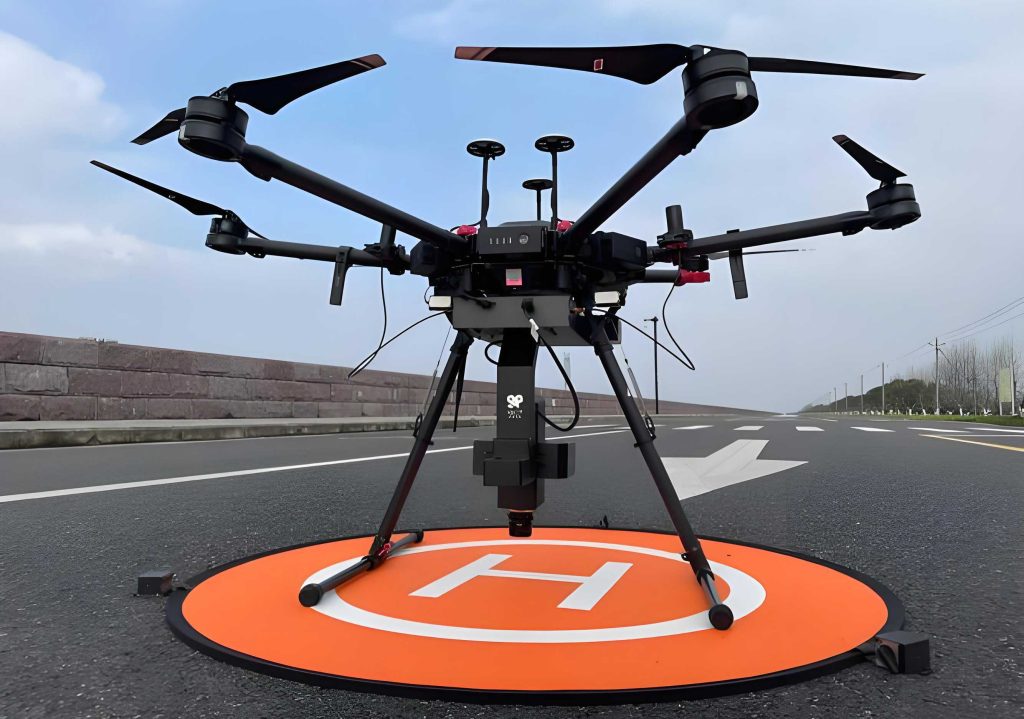
| UAV Platform | Multi-rotor (Hexacopter) | Max Flight Time: 30 min; Max Payload: 2 kg; Wind Resistance: 10 m/s; GNSS/RTK Positioning. |
| CH4 Sensor | TDLAS Module | Range: 0-5000 ppm; Accuracy: ±2% of reading; Response Time (T90): < 3 s. |
| H2S / NH3 Sensor | Electrochemical Cells | Range: 0-100 ppm; Resolution: 0.1 ppm; Cross-sensitivity compensation. |
| VOC Sensor | Photoionization Detector (PID) | Range: 0-1000 ppm (isobutylene equivalent); Minimum Detection Limit: < 0.1 ppm. |
| Meteorological Pack | Ultrasonic Anemometer + T/RH/P | Wind Speed: 0-30 m/s, ±0.1 m/s; Wind Direction: 0-360°, ±2°; T, RH, P logging. |
| Data System | Integrated Logger/Telemetry | 10 Hz sampling; Real-time telemetry to ground station; SD card backup. |
In our field campaign at a wet waste treatment facility, the UAV drone was deployed to perform systematic surveys. The mission plan included: (1) Area Mapping: Flying a lawnmower pattern at a constant altitude (e.g., 20 m AGL) over key functional zones (reception hall, pre-treatment area, digestion tanks, composting pads). (2) Vertical Profiling: Conducting ascents/descents or level flights at multiple altitudes (e.g., 5, 10, 20, 30 m) above suspected emission hotspots. (3) Plume Tracking: Using real-time data to dynamically adjust the UAV drone’s flight path to trace the downwind dispersion of odor plumes. This multi-faceted approach allowed for a comprehensive assessment of emission patterns.
The analysis of data collected by the UAV drone revealed distinct spatial distributions for each pollutant. CH4 exhibited the most widespread elevated concentrations, with maxima consistently detected near anaerobic digestion tanks and landfill gas collection systems. In contrast, H2S and NH3 showed more localized “hotspot” patterns, strongly correlated with active waste handling areas such as the tipping floor and pre-treatment screens. VOC levels, while generally lower, displayed a more diffuse pattern, indicative of fugitive emissions from various sources. The UAV drone’s ability to map these differences in a single survey is a key benefit for targeted mitigation planning.
The vertical distribution data captured by the UAV drone provided crucial insights into atmospheric dispersion. CH4, being less dense than air, showed a tendency for concentrations to increase or remain constant with height near strong sources, indicating buoyant plume rise. H2S, denser than air, often displayed higher concentrations at lower sampling altitudes of the UAV drone, especially under low wind conditions, suggesting ground-level accumulation. NH3, highly soluble and reactive, showed rapid vertical attenuation. These profiles are essential for validating and refining atmospheric dispersion models (e.g., Gaussian plume models) used for environmental impact assessments. The dispersion of a passive pollutant from a point source can be described by a simplified Gaussian model equation, which the UAV drone data helps to parameterize:
$$ C(x, y, z) = \frac{Q}{2\pi u \sigma_y \sigma_z} \exp\left(-\frac{y^2}{2\sigma_y^2}\right) \left[ \exp\left(-\frac{(z-H)^2}{2\sigma_z^2}\right) + \exp\left(-\frac{(z+H)^2}{2\sigma_z^2}\right) \right] $$
where \( C \) is concentration, \( Q \) is emission rate, \( u \) is wind speed, \( \sigma_y \) and \( \sigma_z \) are horizontal and vertical dispersion parameters, \( H \) is effective release height, and \( x, y, z \) are downwind, crosswind, and vertical coordinates from the source.
A significant aspect of the UAV drone study was the investigation of correlations between pollutant concentrations and environmental factors. Statistical analysis (e.g., Pearson or Spearman correlation) was performed on the synchronized dataset. Key findings included strong positive correlations between NH3 concentrations and ambient temperature, likely due to increased volatilization rates. Negative correlations were often observed between pollutant concentrations and wind speed, as higher winds promote dilution. Humidity showed complex relationships, potentially affecting both emission rates (e.g., from wet surfaces) and sensor performance. These correlations, derived from the spatially rich UAV drone data, help in building predictive models for emission forecasting. The correlation coefficient \( r \) between a gas concentration \( G \) and an environmental variable \( E \) (e.g., temperature) is calculated from the UAV drone data pairs \((G_i, E_i)\):
$$ r_{G,E} = \frac{\sum_{i=1}^{n} (G_i – \bar{G})(E_i – \bar{E})}{\sqrt{\sum_{i=1}^{n} (G_i – \bar{G})^2 \sum_{i=1}^{n} (E_i – \bar{E})^2}} $$
A summary of the observed concentration ranges and primary correlations for the major pollutants detected by the UAV drone is presented in Table 3.
| Pollutant | Typical Concentration Range (UAV Survey) | Main Identified Sources (from UAV Hotspots) | Key Environmental Correlations |
|---|---|---|---|
| Methane (CH4) | 2 – 200 ppm (background to hotspot) | Anaerobic digestion tanks, landfill areas, biogas system leaks. | Weak negative correlation with wind speed; minimal with T/RH. |
| Hydrogen Sulfide (H2S) | 0.05 – 5 ppm | Tipping floor, pre-treatment screens, sludge dewatering areas. | Strong negative correlation with wind speed; positive with temperature. |
| Ammonia (NH3) | 0.1 – 10 ppm | Composting piles, wastewater treatment units, fertilizer storage. | Strong positive correlation with temperature; negative with humidity. |
| VOCs (as Isobutylene) | 0.1 – 15 ppm | Fuel storage, vehicle traffic, solvent use, diffuse waste emissions. | Moderate positive correlation with temperature; complex with wind. |
Despite its clear advantages, UAV drone-based monitoring also faces technical and regulatory challenges. Sensor size, weight, and power (SWaP) constraints limit the sophistication of instruments that can be carried. Flight endurance, typically 20-40 minutes for multi-rotor UAV drones, restricts the spatial extent of a single survey. Meteorological conditions, especially high winds or precipitation, can ground flights. Regulatory airspace restrictions and the need for skilled pilots also pose operational hurdles. Furthermore, data validation against standard reference methods is crucial to ensure the accuracy of miniaturized sensors deployed on UAV drones. Future advancements are focused on overcoming these limitations through improved battery technology, automated swarm operations for larger area coverage, the development of more selective and stable miniature sensors (e.g., dual-laser TDLAS, micro-GC), and advanced data fusion algorithms that integrate UAV drone data with satellite imagery and ground station networks.
In conclusion, the deployment of a UAV drone equipped with a multi-parameter gas sensing payload represents a powerful and versatile tool for environmental monitoring. This case study at a waste treatment facility underscores its capacity to provide high-resolution, three-dimensional mapping of pollutant gases, revealing spatial patterns and emission hotspots that are often missed by conventional methods. The UAV drone enables the safe investigation of hazardous or inaccessible areas and offers unparalleled flexibility in survey design. The integration of concurrent meteorological measurements allows for insightful analysis of the factors governing gas dispersion. As sensor technology continues to advance and regulatory frameworks evolve, UAV drone-based monitoring is poised to become a standard component in the environmental inspector’s toolkit, enhancing compliance enforcement, supporting the development of targeted mitigation strategies, and ultimately contributing to improved air quality management. The continued innovation in UAV drone platforms and sensing technologies promises even greater capabilities for understanding and managing complex environmental emissions in the future.