
In modern warfare, small unmanned aerial vehicles (UAVs) and their swarms have become significant threats, challenging current air defense weapon systems. Our research focuses on the high-power microwave (HPM) effects on small fixed-wing UAVs in the S-band. We conducted system-level, subsystem-level, and component-level electromagnetic modeling, coupling simulation, and effect tests. With an incident wave power density of 10 W/cm², simulation results showed that the peak induced voltage on the receiver circuit board pins reached 4.5 V, indicating a risk of disruption. We performed experimental validation using HPM with a power density of 7.9 W/cm², observing that the receiver experienced communication interruption and no output from control pins. This was the main factor causing system disruption, consistent with simulation results. This paper details the methodology, simulation data, and experimental findings, emphasizing the coupling mechanisms and vulnerability of the fixed-wing UAV.
1. Introduction
The rapid advancement of information technology, sensor technology, and aviation materials has continuously pushed the performance of UAVs. Today, UAV development is a key indicator of modern military transformation, profoundly affecting military strategy and operational modes. To counter the threat of high-performance UAV attacks in future combat environments, anti-UAV research has become an important direction. It is not only a crucial way to protect our military facilities and personnel but also a key link to gaining battlefield advantage.
Analyzing the high-power microwave effect on small fixed-wing UAVs is of great significance in both theory and practice. Our study first analyzes the target characteristics of the system under test and the electromagnetic environment it resides in. Then, we combine simulation to analyze the interaction modes of the electromagnetic environment. Finally, we design reasonable test methods to gradually discover and analyze system-level, subsystem-level, and component-level HPM effects. This paper adopts a combined simulation and test approach to explore the mechanism of HPM interaction with a specific small fixed-wing UAV.
2. High-Power Microwave Electromagnetic Environment
According to IEC 61000-2-13, typical high-power electromagnetic environments include nuclear electromagnetic pulse (NEMP), ultra-wideband (UWB), wideband (Mesoband), and narrowband high-power microwave (HPM). Because HPM is radiated directionally through an antenna, its low-altitude radiation characteristics are related to the antenna properties. In the far-field region of a high-power microwave source, the electric field strength is proportional to the distance, which can be expressed by the radar equation:
$$ \frac{P \cdot G}{4\pi R^2} = \frac{E^2}{\eta} $$
where P is the transmitter output power, G is the antenna gain, R is the distance from the antenna, E is the maximum electric field strength, and η is the wave impedance. After transformation:
$$ E = \frac{\sqrt{30 P G}}{R} $$
HPM emission frequencies are concentrated in a narrow range, with high frequency stability and coherence. Peak power ranges from 100 MW to 100 GW, with frequencies from 1 GHz to 300 GHz, covering the centimeter to millimeter wave bands. Narrowband HPM is a pulsed modulated sine wave, and its time-domain waveform can be approximately expressed as:
$$ E(t) = \begin{cases} E_0 \sin(2\pi f_0 t) u(t – T), & 0 < t < T(N+1) \\ 0, & T(N+1) < t \end{cases} $$
where E₀ is the peak electric field, u(t) is the unit step function, f₀ is the carrier frequency, 1/T is the microwave frequency, and N is the number of microwave cycles per pulse. In our tests, we used a narrowband HPM with a center frequency of 3 GHz and pulse width on the order of microseconds. In simulations, to reduce computation time while obtaining reasonable results, we set the pulse width to 3 ns.
3. Electromagnetic Modeling and Simulation of Fixed-Wing UAV
3.1 Fuselage Electromagnetic Modeling and Irradiation Simulation
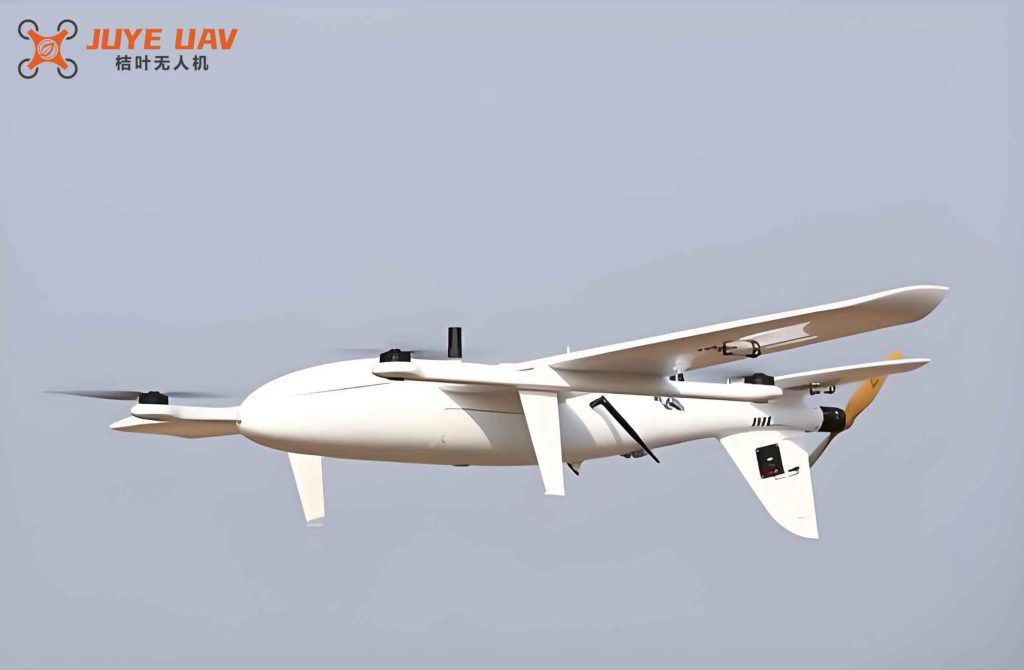
The system under test is a small civilian fixed-wing UAV. The fuselage material is polystyrene with a relative permittivity of 2.55, permeability of 1, and loss tangent of 7 × 10⁻⁴. A small brushless motor at the tail provides propulsion, modeled with iron and copper materials. Key components include the battery, communication control circuit, servos, brushless motor, and associated interconnecting cables. We performed HPM irradiation simulation on the entire fuselage using an S-band plane wave with power density of 10 W/cm². Due to coupling field enhancement, the electric field at the wing tips reached up to 24 kV/m. The field on the wing surfaces was slightly higher than on the fuselage due to polarization effects.
The induced electric field at different positions is summarized in Table 1.
| Component | Location | Peak Induced E-field (kV/m) | Duration (ns) |
|---|---|---|---|
| DC Power | A | 13.9 | 2.3 – 6.0 |
| Receiver | B | 7.9 | 3.3 – 7.6 |
| Wing Servo | C | 6.3 | 3.8 – 6.5 |
| Brushless Motor | D | 9.6 | 7.0 – 10.0 |
3.2 Cable Electromagnetic Modeling and Irradiation Simulation
We built a cable network model for the fixed-wing UAV, including servo control cables, battery power cables, and three-phase brushless motor cables. The cable diameters were 14 mm for servo cables and 50 mm for others. The “long-line effect” is the primary cause of interference in such devices. Based on actual cable routing, we established a field-cable simulation model with vertical polarization incident wave at 10 W/cm². The cable bundle was horizontally distributed inside the fuselage.
The generalized cable network model includes DC battery power lines, brushless motor control lines, fuselage servo control lines, wing servo control lines, and peripheral circuits. Monitoring probes P1–P4 were placed at the output ports of each cable type. Under HPM irradiation, the induced voltage at the wing control line port reached a peak of 1.9 V, while other cables had peak induced voltages around 1 V. Because the incident plane wave was vertically polarized, mismatched with the horizontal cables, and the fuselage coupling enhanced the field, the actual induced voltage is expected to be higher than the simulation.
3.3 Receiver Electromagnetic Modeling and Irradiation Simulation
We performed electromagnetic irradiation simulation on a typical receiver model of the fixed-wing UAV. With an incident power density of 10 W/cm², the induced electric field peak reached 257 kV/m, with multiple sensitive circuit areas exceeding 100 kV/m. Such high field strengths can cause electromagnetic interference in key components and core chips. Voltage monitors detected induced voltages at sensitive locations: port N1 measured the induced voltage on the circuit board pin header, port N2 on the communication chip pin, and port N3 on the control chip pin relative to ground.
The simulation results showed that the induced voltage on the pins could reach 4.5 V, oscillating periodically for about 3 ns. This could potentially cause disruption to the receiver. At higher electric field strengths, damage risk exists. Since the receiver uses a 920 MHz half-wave dipole antenna, coupling to S-band microwaves is negligible, so we only discuss the back-door coupling effect of the receiver.
When the induced voltage on the chip exceeds a threshold, we judge failure. Table 2 shows the induced voltage at different power densities.
| Power Density (W/cm²) | Pin Header (V) | Communication Chip Pin (V) | Control Chip Pin (V) |
|---|---|---|---|
| 1 | 0.45 | 0.1 | 0.08 |
| 3 | 1.35 | 0.3 | 0.24 |
| 5 | 2.25 | 0.5 | 0.4 |
| 7.9 | 3.56 | 0.79 | 0.63 |
| 10 | 4.50 | 1.0 | 0.8 |
The power density and induced voltage are linearly related. When the power density exceeds 5 W/cm², the induced voltage on chip pins and fuselage cables is greater than 1 V, and the induced voltage on the circuit board pin header is greater than 3 V, indicating possible disruption.
4. HPM Effect Test on Fixed-Wing UAV
4.1 Test System Setup
We conducted HPM irradiation effect tests on the fixed-wing UAV system, subsystems, and key components. The HPM simulation source operated in the S-band with vertical polarization. The system’s elevation angle, pulse width, repetition frequency, and power density were adjustable. A microwave measurement system measured the power density. The device under test was placed horizontally facing the microwave source. The relationship between power density and distance is given by the radar equation, and the experimental distance was adjusted accordingly.
4.2 System-Level Test Results
We varied the position of the fixed-wing UAV to obtain the power density threshold for effects. When the power density was 5.5 W/cm², the effect was unstable. At 7.9 W/cm², a stable effect occurred: the receiver lost communication with the controller, the brushless motor stopped, and the servos stopped, causing disruption. After multiple tests at 10.5 W/cm², the system experienced permanent failure. Subsequent tests were conducted at 7.9 W/cm².
4.3 Subsystem-Level Tests
To isolate the contribution of different cable subsystems, we performed tests with the servo cables disconnected, leaving only the receiver connected to the electronic speed controller and brushless motor. Under vertical HPM irradiation at 7.9 W/cm², the communication between the receiver and controller was interrupted, and the brushless motor stopped. This indicated that the servo cables had minimal impact on the system failure.
Next, we disconnected the brushless motor cables, leaving the receiver connected only to the wing servos and battery. Under the same HPM conditions, the receiver again lost communication, and the servos stopped. Comparison showed that the brushless motor and its control cables had minimal influence on the system failure.
4.4 Receiver Subsystem Test
We isolated the receiver subsystem for dedicated testing. Before the test, we measured the waveform of certain pins on the receiver circuit board, including communication pins and control pins. The battery was placed in an EMI shielding box. Under vertical HPM irradiation at 7.9 W/cm², the receiver lost communication with the remote controller. The pre-test waveforms showed normal output on communication and control pins. After irradiation, communication pin 1 output a DC signal, communication pin 2 had no output, and control pin 1 had no output. This confirmed that the receiver was disrupted during irradiation.
The test results are summarized in Table 3.
| Pin | Before Test | After Test |
|---|---|---|
| Communication Pin 1 | Normal communication signal | DC signal (no data) |
| Communication Pin 2 | Normal communication signal | No output |
| Control Pin 1 | Normal PWM output | No output |
In conclusion, cable coupling had a minor effect on the system, while receiver coupling to HPM caused abnormal outputs on chip pins. The receiver was the most sensitive part of this small fixed-wing UAV. When the HPM power density reached 7.9 W/cm², back-door coupling led to a disruption phenomenon in the receiver, consistent with the simulation predictions.
5. Conclusion
We conducted simulation and test analysis of HPM effects on a small fixed-wing UAV. Under microwave irradiation in the range of 1–10 W/cm², simulation showed that induced voltage peaks on system cables were 1.9 V; the induced electric field in the receiver reached 257 kV/m, and the induced voltage on circuit board pins reached 4.5 V, oscillating periodically with duration close to the irradiation time. This indicated a risk of circuit disruption. In test validation at 7.9 W/cm², the receiver module alone exhibited abnormal behavior: communication pins and control pins had no output. The test results agree well with the simulation predictions. Therefore, for the small fixed-wing UAV used in this study, the receiver is the most sensitive subsystem. When the HPM power density exceeds 7.9 W/cm², back-door coupling can indeed cause disruption to the receiver.