
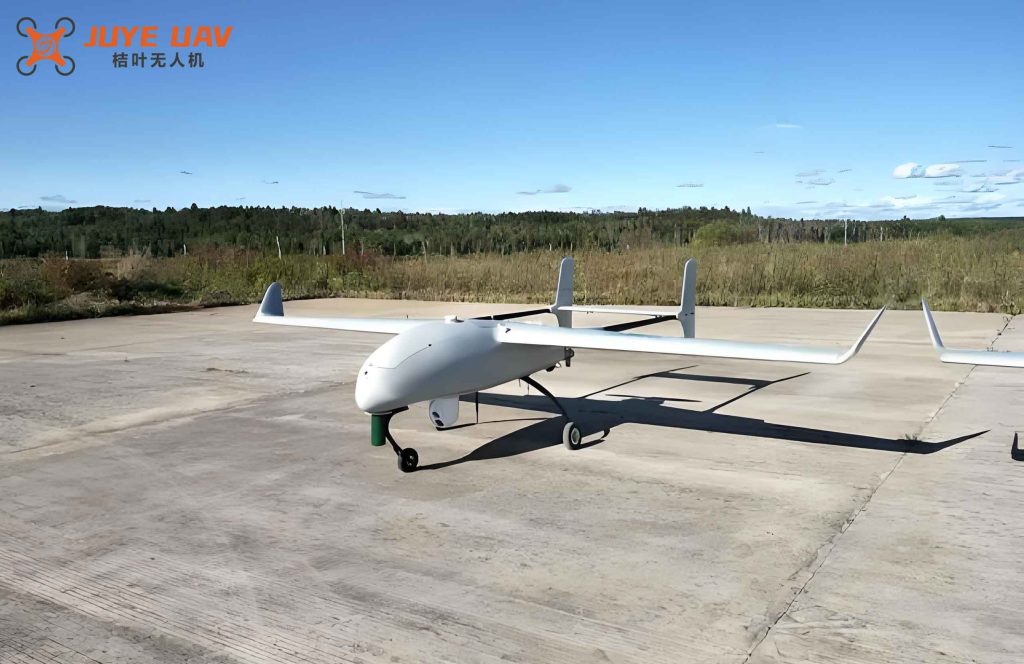
Inspired by the V-shaped formation flight of migratory birds, we investigate the wake surfing effect for fixed-wing unmanned aerial vehicles. The fundamental principle is that the trailing vehicle can harness the upward flow induced by the wingtip vortices of the leading vehicle, thereby reducing aerodynamic drag and increasing lift. This concept, known as wake surfing, has been applied to full-scale aircraft with fuel savings of 9%–14% in flight tests. However, the specific aerodynamic benefits and parametric influences for fixed-wing UAVs require detailed numerical study. In this work, we adopt a computational fluid dynamics approach using overset grids to simulate a two-UAV formation, analyzing how longitudinal and vertical spacing affect the aerodynamic performance of the trailing fixed-wing UAV. We also incorporate Ω vortex identification to visualize and quantify the vortex interactions.
Our study focuses on a standard fixed-wing UAV model with a wingspan b = 2 m. The formation geometry is defined by the longitudinal separation Δx (along the flight direction), the lateral overlap Δz = 0.75b (fractional wingspan overlap), and the vertical offset Δy (positive when the trailing UAV is above the leader). We systematically vary Δx and Δy to assess the wake surfing benefits for the trailing fixed-wing UAV. The leading UAV maintains a constant angle of attack α = 8°, while the trailing UAV is allowed to adjust α to balance lift and weight, thus achieving trimmed flight. The freestream Mach number is 0.44, pressure 88 000 Pa, temperature 280.54 K, and the Reynolds number is based on the wing chord. Air is modeled as an ideal gas with Sutherland viscosity. We use a density-based implicit solver, k-ω SST turbulence model, and the no-slip adiabatic wall condition for both UAV surfaces.
Governing Equations and Numerical Methods
The flow field is governed by the three-dimensional steady compressible Navier-Stokes equations. The continuity, momentum, and energy equations are:
$$ \frac{\partial(\rho u_i)}{\partial x_i} = 0 $$
$$ \frac{\partial(\rho u_i u_j)}{\partial x_j} = F_i + \rho g_i + \frac{\partial \tau_{ij}}{\partial x_j} – \frac{\partial p}{\partial x_i} $$
$$ \nabla \cdot (\rho \mathbf{u} H – K \nabla T – \zeta \mathbf{u}) = W $$
where \(u_i\) is the velocity component in the \(x_i\) direction, \(\rho\) is air density, \(p\) is pressure, \(\tau_{ij}\) is the viscous stress tensor, \(H\) is total enthalpy, \(K\) is thermal conductivity, \(\zeta\) is the shear stress tensor, and \(W\) is the work done by body forces. Turbulence closure is achieved using the k-ω SST model:
$$ \frac{\partial(\rho k)}{\partial t} + \frac{\partial(\rho k u_i)}{\partial x_i} = \frac{\partial}{\partial x_i} \left( \Gamma_k \frac{\partial k}{\partial x_j} \right) + G_k – A_k + B_k $$
$$ \frac{\partial(\rho \omega)}{\partial t} + \frac{\partial(\rho \omega u_i)}{\partial x_i} = \frac{\partial}{\partial x_j} \left( \Gamma_\omega \frac{\partial \omega}{\partial x_j} \right) + G_\omega – A_\omega + D_\omega + B_\omega $$
where \(k\) is turbulent kinetic energy, \(\omega\) is specific dissipation rate, \(\Gamma_k\) and \(\Gamma_\omega\) are diffusion coefficients, \(G_k\) and \(G_\omega\) are production terms, and \(A_k, A_\omega, D_\omega, B_k, B_\omega\) represent dissipation and cross-diffusion terms. The finite volume method is employed to discretize the domain into control volumes, and the equations are solved iteratively.
For overset grid implementation, the background grid is a rectangular domain spanning 16b in length, 8b in width, and 4b in height. The near‑wall region uses a structured grid with first‑layer height \(y^+<1\). Each fixed-wing UAV is embedded as a separate component grid, allowing independent mesh refinement and easy parametric variation of the trailing UAV’s angle of attack without regenerating the entire grid. The total cell count is approximately 10 million. We validated grid independence by testing four mesh densities (3, 5, 10, 15 million cells); the lift‑to‑drag ratio changed by only 1.8% between the coarsest and finest grids, confirming convergence.
Wind Tunnel Validation of Overset Grid
To assess numerical accuracy, we compared the lift coefficient \(C_L\) for a NACA 0012 airfoil computed on both structured and overset grids against experimental data at Re = 360 000. The results are summarized in Table 1.
| \(\alpha\) (°) | Structured grid | Overset grid | Experiment |
|---|---|---|---|
| 0 | 0.000 | 0.000 | 0.000 |
| 4 | 0.345 | 0.348 | 0.350 |
| 8 | 0.698 | 0.705 | 0.710 |
| 12 | 1.020 | 1.031 | 1.035 |
The overset grid results deviate from experimental data by less than 1.5%, demonstrating its reliability for formation flight simulations. Moreover, the overset technique avoids negative volume cells and allows independent motion of subgrids, which is crucial for parametric studies of the trailing fixed-wing UAV.
Formation Flight Aerodynamics: Single vs. Formation
We first compare the aerodynamic coefficients of a single fixed-wing UAV with those of the two‑UAV formation at the same flight conditions (α = 8°, Mach 0.44). The formation geometry is set to Δx = 0.9b, Δy = 0, Δz = 0.75b. The results are presented in Table 2.
| Configuration | \(C_L\) | \(C_D\) | \(C_M\) | \(K = C_L / C_D\) |
|---|---|---|---|---|
| Single UAV (α = 8°) | 0.1522 | 0.0185 | 0.0046 | 8.22 |
| Leading UAV in formation (α = 8°) | 0.1512 | 0.0184 | 0.0047 | 8.21 |
| Trailing UAV in formation (α = 8°) | 0.1689 | 0.0181 | 0.0071 | 9.33 |
| Trailing UAV trimmed (α = 6.54°) | 0.1512 | 0.0149 | 0.0063 | 10.14 |
The data show that the leading fixed-wing UAV experiences negligible aerodynamic change. In contrast, the trailing fixed-wing UAV at the same α = 8° gains a lift increase of 11.7% (from 0.1522 to 0.1689) and a lift‑to‑drag ratio improvement of 13.6%. However, the pitching moment coefficient \(C_M\) also increases from 0.0046 to 0.0071, indicating a nose‑up tendency that must be compensated by control surfaces. When we reduce the trailing UAV’s angle of attack to approximately 6.54°, its lift coefficient returns to 0.1512, matching the leading UAV’s lift and thus balancing weight. Remarkably, the drag coefficient drops to 0.0149, yielding a 23.5% reduction in drag compared to the single UAV case. The corresponding lift‑to‑drag ratio reaches 10.14, a 23.4% improvement. This demonstrates that the wake surfing effect allows the trailing fixed-wing UAV to fly at a lower α while maintaining the same lift, reducing induced drag.
Effect of Longitudinal and Vertical Spacing
We systematically varied the longitudinal separation Δx (from 0.9b to 2.0b) and the vertical offset Δy (0, 0.10b, 0.25b) to explore the parametric sensitivity of wake surfing benefits for the trailing fixed-wing UAV. Table 3 summarizes the trailing UAV’s aerodynamic coefficients for these spacings, with α fixed at 8° for consistency.
| Δy / b | Δx / b | \(C_L\) | \(C_D\) | \(K\) | \(C_M\) |
|---|---|---|---|---|---|
| 0 | 0.9 | 0.1689 | 0.0181 | 9.33 | 0.0071 |
| 1.1 | 0.1641 | 0.0179 | 9.16 | 0.0064 | |
| 1.5 | 0.1583 | 0.0179 | 8.84 | 0.0059 | |
| 2.0 | 0.1542 | 0.0180 | 8.56 | 0.0051 | |
| 0.10 | 0.9 | 0.1637 | 0.0181 | 9.04 | 0.0061 |
| 1.1 | 0.1590 | 0.0180 | 8.83 | 0.0058 | |
| 1.5 | 0.1575 | 0.0181 | 8.71 | 0.0051 | |
| 2.0 | 0.1541 | 0.0182 | 8.46 | 0.0049 | |
| 0.25 | 0.9 | 0.1614 | 0.0182 | 8.89 | 0.0059 |
| 1.1 | 0.1585 | 0.0183 | 8.65 | 0.0054 | |
| 1.5 | 0.1573 | 0.0186 | 8.47 | 0.0049 | |
| 2.0 | 0.1533 | 0.0184 | 8.34 | 0.0048 |
The data reveal that as the longitudinal separation Δx increases, the lift benefit diminishes: the trailing fixed-wing UAV experiences weaker upwash from the leader’s wake vortices. Similarly, a positive vertical offset (trailing UAV higher) reduces the lift advantage. For Δy = 0 and Δx = 0.9b, the trailing fixed-wing UAV achieves maximum lift; further increasing Δx to 2.0b reduces \(C_L\) from 0.1689 to 0.1542 — a 8.7% drop. The pitching moment also decreases with larger spacing, which is favorable for longitudinal stability. In trimmed flight, the required angle of attack for the trailing fixed-wing UAV would be lower for closer spacings, offering greater drag reduction. The overall trend confirms that tighter formations yield higher aerodynamic benefits, but control challenges from increased pitching moment must be managed.
Wake Vortex Visualization and Ω Analysis
To understand the flow physics, we performed vortex identification using the Ω method. The Ω parameter is defined as:
$$ \Omega = \frac{\| \mathbf{E} \|_F^2}{\| \mathbf{E} \|_F^2 + \| \mathbf{M} \|_F^2 + c} $$
where \(\|\mathbf{E}\|_F\) is the Frobenius norm of the antisymmetric part of the velocity gradient tensor (vorticity magnitude), \(\|\mathbf{M}\|_F\) is the norm of the symmetric part (strain rate), and \(c = \max(Q)/500\) with \(Q = 0.5(\|\mathbf{E}\|_F^2 – \|\mathbf{M}\|_F^2)\). The Ω value ranges between 0 and 1; regions with Ω > 0.5 are dominated by rotation and are considered vortices. This method is threshold‑insensitive and captures both strong and weak vortices simultaneously.
In the formation case with Δx = 0.9b and Δy = 0, we extracted a cross‑flow plane at x = 23.63 m (downstream of the leading fixed-wing UAV). The vortex core of the leader’s left wingtip had Ω = 0.84, while the trailing UAV’s right wingtip vortex showed Ω = 0.73. The reduction in Ω for the trailing UAV’s right wingtip is attributed to the interaction with the leader’s left wingtip vortex rotating in the opposite direction, causing partial cancellation. Conversely, the trailing UAV’s left wingtip vortex (Ω = 0.86) was slightly strengthened due to the same‑sense rotation with the leader’s vortex. This asymmetric vortex strength distribution modifies the spanwise lift distribution of the trailing fixed-wing UAV, increasing lift on the inboard side and affecting the induced drag.
For the case with Δy = 0.25b (trailing UAV above the leader), the vertical offset caused the trailing UAV to fly partially outside the leader’s wake core region. The Ω values at the same downstream location were 0.78 and 0.74 for the left and right wingtips, respectively, indicating weaker overall vortex intensity and thus less lift enhancement. This aligns with the aerodynamic data in Table 3, where the lift coefficient is consistently lower for positive Δy.
We also examined the velocity field in the y‑direction (spanwise) at several streamwise locations. The upward flow induced by the leader’s wingtip vortex is clearly visible, with the peak vertical velocity reaching up to 8% of the freestream speed near the vortex core. As Δx increases, the vortex dilates and the induced upward velocity decreases, explaining the reduced wake‑surfing benefit. The trailing fixed-wing UAV positioned in this upward flow experiences an effective increase in local angle of attack over the right wing, thereby increasing lift and altering the pitching moment.
Discussion on Pitch Stability and Control Implications
An important finding is the significant pitching moment increase for the trailing fixed-wing UAV during wake surfing. In the closest formation (Δx = 0.9b, Δy = 0), \(C_M\) rises from 0.0046 (single UAV) to 0.0071, a 54% increase. This nose‑up moment is caused by the upward flow acting stronger near the wing root and the resultant shift in aerodynamic center. If left uncompensated, the trailing fixed-wing UAV would experience a positive pitch acceleration, potentially leading to loss of control. However, by reducing the angle of attack to approximately 6.54°, the pitching moment decreases to 0.0063 while still maintaining lift balance. Even so, the residual pitch moment is 37% higher than the single UAV case. In real flight, the autopilot or control surfaces (elevator) must be able to counteract this moment. The increased pitch stability requirement is a trade‑off for the drag reduction benefit.
Our results suggest that the optimal Δx for fixed-wing UAV formation lies between 1.0b and 1.5b, where the lift increase is still substantial (10–14%) while the pitching moment is moderate. A vertical offset (Δy > 0) reduces both the benefits and the pitch disturbance, but the overall aerodynamic efficiency may still be attractive for extended endurance missions. For swarm operations, multiple fixed-wing UAVs could arrange in a V‑shape with carefully tuned spacing to maximize net fuel savings across the entire fleet.
Conclusion
Through high‑fidelity CFD simulations using overset grids and Ω vortex identification, we comprehensively characterized the wake surfing parameters for fixed-wing UAVs in formation flight. The trailing fixed-wing UAV experiences a maximum lift increase of 11.7% and drag reduction of up to 23.5% when trimmed to maintain weight balance. The aerodynamic benefits strongly depend on longitudinal and vertical spacing; closer formations yield higher benefits but also larger pitching moments. The overset grid technique proved efficient for parametric studies by allowing independent grid motion for each UAV. Our findings provide quantitative guidance for designing formation flight strategies for fixed-wing UAVs, balancing aerodynamic efficiency with stability and control requirements. Future work will extend to multi‑UAV swarms and dynamic maneuvering within the formation.