
As a practitioner deeply embedded in the fields of geomatics and infrastructure management, I have observed a fundamental shift in operational methodologies. The integration of advanced surveying technologies is not merely an enhancement but a complete redefinition of how we measure, monitor, and manage both our built and natural environments. This transformation is largely propelled by the advent and maturation of Unmanned Aerial Vehicle (UAV) technology. In my work, the deployment of UAV drones has transitioned from experimental projects to a core, indispensable toolset. This article synthesizes my perspective on how these technologies, particularly UAV-based photogrammetry and laser scanning, converge to revolutionize road竣工 acceptance surveying while simultaneously providing robust, dynamic data streams for digital twin city construction, intelligent transportation systems, and—crucially—the proactive supervision of natural resources. The central premise is that data acquired through modern surveying for one purpose, such as road竣工, forms a critical, high-precision foundation for a multitude of other urban and environmental management applications.
Traditionally, road竣工 acceptance surveying relied on terrestrial methods using total stations and GNSS rovers. While accurate, these methods are point-based, time-consuming, and often disruptive to the newly opened traffic flow. They provide a sparse dataset that, while sufficient for checking against design plans for basic dimensional compliance, lacks the richness required for modern digital management systems. The emergence of mobile mapping systems (MMS), terrestrial laser scanning (TLS), and especially UAV-based platforms has overcome these limitations. UAV drones, equipped with high-resolution oblique cameras, LiDAR sensors, or both, enable the rapid, non-invasive, and comprehensive capture of as-built conditions. They deliver not just coordinates, but dense point clouds, true orthophotos, textured 3D models, and panoramic imagery. This multi-faceted data output meets and exceeds traditional竣工 requirements by offering millimeter-to-centimeter level accuracy for feature extraction, and it does so with unprecedented efficiency. The formula for data yield per unit time is transformative:
$$ \text{Data Yield} = \frac{(\text{Point Density} \times \text{Area Covered}) + (\text{Image Resolution} \times \text{Number of Images})}{\text{Survey Time}} $$
where the parameters for a UAV drone survey (high density, large area, very low time) result in an order-of-magnitude increase in yield compared to traditional methods.
The Contemporary Road竣工 Survey Workflow Enabled by UAV Drones
The technical process for conducting a竣工 survey using a UAV drone is systematic and highly efficient. It can be broadly divided into three phases: Planning & Acquisition, Processing & Modeling, and Analysis & Delivery. The following table summarizes the key activities and outputs at each stage.
| Phase | Key Activities | Technology/Tools | Primary Outputs |
|---|---|---|---|
| 1. Planning & Acquisition | Flight planning, GNSS ground control point (GCP) survey, safety checks, automated data capture. | Flight planning software (e.g., UgCS, DJI Pilot 2), RTK/PPK-enabled UAV drones, RGB and multispectral cameras. | Geotagged oblique/aerial imagery, LiDAR point cloud (raw), GNSS trajectory data. |
| 2. Processing & Modeling | Data download, initial quality check, photogrammetric processing or point cloud registration, geometric refinement. | Software suites (e.g., Pix4Dmapper, ContextCapture, TerraSolid), cloud processing platforms. | Dense 3D point cloud, Digital Surface Model (DSM), True Orthophoto, Textured 3D Mesh Model. |
| 3. Analysis & Delivery | Automated feature extraction, cross-section generation, volumetric analysis, compliance checking against CAD models. | CAD software (AutoCAD, MicroStation), GIS platforms (ArcGIS, QGIS), specialized extraction tools. | As-built drawings, deviation reports, quantities (e.g., asphalt volume), GIS-ready feature layers. |
The photogrammetric processing core relies on solving the collinearity equations for thousands of images simultaneously through Structure from Motion (SfM) and bundle adjustment. The fundamental equation for a point i projected onto image j is:
$$ \begin{bmatrix} x_{ij} – x_p \\ y_{ij} – y_p \end{bmatrix} = \lambda \cdot \mathbf{R}_j \begin{bmatrix} X_i – X_{0j} \\ Y_i – Y_{0j} \\ Z_i – Z_{0j} \end{bmatrix} $$
where $(x_{ij}, y_{ij})$ are the image coordinates, $(x_p, y_p)$ are the principal point offsets, $\lambda$ is a scale factor, $\mathbf{R}_j$ is the rotation matrix for image j, $(X_i, Y_i, Z_i)$ are the object space coordinates of point i, and $(X_{0j}, Y_{0j}, Z_{0j})$ are the coordinates of the perspective center for image j. Modern software solves for all unknown parameters (camera poses, point locations, lens distortion) iteratively, resulting in a highly accurate sparse point cloud, which is then densified.
For验收, specific road elements are extracted from the resulting models. The accuracy of extracted features, such as the edge of pavement or the position of a manhole cover, is paramount. The overall accuracy can be expressed as a function of Ground Sampling Distance (GSD) and the quality of the georeferencing:
$$ \sigma_{\text{total}} = \sqrt{ \sigma_{\text{GSD}}^2 + \sigma_{\text{georef}}^2 } $$
where $\sigma_{\text{GSD}} \approx \text{GSD} \times 1-3$ pixels (depending on feature contrast) and $\sigma_{\text{georef}}$ is the error from the GCP network and camera calibration. With RTK/PPK-enabled UAV drones and a minimal GCP set for validation, $\sigma_{\text{total}}$ routinely achieves 1-3 cm horizontally and 2-5 cm vertically, fully satisfying and often surpassing the accuracy requirements for large-scale竣工 surveys.
From竣工 Data to Digital Foundations: Enabling the Digital Twin and Smart City
The true value of these high-fidelity竣工 datasets extends far beyond the immediate acceptance certificate. The rich, spatially accurate, and visually detailed outputs form the foundational data layer for Digital Twin City construction and Intelligent Transportation Systems (ITS). A digital twin is a virtual, dynamic replica of physical assets, processes, or systems. For a road corridor, the竣工 deliverables provide the essential “as-is” geometric and visual baseline.
The textured 3D mesh model, for instance, is directly ingestible into gaming engines (Unity, Unreal) or specialized digital twin platforms (Bentley iTwin, Esri ArcGIS Urban) to create immersive, navigable environments. The dense point cloud can be classified to separate road surfaces, curbs, signage, lighting poles, and vegetation. This classified data feeds asset management databases, enabling:
- Precise Asset Inventories: Automatic detection and geolocation of every streetlight, traffic sign, and drain.
- Deformation Monitoring: By comparing point clouds from different epochs, subsidence, pavement rutting, or structural movement can be detected algorithmically. The change detection formula is straightforward: $\Delta Z = Z_{\text{epoch2}} – Z_{\text{epoch1}}$ applied across the entire surface.
- Simulation and Planning: The accurate 3D model serves as the testbed for simulating traffic flow, pedestrian movement, flood water drainage, or the visual impact of new constructions.
- Maintenance Prioritization: GIS integration allows managers to link asset conditions (extracted from the visual data) to their geographic location, optimizing repair schedules and budgets.
The panoramic imagery captured by mobile mapping systems (often integrated with or complementary to UAV drone surveys) provides street-level, immersive views that are invaluable for public engagement, virtual inspections, and documenting the visual state of infrastructure at a given time.
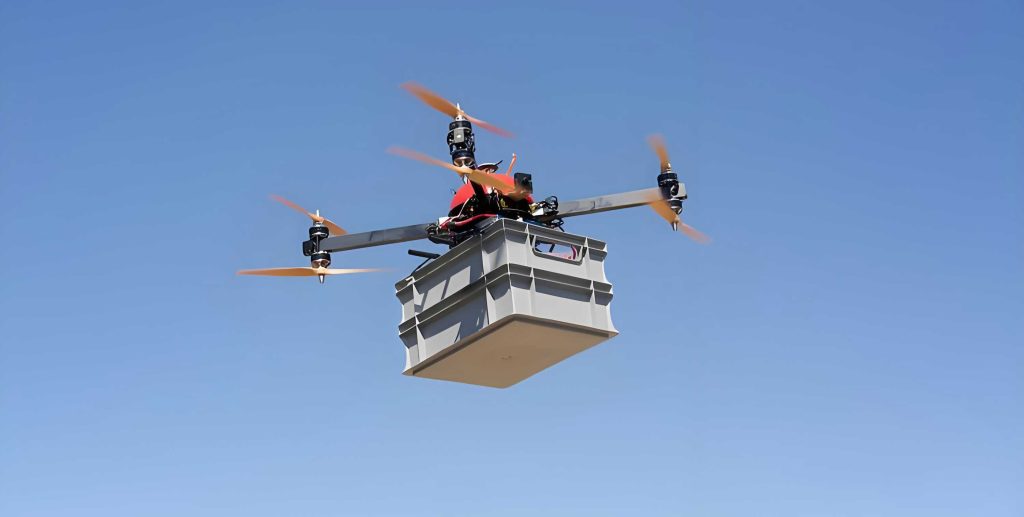
The integration of multi-sensor payloads on UAV drones—from high-resolution cameras for orthophotos to LiDAR for penetrating vegetation—is what makes them such versatile tools for both detailed竣工 surveys and broad-scale environmental monitoring.
UAV Drones as the Vanguard for Natural Resources Supervision
The same technological stack that delivers precision for road竣工—primarily UAV oblique photogrammetry—is equally transformative for the supervision of natural resources. Traditional monitoring methods, such as manual field patrols or periodic satellite imagery, suffer from poor temporal resolution, high cost, or limited detail. UAV drones bridge this gap by providing on-demand, high-resolution, and flexible monitoring capabilities. My application of this technology for resources supervision follows a refined, four-stage cycle.
| Stage | Objective | Process & Metrics |
|---|---|---|
| A. Baseline & Periodic Acquisition | Establish a reference state and detect changes over time. | Fly systematic grids over area of interest (AOI) at defined intervals (e.g., monthly, quarterly). Key metric: Temporal Baseline $\Delta T$. Data products: Orthomosaic (DOM) and DSM for each epoch. |
| B. Automated Change Detection | Identify anomalies and potential violations with minimal manual effort. | Perform pixel-based or object-based comparison between epoch DOMs/DSMs. Formula for normalized difference: $ND_{\text{change}} = \frac{\text{Band}_{\text{epoch N}} – \text{Band}_{\text{epoch N-1}}}{\text{Band}_{\text{epoch N}} + \text{Band}_{\text{epoch N-1}}}$. Output: Preliminary Change Polygon Layer. |
| C. Expert Verification & Analysis | Confirm changes, classify type, and assess severity/compliance. | Analyst reviews change polygons overlaid on high-res imagery and 3D model. Uses measure tools in GIS to quantify area, volume. Classification against legal boundaries (e.g., mining permits, forest protection zones). |
| D. Enforcement & Reporting | Provide actionable intelligence and legal evidence. | Generate reports with geotagged images, volume calculations, and timeline visuals. Export data for regulatory platforms. Metric: Report Generation Time. |
The volumetric calculation for illegal mining or earthwork is a critical quantitative output. Using the DSMs from two epochs, the volume of material extracted or added can be computed by creating a Difference of Digital Surface Models (DoD) grid:
$$ V = \sum_{i=1}^{n} \Delta h_i \cdot A_{\text{cell}} $$
where $\Delta h_i$ is the height difference (${DSM}_{\text{later}} – {DSM}_{\text{earlier}}$) at cell i, and $A_{\text{cell}}$ is the area of one grid cell. Negative sums indicate excavation (e.g., illegal mining), while positive sums indicate dumping or construction.
Specific Application Domains
1. Land Use and Illegal Occupation Monitoring: By comparing current orthomosaics against approved land use plans or historical images, new structures, land clearing, or agricultural encroachment into protected areas can be instantly spotted. The 3D model provides context on the scale and nature of the construction.
2. Mining Activity Supervision: This is a prime application. UAV drones regularly map mining concessions to monitor adherence to approved pit boundaries, calculate extracted volumes for royalty verification, and inspect the stability of slopes and the progress of mandated rehabilitation efforts. The ability to create detailed topographic maps of complex pit geometries is a key advantage.
3. Forestry and Deforestation Control: Multispectral sensors on UAV drones can calculate vegetation indices like NDVI (Normalized Difference Vegetation Index, $NDVI = \frac{NIR – Red}{NIR + Red}$). Sharp declines in NDVI over a specific area between flights signal potential illegal logging or forest health issues. The 3D model can even be used to estimate tree height and canopy cover loss.
4. Water Body and Coastal Monitoring: Erosion of riverbanks or coastlines, unauthorized dredging, pollution plumes, and changes in water extent can all be monitored with high temporal frequency, providing early warnings for environmental threats.
Synergy and Fusion of Technologies
The future lies not in using one technology in isolation, but in the intelligent fusion of multiple data sources. A UAV drone survey provides excellent detail over a moderate area. For corridor projects like roads or rivers, coupling UAV data with Mobile Laser Scanning (MLS) from vehicles ensures seamless, high-precision data from the road surface itself (via MLS) to the surrounding terrain and structures (via UAV). This “air-ground integrated” mapping is becoming a best practice. Furthermore, the macroscopic, wide-area detection capability of satellite imagery can be used to identify regions of potential change, which are then targeted for high-detail inspection by UAV drones. This two-tiered approach optimizes resources and coverage.
The data management challenge is significant. The volume of data produced by recurring UAV drone surveys—for both竣工 and resource supervision—is massive. Effective implementation requires robust geospatial data infrastructures (GDI), cloud storage, and processing pipelines that can handle automated orthomosaic generation, change detection algorithms, and web-based delivery of results to stakeholders. The formula for total data storage needs highlights this challenge:
$$ \text{Storage}_{\text{total}} = \sum_{i=1}^{n_{\text{projects}}} (\text{Area}_i \times \text{Point Density}_i \times \text{Byte per Point} + \text{Image Count}_i \times \text{Avg. Image Size}) \times n_{\text{epochs}} $$
Conclusion
From my vantage point, the integration of测绘新技术, with UAV drones at the forefront, represents a paradigm shift. In road竣工 acceptance surveying, it delivers unparalleled completeness, accuracy, and efficiency, moving beyond simple compliance checking to create a rich, digital asset. This very dataset is the critical feedstock for the digital twins and smart traffic systems that will define future urban management. Simultaneously, the agility, resolution, and repeatability of UAV drones make them perhaps the most powerful tool available for the proactive, precise, and cost-effective supervision of our natural resources. They turn reactive enforcement into proactive stewardship. The ongoing research and development should focus not just on improving the sensors and platforms, but on unlocking the full value chain of the data they produce—through advanced AI/ML analytics, seamless integration with BIM/GIS, and the development of standardized, automated processing workflows that turn raw imagery and point clouds into actionable intelligence for sustainable infrastructure and environmental management.