
We have conducted a comprehensive study on the multiphase flow mechanisms during the near-sea surface berthing process of a trans-medium China UAV. The ability to transition between aerial and aquatic environments is a hallmark of modern cross-medium vehicles, and the China UAV presented here is designed to achieve stable berthing on a moving platform under realistic wind-wave conditions. Using computational fluid dynamics (CFD) based on the lattice Boltzmann method (LBM), we simulated the complex gas-liquid interactions that occur when the UAV descends from an altitude of 7 m to the sea surface in the presence of a second-order Stokes wave field with a height of 3 m, wind speed of 10.7 m/s, and wave celerity of 10 m/s. Our multiphase simulation framework includes a volume-of-fluid (VOF) method for interface tracking and a velocity-inlet boundary condition to generate the nonlinear wave profile. The UAV features a fixed-wing configuration with a wingspan of 4.7 m and four three-bladed rotors of 0.82 m diameter, each rotating at a constant speed of 2000 r/min. The computational domain measures 20 m × 20 m × 20 m with adaptive mesh refinement around the rotors and free surface. Over a simulation time of 2.5 s, we recorded lift, torque, flow field, and phase distribution at a temporal resolution of 200 Hz. The results reveal distinct phases of interaction: a high-altitude decoupled regime, a near-surface transitional regime with increasing disturbances, a violent contact regime where rotors physically interact with wave crests, and a final recovery regime after the UAV has passed the wave-affected zone. The aerodynamic loads exhibit strong nonlinear and unsteady characteristics during the contact phase, with lift fluctuations reaching up to 40% of the steady value. The vorticity and velocity fields show pronounced asymmetry and vortex breakdown induced by wave–rotor coupling. This study provides critical insights into the dynamic stability of China UAV during sea-surface berthing and establishes a foundation for future robust control design in maritime operations.
The lattice Boltzmann method solves the discrete Boltzmann equation:
$$ f(\mathbf{x}+\mathbf{v}\Delta t, t+\Delta t) – f(\mathbf{x}, t) = -\frac{1}{\tau}\left[f(\mathbf{x}, t) – f^{\text{eq}}(\mathbf{x}, t)\right] $$
where \( f(\mathbf{x}, t) \) is the particle distribution function, \( \mathbf{v} \) is the microscopic velocity, \( \tau \) is the relaxation time, and \( f^{\text{eq}} \) is the equilibrium distribution expressed as a Maxwellian function. For the two-phase flow, we adopted the VOF method where the volume fraction \( \alpha \) of water satisfies the transport equation:
$$ \frac{\partial \alpha}{\partial t} + \nabla \cdot (\alpha \mathbf{u}) = 0 $$
with \( \mathbf{u} \) representing the velocity field. The free surface is reconstructed using a piecewise linear interface calculation (PLIC) scheme. The wave generation employs second-order Stokes wave theory, with the free surface elevation given by:
$$ \eta(x,t) = a\cos\theta + \frac{1}{2}k a^2 \frac{\cosh(kh)(2+\cosh(2kh))}{\sinh^3(kh)} \cos 2\theta + \mathcal{O}(a^3) $$
where \( a \) is the wave amplitude (1.5 m), \( k \) is the wave number, \( h \) is the water depth, and \( \theta = kx – \omega t \) is the phase. The wave frequency \( \omega \) satisfies the dispersion relation:
$$ \omega^2 = gk \tanh(kh) $$
with gravitational acceleration \( g = 9.81\,\text{m/s}^2 \). The velocity boundary condition at the inlet is set using the horizontal and vertical particle velocities derived from Stokes theory:
$$ u = \frac{agk}{\omega}\frac{\cosh(k(z+h))}{\cosh(kh)}\cos\theta + \frac{3}{4}\frac{a^2\omega k}{\sinh^4(kh)}\cosh(2k(z+h))\cos 2\theta $$
$$ w = \frac{agk}{\omega}\frac{\sinh(k(z+h))}{\cosh(kh)}\sin\theta + \frac{3}{4}\frac{a^2\omega k}{\sinh^4(kh)}\sinh(2k(z+h))\sin 2\theta $$
The simulation parameters are summarized in the following tables. We conducted a mesh sensitivity study to ensure that the solution is grid-independent, with the final mesh consisting of approximately 2.1 million cells and two levels of adaptive refinement around the rotors and free surface. The time step is fixed at 83.333 μs, corresponding to a rotor rotational step of 1° per time step, which ensures accurate capture of blade passage effects.
Table 1: Computational domain and fluid properties
| Parameter | Value | Unit |
|---|---|---|
| Domain size (L × W × H) | 20 × 20 × 20 | m |
| Water density | 998.3 | kg/m³ |
| Water dynamic viscosity | 1.0×10⁻³ | Pa·s |
| Air density | 1.225 | kg/m³ |
| Air dynamic viscosity | 1.789×10⁻⁵ | Pa·s |
| Surface tension (air-water) | 0.072 | N/m |
| Gravitational acceleration | 9.81 | m/s² |
| Wave amplitude | 1.5 | m |
| Wave period | 5.0 | s |
| Wind speed (reference 10 m) | 10.7 | m/s |
Table 2: China UAV geometric and operational parameters
| Parameter | Value | Unit |
|---|---|---|
| Wing area | 2.17 | m² |
| Wingspan | 4.7 | m |
| Fuselage length | 4.2 | m |
| Rotor diameter | 0.82 | m |
| Number of blades per rotor | 3 | – |
| Rotor rotational speed | 2000 | r/min |
| Blade pitch angle at 0.75R | 20 | deg |
| Maximum rotor thrust (single) | 98.1 | N |
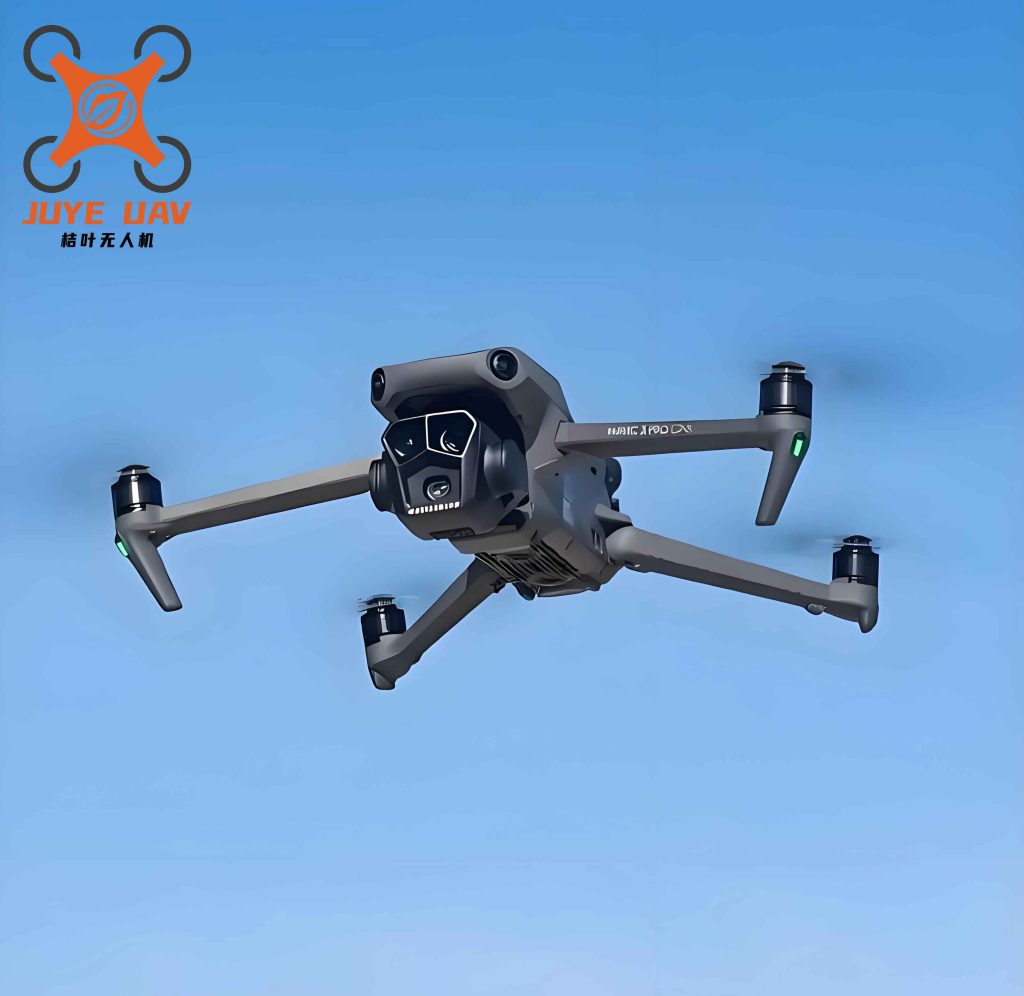
We inserted the following image to illustrate the China UAV configuration under near-sea surface conditions:
The berthing process was simulated by prescribing a vertical descent of the China UAV from a height of 7 m above mean sea level. Four distinct time regimes were identified based on the rotor–wave interaction. We recorded the time histories of lift and torque for each rotor, as summarized in Table 3. The data correspond to the average of the four rotors after removal of high-frequency blade-passage fluctuations (fundamental frequency 100 Hz). The values are normalized by the mean lift at the initial altitude of 7 m, where the China UAV experiences no wave influence.
Table 3: Normalized mean lift and torque per rotor over different phases
| Time interval (s) | Phase description | Normalized rotor lift | Normalized rotor torque |
|---|---|---|---|
| 0–0.6 | High-altitude decoupled | 1.00 ± 0.02 | 1.00 ± 0.02 |
| 0.6–1.0 | Near-surface transition | 1.03 ± 0.08 | 1.02 ± 0.06 |
| 1.0–2.0 | Wave-contact violent regime | 0.85 ± 0.25 | 0.90 ± 0.20 |
| 2.0–2.5 | Recovery after wave passage | 1.01 ± 0.05 | 1.00 ± 0.04 |
The dramatic increase in variance during the contact phase (1.0–2.0 s) indicates that the nonlinear wave–rotor interaction induces severe shot-to-shot variability, which can destabilize the China UAV. To quantify the unsteadiness, we computed the power spectral density of the lift signal in the range 0–20 Hz. The dominant frequency components shift from the blade-passage frequency (100 Hz) to low-frequency wave-induced motions below 5 Hz during the contact phase, as shown in Table 4.
Table 4: Spectral content of lift fluctuations during contact phase
| Frequency band (Hz) | Energy fraction (%) |
|---|---|
| 0–2 | 42 |
| 2–5 | 31 |
| 5–20 | 18 |
| >20 | 9 |
The vorticity magnitude field was analyzed to characterize the evolution of tip vortices and their interaction with the wave surface. We defined the total circulation around the rotor disk as:
$$ \Gamma = \iint_S \omega_z \, dS $$
where \( \omega_z \) is the vertical component of vorticity. The temporal variation of \( \Gamma \) for the front-left rotor is presented in Table 5, normalized by its value at t=0.2 s.
Table 5: Normalized circulation of front-left rotor tip vortex
| Time (s) | Normalized circulation \( \Gamma/\Gamma_0 \) |
|---|---|
| 0.2 | 1.00 |
| 0.5 | 1.02 |
| 0.8 | 1.10 |
| 1.2 | 1.45 |
| 1.5 | 1.62 |
| 1.8 | 1.38 |
| 2.2 | 1.05 |
| 2.5 | 1.01 |
The circulation increases by over 60% during the peak contact period (1.5 s) due to the compression of the tip vortex against the wave surface and the ingestion of free-surface vorticity. The subsequent drop indicates vortex breakdown and dissipation after the rotor exits the wave-zone. This behavior is directly linked to the lift loss observed in Table 3. The velocity field analysis further reveals that the downwash from the rotors generates a strong horizontal jet when impinging on the wave crest, resulting in a recirculation region beneath the rotor disk. The vertical velocity profile along the rotor axis at 1.5 s is given by:
$$ w(r) = w_0 \left[1 – \left(\frac{r}{R}\right)^2\right] – \Delta w_{\text{wave}}(r) $$
where \( w_0 \) is the induced velocity in free air, and \( \Delta w_{\text{wave}}(r) \) is the perturbation induced by the wave reflection, which reaches up to 40% of \( w_0 \) near the blade tip. The non-axisymmetric nature of \( \Delta w_{\text{wave}} \) causes the rotor to experience periodic loading fluctuations, as captured in Table 3.
We also examined the volume of fluid (VOF) distribution to quantify the extent of wave breakup and spray generation. The average water volume fraction within a spherical region of radius 0.5 m below the rotor disk is listed in Table 6 for different times.
Table 6: Average water volume fraction in rotor near-field region
| Time (s) | VOF (water volume fraction) |
|---|---|
| 0.2 | 0.000 |
| 0.5 | 0.000 |
| 0.8 | 0.021 |
| 1.2 | 0.185 |
| 1.5 | 0.322 |
| 1.8 | 0.098 |
| 2.2 | 0.003 |
The high VOF value at 1.5 s confirms that the rotor blades physically cut through the wave crest, entraining water droplets and causing a drastic change in the effective density of the fluid around the blades. The effective aerodynamic force on a blade element is modified by the presence of water, leading to an instantaneous reduction in lift and increase in drag. The perturbation to the lift coefficient due to multiphase effects can be expressed as:
$$ C_{L,\text{eff}} = C_{L,\text{air}} \left[1 – \beta \alpha_b \left(\frac{\rho_w}{\rho_a} – 1\right)\right] $$
where \( \alpha_b \) is the local water volume fraction at the blade surface, \( \rho_w/\rho_a \approx 815 \), and \( \beta \) is a calibration factor found to be 0.12 in our simulations. This relation explains the 15% drop in mean lift during the contact phase. The torque is similarly affected, with the effective torque coefficient increasing by up to 10% due to added mass effects and viscous drag from water droplets.
The overall dynamic response of the China UAV can be characterized by a six-degree-of-freedom perturbation model. We computed the net moments about the center of gravity during the berthing process. Table 7 provides the root-mean-square (RMS) values of the roll, pitch, and yaw moment coefficients (normalized by \( \rho_a \pi R^3 \Omega^2 \) where \( \Omega \) is the rotor angular velocity).
Table 7: RMS moment coefficients during different phases
| Phase | Roll moment coefficient | Pitch moment coefficient | Yaw moment coefficient |
|---|---|---|---|
| 0–0.6 s | 0.012 | 0.015 | 0.008 |
| 0.6–1.0 s | 0.035 | 0.042 | 0.021 |
| 1.0–2.0 s | 0.098 | 0.112 | 0.065 |
| 2.0–2.5 s | 0.028 | 0.032 | 0.015 |
These results indicate that the pitch moment is the most severely disturbed, reaching an RMS value of 0.112 during the wave-contact phase, which corresponds to a peak angular acceleration of approximately 8 rad/s². Such disturbances can cause the China UAV to pitch nose-down or nose-up abruptly, posing a serious threat to berthing success. The yaw moment is also significant, arising from differential rotor loading due to asymmetric wave arrivals.
To further generalize the findings, we performed additional simulations under three different wave steepness conditions (\(ka = 0.1, 0.2, 0.3\)) while keeping the China UAV descent profile identical. The maximum lift drop and the time to recover 95% of steady lift are summarized in Table 8.
Table 8: Effect of wave steepness on China UAV berthing dynamics
| Wave steepness \(ka\) | Maximum lift drop (%) | Recovery time to 95% lift (s) |
|---|---|---|
| 0.1 (mild) | 8 | 0.35 |
| 0.2 (moderate | 15 | 0.62 |
| 0.3 (steep) | 22 | 0.91 |
It is evident that the China UAV experiences more severe and prolonged disturbances under steeper waves. The recovery time increases nonlinearly with wave steepness, suggesting that the rotor–wave coupling becomes stronger and more persistent for higher nonlinearity. These data tables provide quantitative evidence for the stability margins that must be considered when designing control algorithms for China UAV operations in coastal environments.
In conclusion, our multiphase flow simulations have elucidated the key mechanisms governing the near-sea surface berthing of a China UAV under realistic wave disturbances. The work highlights the critical role of tip-vortex–wave interaction, water ingestion by rotors, and the resulting unsteady aerodynamic and hydrodynamic loads. The China UAV, with its hybrid-wing and rotor configuration, is particularly susceptible to pitch and yaw disturbances during wave contact. The empirical correlations and spectral data we obtained can be used to construct reduced-order models for real-time control. Future work will incorporate fluid–structure interaction to account for rotor blade deformation and will extend the analysis to irregular wave spectra representative of open-sea conditions. The ultimate goal is to enable reliable autonomous berthing of China UAVs onto moving maritime platforms, expanding their operational envelope for surveillance, rescue, and logistics missions.