
High-precision topographic data is fundamental to disaster early warning, emergency response, and post-disaster reconstruction decision-making, directly affecting the safety of life and property and the efficient allocation of disaster prevention and reduction resources. As a core technology in modern surveying, photogrammetry based on China UAV drone platforms has become one of the mainstream approaches for disaster prevention topographic mapping due to its high efficiency, flexibility, and low cost. It is widely used in the analysis of natural disasters such as landslides, debris flows, and earthquakes. Previous studies have focused on single-factor analysis, but in practical engineering applications, mapping accuracy is often influenced by the combined effects of multiple factors including terrain characteristics, flight parameters, control point layout, and data processing methods. However, the comprehensive interaction mechanism of these factors and their impact on accuracy, especially across different terrains, remains insufficiently explored.
In recent years, numerous domestic and international studies have been conducted on the influencing factors of China UAV drone mapping accuracy. Regarding control points, the number and arrangement of ground control points directly affect the stability and accuracy of aerial triangulation solutions. For flight parameters, flight altitude is negatively correlated with image resolution; appropriately reducing altitude can improve feature recognition and positioning accuracy. Image overlap rate influences matching redundancy and model completeness; higher overlap rates contribute to stronger tie-point strength and geometric rigidity. The introduction of Real-Time Kinematic (RTK) technology provides high-precision POS data, thereby reducing dependence on ground control points and improving absolute positioning accuracy. Compared with traditional vertical photography, oblique photography captures richer facade information of ground objects, demonstrating higher model fidelity in complex terrain and urban areas. However, existing studies are mostly limited to single factors or single terrain types, lacking systematic comparisons and summaries of multi-factor, multi-terrain comprehensive effects. For instance, whether the response degree of different terrains to the same factor is significantly different, and whether interactive effects exist among factors, remain unclear.
To address these gaps, this study selects three typical terrains—flatland, strip areas, and mountainous regions—as research objects. Through designed controlled experiments, we systematically analyze the mechanisms by which control point quantity, flight altitude, overlap rate, RTK module status, and aerial photography mode influence the accuracy of China UAV drone topographic mapping. Furthermore, we propose optimized recommendations for different terrains to provide scientific guidance for practical engineering applications.
1. Principle and Advantages of China UAV Drone Photogrammetry
China UAV drone photogrammetry is the integration of traditional aerial photogrammetry with modern drone platforms, high-precision positioning, multi-view imaging, and intelligent data processing. This technology uses drones equipped with optical sensors to collect surface data efficiently and flexibly, and then through a series of photogrammetric processing, generates various products such as Digital Orthophoto Map (DOM), Digital Surface Model (DSM), Digital Elevation Model (DEM), and 3D real-scene models.
1.1 Main Technical Types
Based on sensor type and imaging mode, China UAV drone photogrammetry can be classified into the following two categories.
1.1.1 Vertical Photogrammetry
In vertical photogrammetry, the principal axis of the sensor is approximately perpendicular to the ground. The acquired aerial images are suitable for large-scale topographic mapping and orthophoto production. This method has relatively simple data processing and high mapping efficiency, but it has insufficient coverage of building facades and steep terrains.
1.1.2 Oblique Photogrammetry
Oblique photogrammetry uses multi-lens cameras to simultaneously capture vertical and oblique images, enabling multi-view collection of ground object facades and complex terrain. This technology can realistically restore the three-dimensional morphology of objects and is widely used in urban modeling, engineering monitoring, and other fields.
1.2 Application Scope
Currently, China UAV drone topographic mapping technology is widely applied in topographic map updating, mine monitoring, engineering surveys, land use surveys, disaster assessment, and smart city construction, making it one of the important means for acquiring modern surveying and geographic information.
2. Experimental Area and Scheme
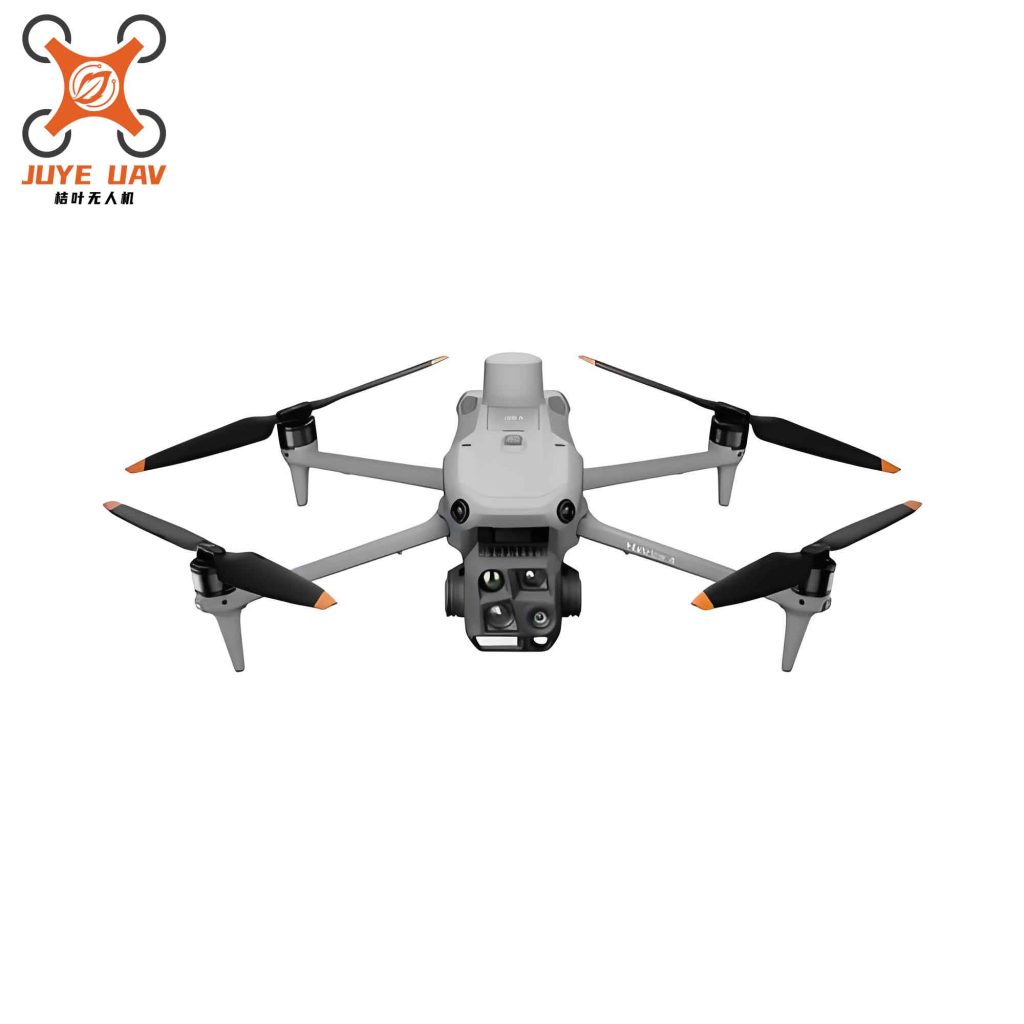
Following the principles of “terrain coverage typicality, variable control comparability, and experimental process reproducibility,” three typical terrains—flatland, strip areas, and mountainous regions—were selected as experimental zones. Controlled experiments were designed around key factors: control point number, flight altitude, forward and side overlap rates, RTK module status, and aerial photography mode. The experiments were conducted using the DJI Matrice 4E China UAV drone platform equipped with a visible light camera, and data processing was performed using Pix4D mapper software to generate DOM and DSM products. The overall technical workflow follows the systematic process of “experimental design → data acquisition → data processing → accuracy evaluation → result analysis,” aiming to clarify the influence mechanism of each factor on mapping accuracy across different terrains through multiple sets of controlled experiments.
2.1 Overview of Experimental Areas
Three types of terrains were selected:
- Flatland area: A residential area containing building groups and road networks, with flat terrain and uniform feature distribution.
- Strip area: A ring road with obvious linear extension characteristics, relatively small terrain undulations, but continuous curves and elevation changes.
- Mountainous area: A mountainous area including steep slopes and mining landforms, with complex terrain and significant elevation differences.
2.2 Aerial Photography Schemes
As shown in Table 1, this study used the DJI Matrice 4E China UAV drone to design 12 groups of aerial photography schemes for the three experimental areas. Pix4D mapper software was used for aerial triangulation and product generation. The core technology employed a combination of feature point matching and region matching strategies for keypoint matching, combined with bundle adjustment for global optimization of matching results, ensuring the accuracy and efficiency of matching.
| Flight Area | Group | Control Points | Flight Altitude (m) | Forward/Side Overlap (%) | RTK Status | Photography Mode |
|---|---|---|---|---|---|---|
| Flatland | 1 | 30 | 100 | 80/75 | Enabled | Vertical |
| 2 | 60 | 100 | 80/75 | Enabled | Vertical | |
| 3 | 30 | 100 | 80/75 | Disabled | Vertical | |
| 4 | 30 | 80 | 80/75 | Enabled | Vertical | |
| Flatland | 5 | 30 | 100 | 80/75 | Enabled | Oblique |
| 6 | 30 | 100 | 85/80 | Enabled | Vertical | |
| 7 | 30 | 100 | 90/85 | Enabled | Vertical | |
| Strip | 8 | 30 | 100 | 80/75 | Enabled | Vertical |
| 9 | 30 | 100 | 85/80 | Enabled | Vertical | |
| 10 | 30 | 100 | 90/85 | Enabled | Vertical | |
| Mountainous | 11 | 30 | 100 | 80/75 | Enabled | Vertical |
| 12 | 30 | 80 | 80/75 | Enabled | Vertical |
2.3 Accuracy Evaluation Index
Check points measured by RTK field survey were used as true values, compared with points extracted from the generated products. For each area, 30 to 60 check points were selected. The mean square error (MSE) between the true value and the extracted value was calculated using the following formula:
$$m = \pm \sqrt{\frac{[\Delta\Delta]}{n}}$$
where m is the mean square error in a given direction, [ΔΔ] is the sum of squares of true errors, and n is the number of check points.
3. Experimental Results and Analysis
3.1 Comparative Analysis in Flatland Area
For the flatland area, the reference group (Group 1) was set with parameters: 30 control points, flight altitude 100 m, forward overlap 80%, side overlap 75%, RTK enabled, vertical photography. Results are shown in Tables 2 to 6.
3.1.1 Control Point Factor
| Error type | 60 control points error (m) | 30 control points error (m) | |
|---|---|---|---|
| Max error | x | 0.013 | 0.065 |
| y | -0.012 | -0.043 | |
| z | 0.020 | -0.075 | |
| MSE | x | 0.006 | 0.039 |
| y | 0.006 | 0.022 | |
| z | 0.008 | 0.038 |
From Table 2, increasing control points from 30 to 60 reduced MSE in x, y, z by -0.033 m, -0.016 m, -0.030 m respectively. The maximum plane error dropped from 0.065 m to 0.013 m, and maximum elevation error from 0.075 m to 0.020 m. This indicates that in the same area and under the same observation conditions, more control points lead to higher mapping accuracy for China UAV drone operations.
3.1.2 RTK Factor
| Error type | RTK enabled error (m) | RTK disabled error (m) | |
|---|---|---|---|
| Max error | x | 0.065 | 0.148 |
| y | -0.043 | -0.096 | |
| z | -0.075 | 0.131 | |
| MSE | x | 0.039 | 0.044 |
| y | 0.022 | 0.046 | |
| z | 0.038 | 0.084 |
Disabling RTK increased MSE by 0.005 m (x), 0.024 m (y), and 0.046 m (z). Maximum plane error rose from 0.065 m to 0.148 m, and maximum elevation error from 0.075 m to 0.131 m. Enabling RTK (i.e., introducing high-precision POS data for adjustment) significantly improves China UAV drone mapping accuracy.
3.1.3 Flight Altitude Factor
| Error type | Altitude 100 m error (m) | Altitude 80 m error (m) | |
|---|---|---|---|
| Max error | x | 0.065 | 0.054 |
| y | -0.043 | -0.046 | |
| z | -0.075 | 0.059 | |
| MSE | x | 0.039 | 0.028 |
| y | 0.022 | 0.020 | |
| z | 0.038 | 0.036 |
Reducing altitude from 100 m to 80 m reduced MSE by -0.011 m (x), -0.002 m (y), -0.002 m (z). Maximum plane error decreased from 0.065 m to 0.054 m, and maximum elevation error from 0.075 m to 0.059 m. The image resolution improved from 3.00 cm (100 m) to 2.41 cm (80 m). Thus, appropriate altitude reduction improves resolution and accuracy, but margins and occlusion-prone areas still exhibit larger errors.
3.1.4 Overlap Rate Factor
| Error type | Overlap 80/75 error (m) | Overlap 85/80 error (m) | Overlap 90/85 error (m) | |
|---|---|---|---|---|
| Max error | x | 0.065 | 0.048 | 0.043 |
| y | -0.043 | -0.036 | -0.029 | |
| z | -0.075 | 0.049 | 0.047 | |
| MSE | x | 0.039 | 0.029 | 0.025 |
| y | 0.022 | 0.022 | 0.021 | |
| z | 0.038 | 0.034 | 0.027 |
Higher overlap rates reduced MSE. Compared to 80/75, the 85/80 overlap reduced MSE by -0.010 m (x), 0 (y), -0.004 m (z); 90/85 reduced by -0.014 m (x), -0.001 m (y), -0.011 m (z). Maximum plane error dropped to 0.048 m (85/80) and 0.043 m (90/85); elevation to 0.049 m and 0.047 m. Higher overlap improves matching robustness and China UAV drone mapping accuracy.
3.1.5 Aerial Photography Mode Factor
| Error type | Vertical error (m) | Oblique error (m) | |
|---|---|---|---|
| Max error | x | 0.065 | 0.037 |
| y | -0.043 | -0.031 | |
| z | -0.075 | 0.036 | |
| MSE | x | 0.039 | 0.021 |
| y | 0.022 | 0.017 | |
| z | 0.038 | 0.019 |
Oblique photography reduced MSE by -0.018 m (x), -0.005 m (y), -0.019 m (z) compared to vertical photography. Maximum plane error decreased from 0.065 m to 0.037 m; elevation from 0.075 m to 0.036 m. Oblique mode provides richer multi-view data, thus improving China UAV drone mapping accuracy.
3.2 Comparative Analysis of Overlap Rate in Strip Area
For the strip area, the reference group (Group 8) used 30 control points, altitude 100 m, overlap 80/75, RTK enabled, vertical photography. Results shown in Table 7.
| Error type | Overlap 80/75 error (m) | Overlap 85/80 error (m) | Overlap 90/85 error (m) | |
|---|---|---|---|---|
| Max error | x | 0.079 | 0.070 | 0.088 |
| y | -0.040 | -0.038 | -0.059 | |
| z | 0.080 | 0.063 | 0.062 | |
| MSE | x | 0.033 | 0.025 | 0.025 |
| y | 0.028 | 0.021 | 0.025 | |
| z | 0.041 | 0.033 | 0.027 |
Higher overlap rates in strip areas also improved accuracy. MSE reductions for 85/80 were -0.008 m (x), -0.007 m (y), -0.008 m (z); for 90/85 were -0.008 m (x), -0.003 m (y), -0.014 m (z). Maximum plane error dropped from 0.079 m to 0.070 m (85/80) and 0.088 m (90/85); elevation from 0.080 m to 0.063 m and 0.062 m. Higher overlap enhances image matching stability in linear corridors for China UAV drone missions.
3.3 Comparative Analysis of Flight Altitude in Mountainous Area
For the mountainous area, the reference group (Group 11) used 30 control points, altitude 100 m, overlap 80/75, RTK enabled, vertical photography. Results shown in Table 8.
| Error type | Altitude 100 m error (m) | Altitude 80 m error (m) | |
|---|---|---|---|
| Max error | x | 0.083 | 0.053 |
| y | -0.047 | -0.037 | |
| z | 0.110 | 0.097 | |
| MSE | x | 0.042 | 0.038 |
| y | 0.031 | 0.029 | |
| z | 0.052 | 0.046 |
Reducing altitude from 100 m to 80 m in mountainous terrain reduced MSE by -0.004 m (x), -0.002 m (y), -0.006 m (z). Maximum plane error dropped from 0.083 m to 0.053 m; elevation from 0.110 m to 0.097 m. Image resolution improved from 2.49 cm to 1.99 cm. Lower altitude improves resolution and accuracy, although errors remain larger at edges, occluded areas, and steep terrain transitions for China UAV drone surveys.
3.4 Comparative Analysis Across Different Terrains
A comparison of reference groups for different terrains (all with 30 control points, altitude 100 m, overlap 80/75, RTK enabled, vertical photography) is shown in Table 9.
| Error type | Flatland error (m) | Strip area error (m) | Mountainous area error (m) | |
|---|---|---|---|---|
| Max error | x | 0.065 | 0.079 | 0.083 |
| y | -0.043 | -0.040 | -0.047 | |
| z | -0.075 | 0.080 | 0.110 | |
| MSE | x | 0.039 | 0.033 | 0.042 |
| y | 0.022 | 0.028 | 0.031 | |
| z | 0.038 | 0.041 | 0.052 |
Flatland and strip areas exhibited similar MSE values, both lower than mountainous areas. Maximum plane error was 0.065 m (flat), 0.079 m (strip), 0.083 m (mountain); maximum elevation error was 0.075 m (flat), 0.080 m (strip), 0.110 m (mountain). Under identical observation conditions, China UAV drone mapping accuracy in flatland and strip areas is close, while mountainous terrain yields lower accuracy due to complex relief and higher occlusion.
4. Conclusions and Outlook
4.1 Conclusions
Through multiple groups of controlled experiments, this study systematically analyzed the influences of control point quantity, flight altitude, overlap rate, RTK, and photography mode on the accuracy of China UAV drone topographic mapping across flatland, strip, and mountainous terrains. The main conclusions are as follows:
- Control point quantity significantly improves both plane and elevation accuracy, with the most pronounced effect in flatland areas.
- RTK module activation greatly improves absolute positioning accuracy and is a key means to enhance product reliability.
- Reducing flight altitude increases image resolution, thereby improving detail expression and model accuracy, but it reduces per-mission coverage efficiency, requiring a trade-off between accuracy and efficiency.
- Increasing overlap rates (especially side overlap) enhances image matching robustness, with more prominent improvements in strip and mountainous areas.
- Different terrains respond differently to these factors: flatland is most sensitive to control point quantity, while mountainous areas are more affected by altitude and overlap rate.
4.2 Research Limitations
This study has the following limitations that require further verification and improvement:
- The experiments were conducted using only the DJI Matrice 4E China UAV drone and Pix4D mapper software as a single platform and processing tool. The generalizability of the conclusions needs cross-validation with different devices and processing systems.
- The experimental areas covered three typical terrains but did not consider dynamic environmental factors such as lighting conditions, wind speed, and vegetation density, which may also affect mapping accuracy.
4.3 Future Outlook
To address the above limitations, future research can be expanded in the following directions:
- Multi-source data assistance: Introducing LiDAR point cloud data to assist image-based mapping, compensating for the shortcomings of pure visual photogrammetry in vegetation-covered and high-contrast areas, thereby improving mapping reliability.
- Dynamic parameter adaptive optimization: Developing a real-time terrain-analysis-based adaptive flight parameter system to dynamically adjust and optimize altitude, overlap, and other parameters.
- Enriching experimental scenarios: Adding tests under different times, weather types, and surface cover conditions to quantitatively analyze the effects of environmental variables such as light, wind speed, and vegetation density on mapping accuracy.
Through these research directions, it is expected to build a more efficient, accurate, and adaptable China UAV drone topographic mapping operational system.