
In the field of mining subsidence monitoring, traditional methods often suffer from limited data processing capabilities and poor adaptability to complex terrains. To address these challenges, we propose a novel approach that integrates unmanned aerial vehicle (UAV) photogrammetry with Light Detection and Ranging (LiDAR) technology. The China UAV platform used in this study is the DJI Air 3S quadcopter, which is equipped with a high-resolution camera and a LiDAR system. This combination allows us to simultaneously acquire high-precision three-dimensional point clouds and rich texture information of the mining area. By incorporating Global Navigation Satellite System (GNSS) dynamic measurements into the LiDAR system, we achieve real-time correction and accuracy enhancement. The core innovation lies in the registration and fusion of LiDAR point clouds and UAV imagery under a unified coordinate system, enabling comprehensive monitoring of subsidence zones.
We conducted field experiments in a typical mining area in Shanxi Province, China, where subsidence caused by intensive coal extraction is a critical concern. The study area covers approximately 2.5 km² and includes three subsidence categories: slight (<50 mm), moderate (50–200 mm), and severe (>200 mm). We deployed 15 GPS control points uniformly distributed across the subsidence basin to serve as ground truth. The monitoring results from the proposed integrated method are compared with those from standalone UAV photogrammetry and standalone LiDAR techniques. Our findings demonstrate that the integrated approach significantly improves measurement accuracy, with an average absolute error (MAE) of only 0.39 mm and a root mean square error (RMSE) of 0.42 mm, outperforming both individual methods.
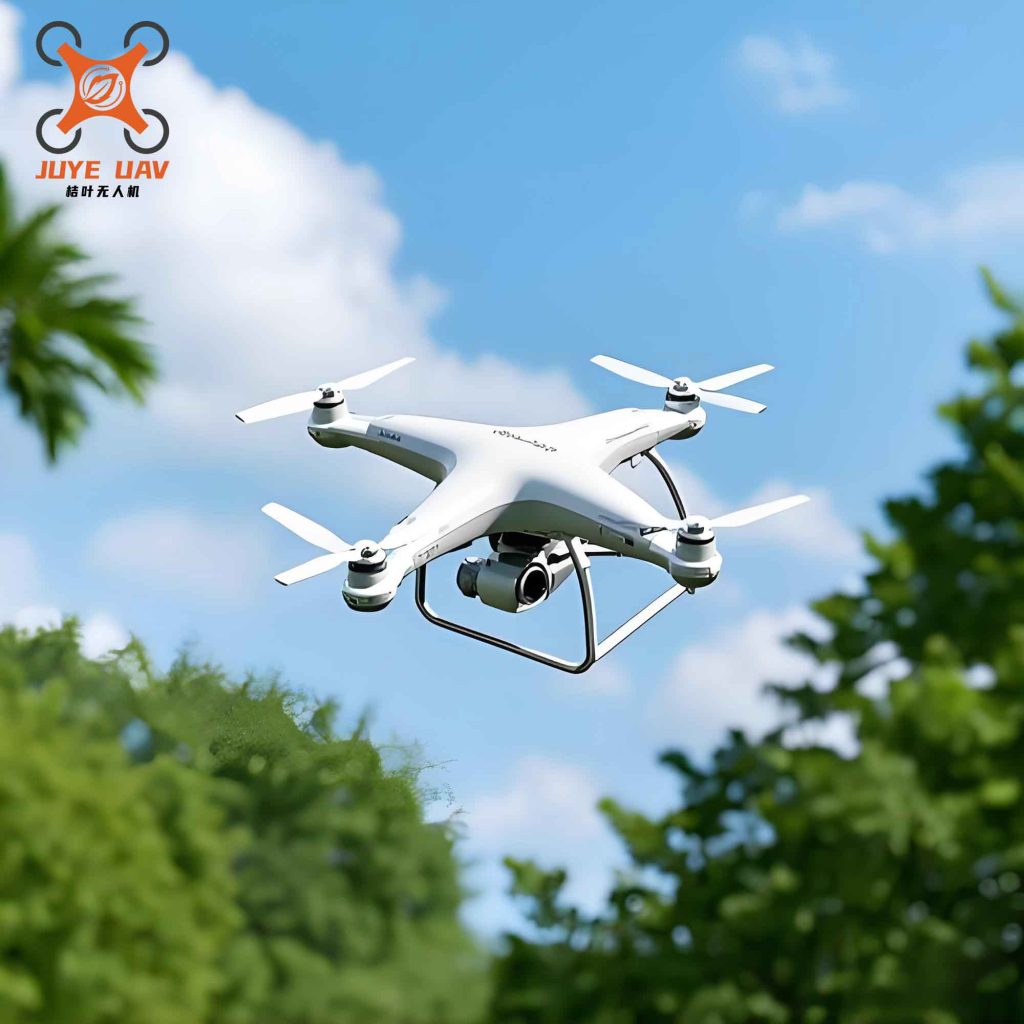
1. Methodology
1.1 UAV Photogrammetry Workflow
The UAV photogrammetry process consists of three main stages: flight planning, image acquisition, and data processing. During flight planning, we set the flying height to 255 m to achieve a ground sampling distance (GSD) of 0.04 m/pixel. The forward overlap is set to 80% and the side overlap to 60% to ensure sufficient feature correspondence between consecutive images. The China UAV is equipped with a 1-inch CMOS sensor (14-stop dynamic range, F1.8 aperture, 24 mm equivalent focal length) and a 1/1.3-inch medium-telephoto camera (14-stop dynamic range, F2.8 aperture, 70 mm equivalent focal length). The onboard GPS and inertial measurement unit (IMU) record the position and attitude of each image at the moment of exposure.
After image acquisition, we apply the Structure from Motion (SfM) algorithm to reconstruct the 3D scene. The algorithm consists of the following steps:
- Feature extraction: Detect and describe invariant keypoints (e.g., SIFT) from each image.
- Feature matching: Establish correspondences between keypoints across image pairs.
- Sparse reconstruction: Estimate camera parameters and 3D positions of matched keypoints via bundle adjustment, yielding a sparse point cloud.
- Georeferencing: Transform the sparse point cloud into a geographic coordinate system using ground control points.
- Dense reconstruction: Generate a dense point cloud through multi-view stereo matching.
- Filtering: Remove outliers and non-ground points using a progressive morphological filter to obtain a ground point cloud.
- Rasterization: Interpolate the dense point cloud to produce a Digital Surface Model (DSM) and a Digital Elevation Model (DEM). A digital orthophoto map (DOM) is generated via orthorectification.
The technical specifications of the China UAV and its cameras are summarized in Table 1.
| UAV Parameter | Value | Camera Parameter | Value |
|---|---|---|---|
| Standard takeoff weight (g) | 724 | Main camera sensor size (inches) | 1 |
| Flight endurance (min) | 45 | Medium-telephoto sensor size (inches) | 1/1.3 |
| Maximum flight range (km) | 32 | Main camera lens | F1.8, 24 mm equiv. |
| Maximum ascent speed (m/s) | 10 | Medium-telephoto lens | F2.8, 70 mm equiv. |
| Maximum horizontal speed (m/s) | 21 | Image format | JPEG, DNG |
| Satellite navigation | GPS, Galileo, BeiDou | Video format | MP4 (H.264, H.265) |
1.2 LiDAR Data Acquisition and Processing
The LiDAR system mounted on the China UAV emits laser pulses and measures the round-trip time to determine the distance to the target. The basic ranging equation is:
$$ d = \frac{1}{2} c t $$
where \(d\) is the distance (m), \(c = 3 \times 10^8\) m/s is the speed of light, and \(t\) is the time of flight (s). The LiDAR system integrates a laser scanner, a GNSS receiver, an IMU, and a central control unit. The IMU measures angular velocity and acceleration to provide the attitude angles \((\alpha, \beta, \gamma)\) of the laser beam. The GNSS receiver, combined with a base station for differential correction, yields the position \((X_S, Y_S, Z_S)\) of the scanner center. The coordinates of a ground point P are calculated as:
$$ \begin{bmatrix} X_P \\ Y_P \\ Z_P \end{bmatrix} = \begin{bmatrix} X_S \\ Y_S \\ Z_S \end{bmatrix} + \mathbf{R}(\alpha, \beta, \gamma) \cdot \begin{bmatrix} 0 \\ 0 \\ -d \end{bmatrix} $$
where \(\mathbf{R}\) is the rotation matrix derived from the attitude angles.
The data preprocessing pipeline is illustrated in the flowchart. First, flight parameters (altitude, overlap) are planned. During the flight, the LiDAR system records laser range data, IMU data, onboard GPS data, and base station data. The GPS and IMU data are processed jointly (GPS/IMU integration) to generate a smoothed trajectory with position accuracy better than 0.02 m and attitude accuracy better than 3°. The trajectory is then used to decode the point cloud from raw laser measurements. Quality checks are performed: if the point cloud exhibits layering artifacts, feature extraction and strip adjustment are applied; otherwise, the point cloud proceeds directly to colorization, coordinate transformation, and accuracy verification. The final product is a standard LAS-format point cloud.
1.3 Fusion of LiDAR Point Cloud and UAV Imagery
To achieve a comprehensive representation of the mining subsidence area, we register the LiDAR point cloud with the UAV orthophoto in a common coordinate system. The fusion process involves two main steps: feature-level registration and pixel-level fusion. First, we extract salient features (e.g., building edges, road boundaries, rock outcrops) from both the point cloud and the optical image. These features are matched using a combination of iterative closest point (ICP) registration and mutual information optimization. Once the geometric transformation is established, the RGB values from the UAV image are assigned to each LiDAR point, generating a true-color point cloud. This fused dataset preserves the high-precision geometry of LiDAR and the visual texture of UAV imagery, enabling both 3D and 2D visualization for subsidence analysis.
2. Experimental Setup
The experiment was conducted in a coal mining subsidence area in Shanxi Province, China. The terrain is characterized by gentle hills and slopes. The subsidence basin covers approximately 2.5 km², with maximum vertical deformation exceeding 200 mm. We deployed 15 GPS control points (P1 to P15) using static GPS measurements with an accuracy of ±2 mm. These points serve as the reference for evaluating the performance of three monitoring methods: (a) standalone UAV photogrammetry, (b) standalone LiDAR, and (c) the proposed integrated method. For each method, we compared the measured vertical coordinates with the static GPS values. The errors are defined as the difference between the method’s value and the GPS value (true value).
3. Results and Analysis
Table 2 presents the monitoring results for all 15 control points. For each method, we list the measured coordinate (mm) and the corresponding error (mm).
| Control point | Static GPS (true) | UAV Photogrammetry | LiDAR | Proposed method | Error (UAV) | Error (LiDAR) | Error (Proposed) |
|---|---|---|---|---|---|---|---|
| P1 | 987.65 | 981.32 | 993.87 | 988.12 | -6.33 | 6.22 | 0.47 |
| P2 | 1056.23 | 1048.76 | 1062.54 | 1055.89 | -7.47 | 6.31 | -0.34 |
| P3 | 876.91 | 870.55 | 883.12 | 877.23 | -6.36 | 6.21 | 0.32 |
| P4 | 1123.54 | 1115.98 | 1129.76 | 1123.18 | -7.56 | 6.22 | -0.36 |
| P5 | 765.32 | 758.11 | 771.98 | 765.78 | -7.21 | 6.66 | 0.46 |
| P6 | 1201.87 | 1194.22 | 1208.34 | 1201.53 | -7.65 | 6.47 | -0.34 |
| P7 | 923.45 | 916.78 | 929.65 | 923.89 | -6.67 | 6.20 | 0.44 |
| P8 | 845.67 | 838.90 | 851.89 | 845.21 | -6.77 | 6.22 | -0.46 |
| P9 | 1087.32 | 1080.12 | 1093.56 | 1086.98 | -7.20 | 6.24 | -0.34 |
| P10 | 956.78 | 949.87 | 963.01 | 957.12 | -6.91 | 6.23 | 0.34 |
| P11 | 1154.21 | 1146.55 | 1160.78 | 1153.87 | -7.66 | 6.57 | -0.34 |
| P12 | 890.12 | 883.21 | 896.78 | 890.56 | -6.91 | 6.66 | 0.44 |
| P13 | 1032.65 | 1025.11 | 1038.90 | 1032.29 | -7.54 | 6.25 | -0.36 |
| P14 | 901.45 | 894.33 | 907.67 | 901.89 | -7.12 | 6.22 | 0.44 |
| P15 | 1187.90 | 1180.21 | 1194.32 | 1187.56 | -7.69 | 6.42 | -0.34 |
From Table 2, the errors for the UAV photogrammetry method range from -7.69 mm to -6.33 mm (negative bias indicates underestimation), while the LiDAR method exhibits errors from 6.20 mm to 6.66 mm (positive bias indicates overestimation). In contrast, the proposed integrated method reduces the error magnitude to a range of -0.46 mm to 0.47 mm, demonstrating near-ideal performance. To quantify the overall accuracy, we computed three metrics: Mean Absolute Error (MAE), Root Mean Square Error (RMSE), and maximum absolute error (\(z_{\text{max}}\)). The definitions are:
$$ \text{MAE} = \frac{1}{N} \sum_{i=1}^{N} |e_i| $$
$$ \text{RMSE} = \sqrt{\frac{1}{N} \sum_{i=1}^{N} e_i^2} $$
$$ z_{\text{max}} = \max(|e_1|, |e_2|, \ldots, |e_N|) $$
where \(e_i\) is the error at the \(i\)-th control point, and \(N = 15\). Table 3 summarizes these metrics for the three methods.
| Method | MAE (mm) | RMSE (mm) | \(z_{\text{max}}\) (mm) |
|---|---|---|---|
| UAV Photogrammetry | 7.02 | 7.31 | 7.69 |
| LiDAR | 6.35 | 6.43 | 6.66 |
| Proposed integrated method | 0.39 | 0.42 | 0.47 |
The results clearly show that the proposed method achieves a MAE of only 0.39 mm, an RMSE of 0.42 mm, and a maximum error of 0.47 mm. These values are an order of magnitude smaller than those from the standalone methods. The significant improvement is attributed to the synergistic fusion of high-precision LiDAR geometry (which provides accurate vertical coordinates) and dense UAV imagery (which enhances point density and fills gaps). Additionally, the GNSS dynamic measurement integration effectively corrects systematic biases in the LiDAR point cloud, particularly in areas with rough terrain or vegetation.
4. Discussion
The proposed integration method addresses several limitations of traditional monitoring techniques. First, UAV photogrammetry alone is sensitive to illumination conditions and textureless surfaces, leading to systematic errors in shadowed or homogeneous regions. LiDAR, while robust to lighting, suffers from sparse coverage and lack of texture information. By fusing both data sources, we achieve a complementary benefit: dense, accurate point clouds with realistic color attributes. Second, the use of a China UAV platform (DJI Air 3S) offers high maneuverability, long flight endurance (45 minutes), and precise GNSS/IMU integration, making it suitable for large-scale mining subsidence surveys. The introduction of GNSS dynamic measurement into the LiDAR processing chain further refines the trajectory solution and point cloud accuracy.
Despite the promising results, we acknowledge certain limitations. The experiment was conducted in a relatively small area (2.5 km²); scalability to larger regions (e.g., >10 km²) may require multiple flight missions and seamless mosaicking. Additionally, the data processing time for dense point cloud generation and fusion is currently around 2–3 hours per square kilometer, which could be optimized using parallel computing or GPU-accelerated algorithms. Future work will focus on automating the fusion pipeline and extending the method to monitor horizontal displacement using time-series analysis of UAV and LiDAR data.
5. Conclusion
In this study, we have developed an integrated monitoring method that combines UAV photogrammetry and LiDAR technology for accurate detection of mining subsidence. The China UAV-based system acquires both texture-rich imagery and high-precision point clouds, while GNSS dynamic measurement enhances the LiDAR accuracy. Our field experiment in a coal mine subsidence area demonstrates that the proposed method achieves a mean absolute error of 0.39 mm and a root mean square error of 0.42 mm, significantly outperforming standalone UAV photogrammetry and LiDAR techniques. The integration of geometric and photometric information provides a reliable, cost-effective solution for mining subsidence monitoring, with potential applications in environmental assessment and hazard mitigation.
We believe that the proposed framework can be extended to other deformation monitoring tasks, such as landslide surveillance and infrastructure health monitoring, by leveraging the flexibility and precision of China UAV platforms. Future improvements will include real-time data processing capabilities and the integration of InSAR data for three-dimensional deformation field estimation.