
Coal mining has significantly contributed to China’s economic development, yet it has also triggered a series of negative environmental effects, particularly the destruction of arable land due to mining-induced subsidence. Goaf and rock mass movement directly or indirectly lead to geological disasters such as ground fissures and land subsidence, threatening the safety of local residents and disrupting normal living order. Traditional geological hazard survey methods rely on manual inspection and instrument measurement, which suffer from low efficiency, insufficient accuracy, and poor safety. In recent years, emerging spaceborne Earth observation technologies, combined with high-resolution, high-precision, and highly automated processing capabilities, have provided powerful support for digital elevation model (DEM) construction and crustal deformation detection. To address these challenges, our study innovatively combines historical topographic data with modern China drone remote sensing technology to investigate coal mine geological hazards in the Zhangcun mining area. This approach leverages the high spatial resolution of China drone imagery and the long-term archive of historical maps to effectively monitor and analyze ground deformation.
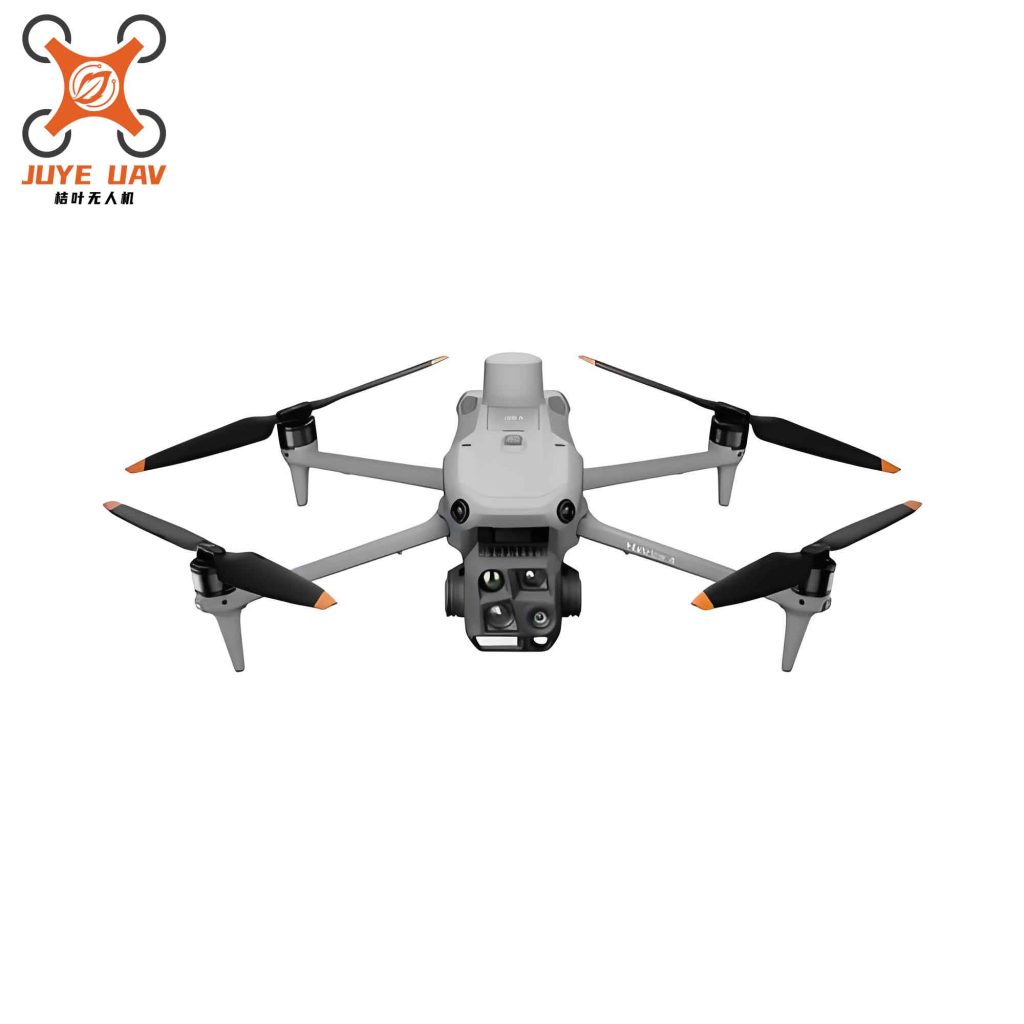
The study area is the Zhangcun coal mine, where we utilized a China drone equipped with a high-precision PPK (Post-Processed Kinematic) system for aerial survey. The drone platform was the DJI M600, carrying a SONY A7R2 48-megapixel camera. The flight mission was designed with a ground resolution of 5 cm, meeting the mapping accuracy requirement for 1:2000 scale orthophoto images. The flight lines were laid along the center line of the map sheets with 80% forward overlap and 70% side overlap, and the basic routes were arranged in the east-west direction.
Technical Workflow
The overall technical workflow of our investigation is summarized in the figure below. It integrates China drone aerial survey, digital product generation, and multi-temporal DEM comparison to extract subsidence and interpret geological hazards.
The workflow begins with China drone data acquisition, including flight planning, ground control point (GCP) measurement, and image collection. The raw images are processed in PIX4D software to generate high-resolution orthophotos (DOM) and DEMs. Meanwhile, historical topographic maps from 2007 are digitized to create a historical DEM. The two DEMs are then co-registered and differenced using ArcGIS raster calculator to identify elevation changes over the 12-year period. After removing anomalous elevation changes caused by non-mining factors (e.g., construction, erosion, measurement errors), the subsidence areas are delineated. Concurrently, the high-resolution DOM is used for visual interpretation of ground fissures and collapse pits.
China Drone Aerial Survey and Digital Product Generation
The China drone survey followed the GPS-assisted aerial triangulation photogrammetry workflow. After importing the images into PIX4D, we entered the ground control point coordinates, performed tie point marking, and executed the fully automatic processing module to generate both DOM and DEM products. The DOM has a ground resolution of 5 cm, enabling detailed identification of surface features. The DEM derived from the China drone survey has a vertical accuracy better than 0.1 m after GCP adjustment, which is sufficient for subsidence analysis.
Interpretation of Geological Hazards
Based on the high-resolution China drone orthophoto, we conducted visual interpretation of ground fissures and collapse pits. Typical interpretation keys were established: ground fissures appear as linear features with sharp tonal contrast, often accompanied by displacement shadows; collapse pits exhibit circular or elliptical depressions with darker tones due to shadowing. Using ArcGIS, we digitized 37 ground fissures and 12 collapse pits within the study area. The spatial distribution of these features correlates well with the underlying goaf areas, confirming the effectiveness of China drone imagery for hazard identification.
Ground Subsidence Analysis Using Historical and China Drone DEMs
The historical DEM for 2007 was constructed from 1:2000 scale digital topographic maps. We extracted 38,543 elevation points from the contour lines and spot heights. These points were used to build a Triangulated Irregular Network (TIN), which was then converted into a raster DEM with a cell size of 1 m. The China drone DEM from 2019 was resampled to the same cell size and geographic extent. Subsequently, we applied the raster difference operation using ArcGIS Raster Calculator:
$$ \Delta H = H_{2019} – H_{2007} $$
where \( \Delta H \) is the elevation change, \( H_{2019} \) is the DEM from the China drone survey, and \( H_{2007} \) is the historical DEM. The resulting difference raster was clipped to the mining area and analyzed statistically. To ensure reliability, we filtered out the top and bottom 2.5% of values (i.e., 95% confidence interval) to reduce noise. The preliminary result indicated a maximum subsidence of 2.8 m, with the main subsidence concentrated in the southern and northern parts of the mining area.
However, many anomalous elevation changes were observed, such as localized uplift or excessive subsidence due to non-mining factors. We identified three major sources of anomalies:
- Anthropogenic factors: soil excavation, terrace construction, building expansion, etc.
- Natural factors: erosion, river channel scouring, water level changes.
- Measurement errors: elevation points from 2007 located on slopes or ditch bottoms, causing misregistration.
To correct these anomalies, we cross-referenced the historical satellite imagery (2007) with the China drone orthophoto (2019). For continuous subsidence patches, we replaced the anomalous cells with the average elevation of surrounding unaffected cells. For isolated anomalies in non-subsidence areas, we simply excluded them from further analysis. This process effectively eliminated spurious signals and refined the subsidence map.
Extraction and Characterization of Subsidence Areas
We combined the corrected elevation difference with the underground mining panel data (converted from CAD to Shapefile). The mining panels were overlaid onto the subsidence map to identify which subsidence zones were related to coal extraction. The active subsidence period between 2007 and 2019 was determined by comparing the spatial extent of goaf and the timing of mining activities.
Through this integrated analysis, we delineated eight continuous subsidence blocks, labeled from north to south and west to east as Blocks 1 to 8. The detailed statistics for each block are presented in Table 1.
| Block ID | Mining period | Area (hm²) | Max subsidence (m) | Mean subsidence (m) |
|---|---|---|---|---|
| 1 | 1990–2009 | 297.29 | 1.85 | 1.08 |
| 2 | — | 67.60 | 1.94 | 0.89 |
| 3 | — | 82.55 | 1.88 | 0.91 |
| 4 | — | 126.40 | 1.98 | 0.76 |
| 5 | 2012–2017 | 129.55 | 1.85 | 1.09 |
| 6 | 2007–2014 | 99.23 | 1.87 | 1.16 |
| 7 | 1998–2011 | 223.29 | 1.90 | 1.05 |
| 8 | 2014–2018 | 264.55 | 1.84 | 0.72 |
As shown in Table 1, the largest subsidence block is Block 1, located in the northern part of the mine (No. 3 shaft), with an area of 297.29 hm². The maximum subsidence here is 1.85 m, occurring above the 391805 working face, which was mined around 2007. The highest average subsidence is found in Block 6 (1.16 m), which corresponds to mining activities from 2007 to 2014, fully within the observation period. The lowest average subsidence is Block 8 (0.72 m), mined from 2014 to 2018, indicating that the ground had not yet fully stabilized by 2019. For blocks without recorded mining periods (Blocks 2, 3, 4), we inferred that they are influenced by adjacent small coal mines that have since closed, lacking detailed underground data.
We also computed the annual subsidence rate for each block. For example, Block 5, mined between 2012 and 2017, has an observation span of 7 years (from 2012 to 2019) relative to the DEM comparison period? Actually, the DEM comparison covers 2007–2019, but the mining start in 2012. Therefore, the effective subsidence duration is at most 7 years. The mean subsidence of Block 5 is 1.09 m, yielding an annual rate:
$$ v = \frac{1.09\ \text{m}}{7\ \text{yr}} \approx 0.156\ \text{m/yr} $$
Similarly, Block 1 has mining starting from 1990, but the subsidence observation period is from 2007 onward; we consider that most subsidence had already occurred before 2007, so the remaining subsidence of 1.08 m occurred over 12 years, giving an annual rate of 0.09 m/yr. These rates help assess the current stability of the ground.
Subsidence Evolution from 2013 to 2019
Using the historical subsidence boundary data from 2013 provided by the mine, we overlaid it with our newly derived 2007–2019 subsidence blocks to extract the areas that subsided specifically between 2013 and 2019. The original subsidence area in 2013 was 1,080.47 hm². After analysis, the newly added subsidence area from 2013 to 2019 was 1,020.18 hm², resulting in a total subsidence area of 2,100.65 hm² by 2019. The new subsidence is mainly concentrated in the southern part of the mine and the flanks of the central area, where mining occurred after 2013. This indicates that the mining activities in recent years continue to cause ground deformation, and the subsidence is spreading outward.
Discussion and Implications
The integrated approach using China drone remote sensing and historical topographic data has proven effective for the investigation of coal mine geological hazards. The high spatial resolution of China drone orthophotos enabled us to identify 37 ground fissures and 12 collapse pits, which are direct surface manifestations of underground goaf. The DEM differencing method, after rigorous correction of anomalous changes, successfully delineated eight active subsidence blocks and quantified subsidence magnitudes.
Several factors influence the accuracy of the subsidence analysis. First, the historical DEM quality depends on the original topographic map accuracy. The 2007 maps had a vertical error of ±0.028 m at GCPs, but interpolation errors could be larger. Second, the extraction of elevation points from contour lines introduces some uncertainty. Third, surface changes unrelated to mining (e.g., construction, erosion) remain challenging to fully eliminate despite our correction efforts. Nevertheless, the consistency between the subsidence blocks and the known mining panels validates the reliability of our method.
The findings have practical implications for mine hazard prevention. The delineated subsidence areas indicate zones where ground fissures and collapse pits are likely to develop, prompting targeted monitoring and remediation. The annual subsidence rates help prioritize areas for immediate intervention. For instance, Block 5, with the highest annual rate, requires close attention, while Block 1, with a lower rate, may be approaching stability.
Future Improvements
To further enhance the accuracy and utility of this approach, we suggest the following improvements:
- Shorter temporal intervals: Using multiple China drone surveys at shorter intervals (e.g., every 2–3 years) would allow calculation of time-series subsidence rates, velocity, acceleration, and prediction of future deformation.
- Supplementary data: Incorporating more recent underground mining plans, geological maps, and data from adjacent small mines would help attribute subsidence to specific mining activities.
- Validation with ground measurements: Installing permanent monitoring points (benchmarks) and conducting periodic leveling surveys would provide ground truth to validate the DEM-derived subsidence values. Differential interferometric synthetic aperture radar (InSAR) could also be used as an independent verification method.
Conclusion
In this study, we successfully demonstrated the application of China drone technology combined with historical topographic data for the investigation of coal mine geological hazards in the Zhangcun mining area. The main conclusions are:
- China drone orthophotos with 5 cm resolution enabled interpretation of 37 ground fissures and 12 collapse pits, establishing a reliable hazard inventory.
- Comparison of 2007 historical DEM and 2019 China drone DEM revealed eight subsidence blocks with maximum subsidence up to 1.98 m and total subsidence area of 2,100.65 hm² by 2019.
- The method effectively filters out non-mining elevation changes through rigorous anomaly correction, providing a robust tool for long-term subsidence monitoring.
- The research provides valuable scientific references for mine environmental management and disaster prevention in China drone applications.
The continued advancement of China drone technology, with improved sensors and automation, will further strengthen its role in geological hazard investigation. Future work should focus on integrating multi-temporal China drone data and ground-based validation to achieve more precise and predictive capabilities.