
In modern warfare, small unmanned aerial vehicles (UAVs) and their swarms have emerged as significant threats, challenging conventional air defense systems. Understanding the interaction between high-power microwave (HPM) and small fixed-wing UAVs is crucial for developing effective countermeasures. In this paper, we present a comprehensive investigation of the HPM effects on a specific small fixed-wing UAV operating in the S-band. Our approach integrates system-level, subsystem-level, and component-level electromagnetic modeling, coupling simulation, and effect tests. Through this multiscale methodology, we aim to identify the most vulnerable subsystems and quantify the power density thresholds that lead to disruption or damage. The primary focus is on the receiver module, which we found to be the most sensitive component. The following sections detail the HPM environment definition, electromagnetic modeling and simulation results, experimental validation, and final conclusions.
We begin by establishing the HPM electromagnetic environment used throughout this study. According to IEC 61000-2-13, high-power electromagnetic environments (HPEM) include nuclear electromagnetic pulse (NEMP), ultra-wideband (UWB), mesoband, and narrowband HPM. Our work concentrates on narrowband HPM, characterized by a carrier frequency of 3 GHz (S-band), with a pulse width in the microsecond range. The electric field strength in the far-field region can be derived from the radar equation:
$$ E = \frac{\sqrt{30 P G}}{R} $$
where \(P\) is the transmitter power, \(G\) is the antenna gain, and \(R\) is the distance from the antenna. The power density \(S\) is given by:
$$ S = \frac{E^2}{\eta} $$
with \(\eta\) representing the wave impedance (377 ohms in free space). In our simulations, we normalize the incident plane wave to a power density of 10 W/cm², which corresponds to an electric field amplitude of approximately 1942 V/m. The normalized time-domain waveform of the incident pulse is a modulated sinusoid with a pulse duration set to 3 ns for computational efficiency. The waveform is expressed as:
$$ E(t) = E_0 \sin(2\pi f_0 t) \cdot u(t) \cdot \left[ u(t) – u(t – \tau) \right] $$
where \(E_0\) is the peak field amplitude, \(f_0 = 3\) GHz, \(\tau\) is the pulse width, and \(u(t)\) is the unit step function.
Electromagnetic Modeling and Simulation of Fixed-Wing UAV
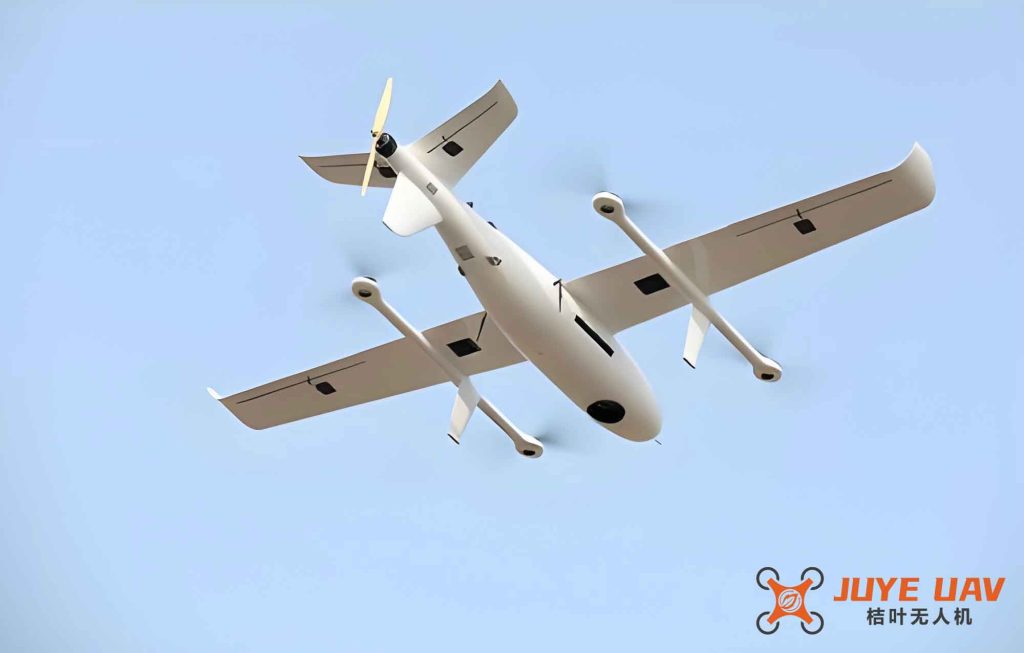
We constructed a three-dimensional geometric model of the small fixed-wing UAV based on its actual dimensions and materials. The fuselage is made of polystyrene (relative permittivity \(\varepsilon_r = 2.55\), loss tangent 7×10⁻⁴). The internal components include a DC battery, communication receiver, servos, a brushless motor, and associated wiring. The positions of these key components are defined within the model. The simulation is performed using a finite-difference time-domain (FDTD) solver with an incident plane wave having a power density of 10 W/cm² and vertical polarization.
Fuselage Irradiation Simulation
The simulated electric field distribution across the fixed-wing UAV reveals significant field enhancement near the wingtips and internal cavities. The induced electric field at various probe locations is summarized in Table 1. The highest field strength of 13.9 kV/m occurs at the DC power supply location, followed by the receiver (7.9 kV/m), the brushless motor (9.6 kV/m), and the wing servos (6.3 kV/m). The fields persist for several nanoseconds after the incident pulse ends due to resonance effects.
| Location | Peak Induced Electric Field (kV/m) | Duration (ns) |
|---|---|---|
| DC Battery | 13.9 | 2.3 – 6.0 |
| Receiver | 7.9 | 3.3 – 7.6 |
| Wing Servo | 6.3 | 3.8 – 6.5 |
| Brushless Motor | 9.6 | 7.0 – 10.0 |
Wire Harness Coupling Simulation
We modeled the complete wiring network of the fixed-wing UAV,including power cables, servo control lines, and motor phase wires. The cables are distributed horizontally inside the fuselage. Under vertical polarization, the coupling to horizontal wires is less efficient, but field enhancement from the fuselage increases the induced voltages. The lumped-parameter circuit model used for the cable network is shown in Figure 5 of the reference. Four monitoring probes were placed at the terminals: P1 (DC power cable end), P2 (brushless motor control cable), P3 (body servo control cable), and P4 (wing servo control cable). The induced voltages at these probes are plotted in Figure 6. The highest peak voltage is 1.9 V at the wing servo cable port. Other ports exhibit peaks around 1 V. Table 2 summarizes the peak induced voltages.
| Probe | Cable Description | Peak Voltage (V) |
|---|---|---|
| P1 | DC Power Cable | 1.1 |
| P2 | Motor Control Cable | 0.9 |
| P3 | Fuselage Servo Cable | 1.2 |
| P4 | Wing Servo Cable | 1.9 |
These voltage levels are below typical digital logic thresholds (e.g., 2.5 V for TTL), so cable coupling alone is unlikely to cause immediate malfunction at this power density. However, they may contribute to cumulative noise or upset in the presence of other coupling paths.
Receiver Circuit Board Simulation
The receiver circuit board is the most complex and sensitive component. We performed a detailed simulation of the receiver PCB with its antenna (a 920 MHz half-wave dipole) and integrated circuits. The incident plane wave power density was again set to 10 W/cm². The simulated internal electric field on the board reaches as high as 257 kV/m, far exceeding typical withstand levels of semiconductor junctions. We monitored three voltage nodes: N1 (on a header pin connecting to cables), N2 (on a communication chip pin), and N3 (on a control chip pin relative to ground). The induced voltage waveforms are shown in Figure 8. The peak induced voltage on the header pin is 4.5 V, while the chip pins exhibit peaks around 3.0 V. These values exceed the typical noise margin of 3.3 V CMOS logic, posing a risk of logic upset or latch-up.
To further quantify the relationship between incident power density and induced voltage, we performed a parametric sweep from 1 to 30 W/cm². The results are linear, as shown in Figure 9. For power densities above 5 W/cm², the chip pin voltages exceed 1 V, and header pin voltages exceed 3 V, indicating that the receiver is vulnerable to disruption at power densities as low as 5 W/cm². Table 3 provides the induced voltages at three representative power densities.
| Power Density (W/cm²) | Header Pin Voltage (V) | Comm. Chip Pin Voltage (V) | Control Chip Pin Voltage (V) |
|---|---|---|---|
| 5.0 | 3.2 | 1.5 | 1.8 |
| 7.9 | 3.9 | 2.1 | 2.4 |
| 10.0 | 4.5 | 2.8 | 3.0 |
These simulation results strongly suggest that the receiver is the primary weak point of the fixed-wing UAV under HPM irradiation. The cable coupling, while measurable, contributes less to system failure compared to direct coupling to the receiver PCB.
HPM Effect Test on Fixed-Wing UAV
To validate the simulation predictions, we performed a series of HPM irradiation tests on the actual small fixed-wing UAV. The test setup consists of an S-band HPM source with vertical polarization, a microwave measurement system to record power density, and the UAV placed at various distances to vary the incident power density. The relationship between distance and power density is shown in Figure 11. We conducted system-level tests on the fully assembled UAV, followed by subsystem-level tests isolating the receiver and cables.
System-Level Irradiation
The fully operational fixed-wing UAV was placed in the HPM beam with its receiver connected to a controller, battery, brushless motor, and servos. At a power density of 5.5 W/cm², intermittent communication loss was observed. When the power density was increased to 7.9 W/cm², the UAV exhibited stable failure: the receiver lost communication with the controller, the brushless motor stopped, and the servos ceased movement. This represents a “soft” disruption (temporary upset). After repeated exposure at 10.5 W/cm², permanent damage occurred—the receiver no longer responded even after the HPM was removed.
Subsystem-Level Tests: Cable Influence
We performed two subsystem tests to isolate the contribution of cable coupling.
Test 1 – Only Receiver and Motor Connected: The UAV was configured with the receiver connected to the battery and brushless motor, but all servo cables were disconnected. Under 7.9 W/cm² irradiation, the receiver lost communication and the motor stopped. This shows that servo cables are not essential for the upset.
Test 2 – Only Receiver and Servos Connected: The receiver was connected to the battery and wing servos, but the motor cable was disconnected. Again, at 7.9 W/cm², the receiver communication failed and the servos stopped. Therefore, the motor cables also do not play a decisive role.
These tests indicate that the cable coupling alone is insufficient to cause system failure; the dominant coupling path is directly into the receiver itself.
Receiver Module Irradiation Test
We isolated the receiver module and powered it via a shielded battery placed inside an EMI enclosure. The receiver’s output pins were monitored before and during HPM exposure. Before irradiation, the communication and control pins showed normal pulse signals. At a power density of 7.9 W/cm², the receiver lost its link with the controller. After the pulse, the communication pin 1 exhibited a constant DC level, communication pin 2 showed no output, and control pin 1 had no output. This is consistent with the simulation, where induced voltages exceeded the logic thresholds, causing the chip to enter an abnormal state (latch-up or upset). The observed output waveforms are illustrated in Figure 15. Table 4 summarizes the pin states before and after irradiation.
| Pin | Before Irradiation | After Irradiation |
|---|---|---|
| Communication Pin 1 | PWM signal present | DC high (constant) |
| Communication Pin 2 | PWM signal present | No output (0 V) |
| Control Pin 1 | PWM signal present | No output (0 V) |
These experimental results confirm that the receiver is the most vulnerable subsystem of the fixed-wing UAV. The disruption threshold is around 7.9 W/cm² for our specific receiver design, which aligns with the simulation predictions that pin voltages exceed logic margins at power densities above 5 W/cm².
Conclusion
Through a combination of electromagnetic simulation and controlled HPM experiments, we have identified the receiver module as the primary cause of system-level disruption in the small fixed-wing UAV under S-band HPM irradiation. The receiver printed circuit board experiences induced voltages up to 4.5 V on its connector pins when exposed to 10 W/cm², which is well above the noise margins of typical 3.3 V logic. Cable coupling, while measurable, contributes a secondary effect with induced voltages below 2 V. The experimental threshold for stable disruption is 7.9 W/cm², at which point the receiver ceases communication and control outputs vanish. Permanent damage occurs at 10.5 W/cm² after repeated pulses. These findings provide quantitative guidance for hardening the fixed-wing UAV against HPM threats: shielding the receiver, adding transient voltage suppressors on critical interfaces, and employing feed-through filters on power and signal lines can raise the failure threshold. Future work will extend this analysis to other frequency bands and explore the effects of HPM on larger fixed-wing UAVs with more complex avionics.