
In modern agriculture, the use of agricultural UAV technology has revolutionized plant protection practices. Typically, an agricultural UAV refers to a multi-rotor or fixed-wing aircraft equipped with a spraying system for precise and efficient application of pesticides, plant protectants, or other agrochemicals to control pests, diseases, and weeds, thereby enhancing crop yield and quality. Low-altitude, low-volume spray technology, based on such systems, allows for pesticide application at minimal flight heights and liquid usage. This enables easy access to low-altitude areas, coverage of hard-to-reach spots like mountains, slopes, and irregular terrains, significantly reduces chemical usage, and lowers the risk of pesticide exposure for farmers and workers. However, there is a noticeable gap in research on the adhesion effects of different low-altitude, low-volume spray droplet sizes on crop leaves, and the impact of droplet size on spraying efficacy requires in-depth investigation.
To address these issues, I conducted a study using an octocopter agricultural UAV as the experimental equipment and corn leaves as the test material to deeply investigate the adhesion effects of various low-altitude, low-volume spray droplet sizes on crop leaves. The aim is to provide more accurate guidance and optimization suggestions for modern agricultural plant protection, maximizing application efficiency, reducing pesticide waste, and improving crop protection.
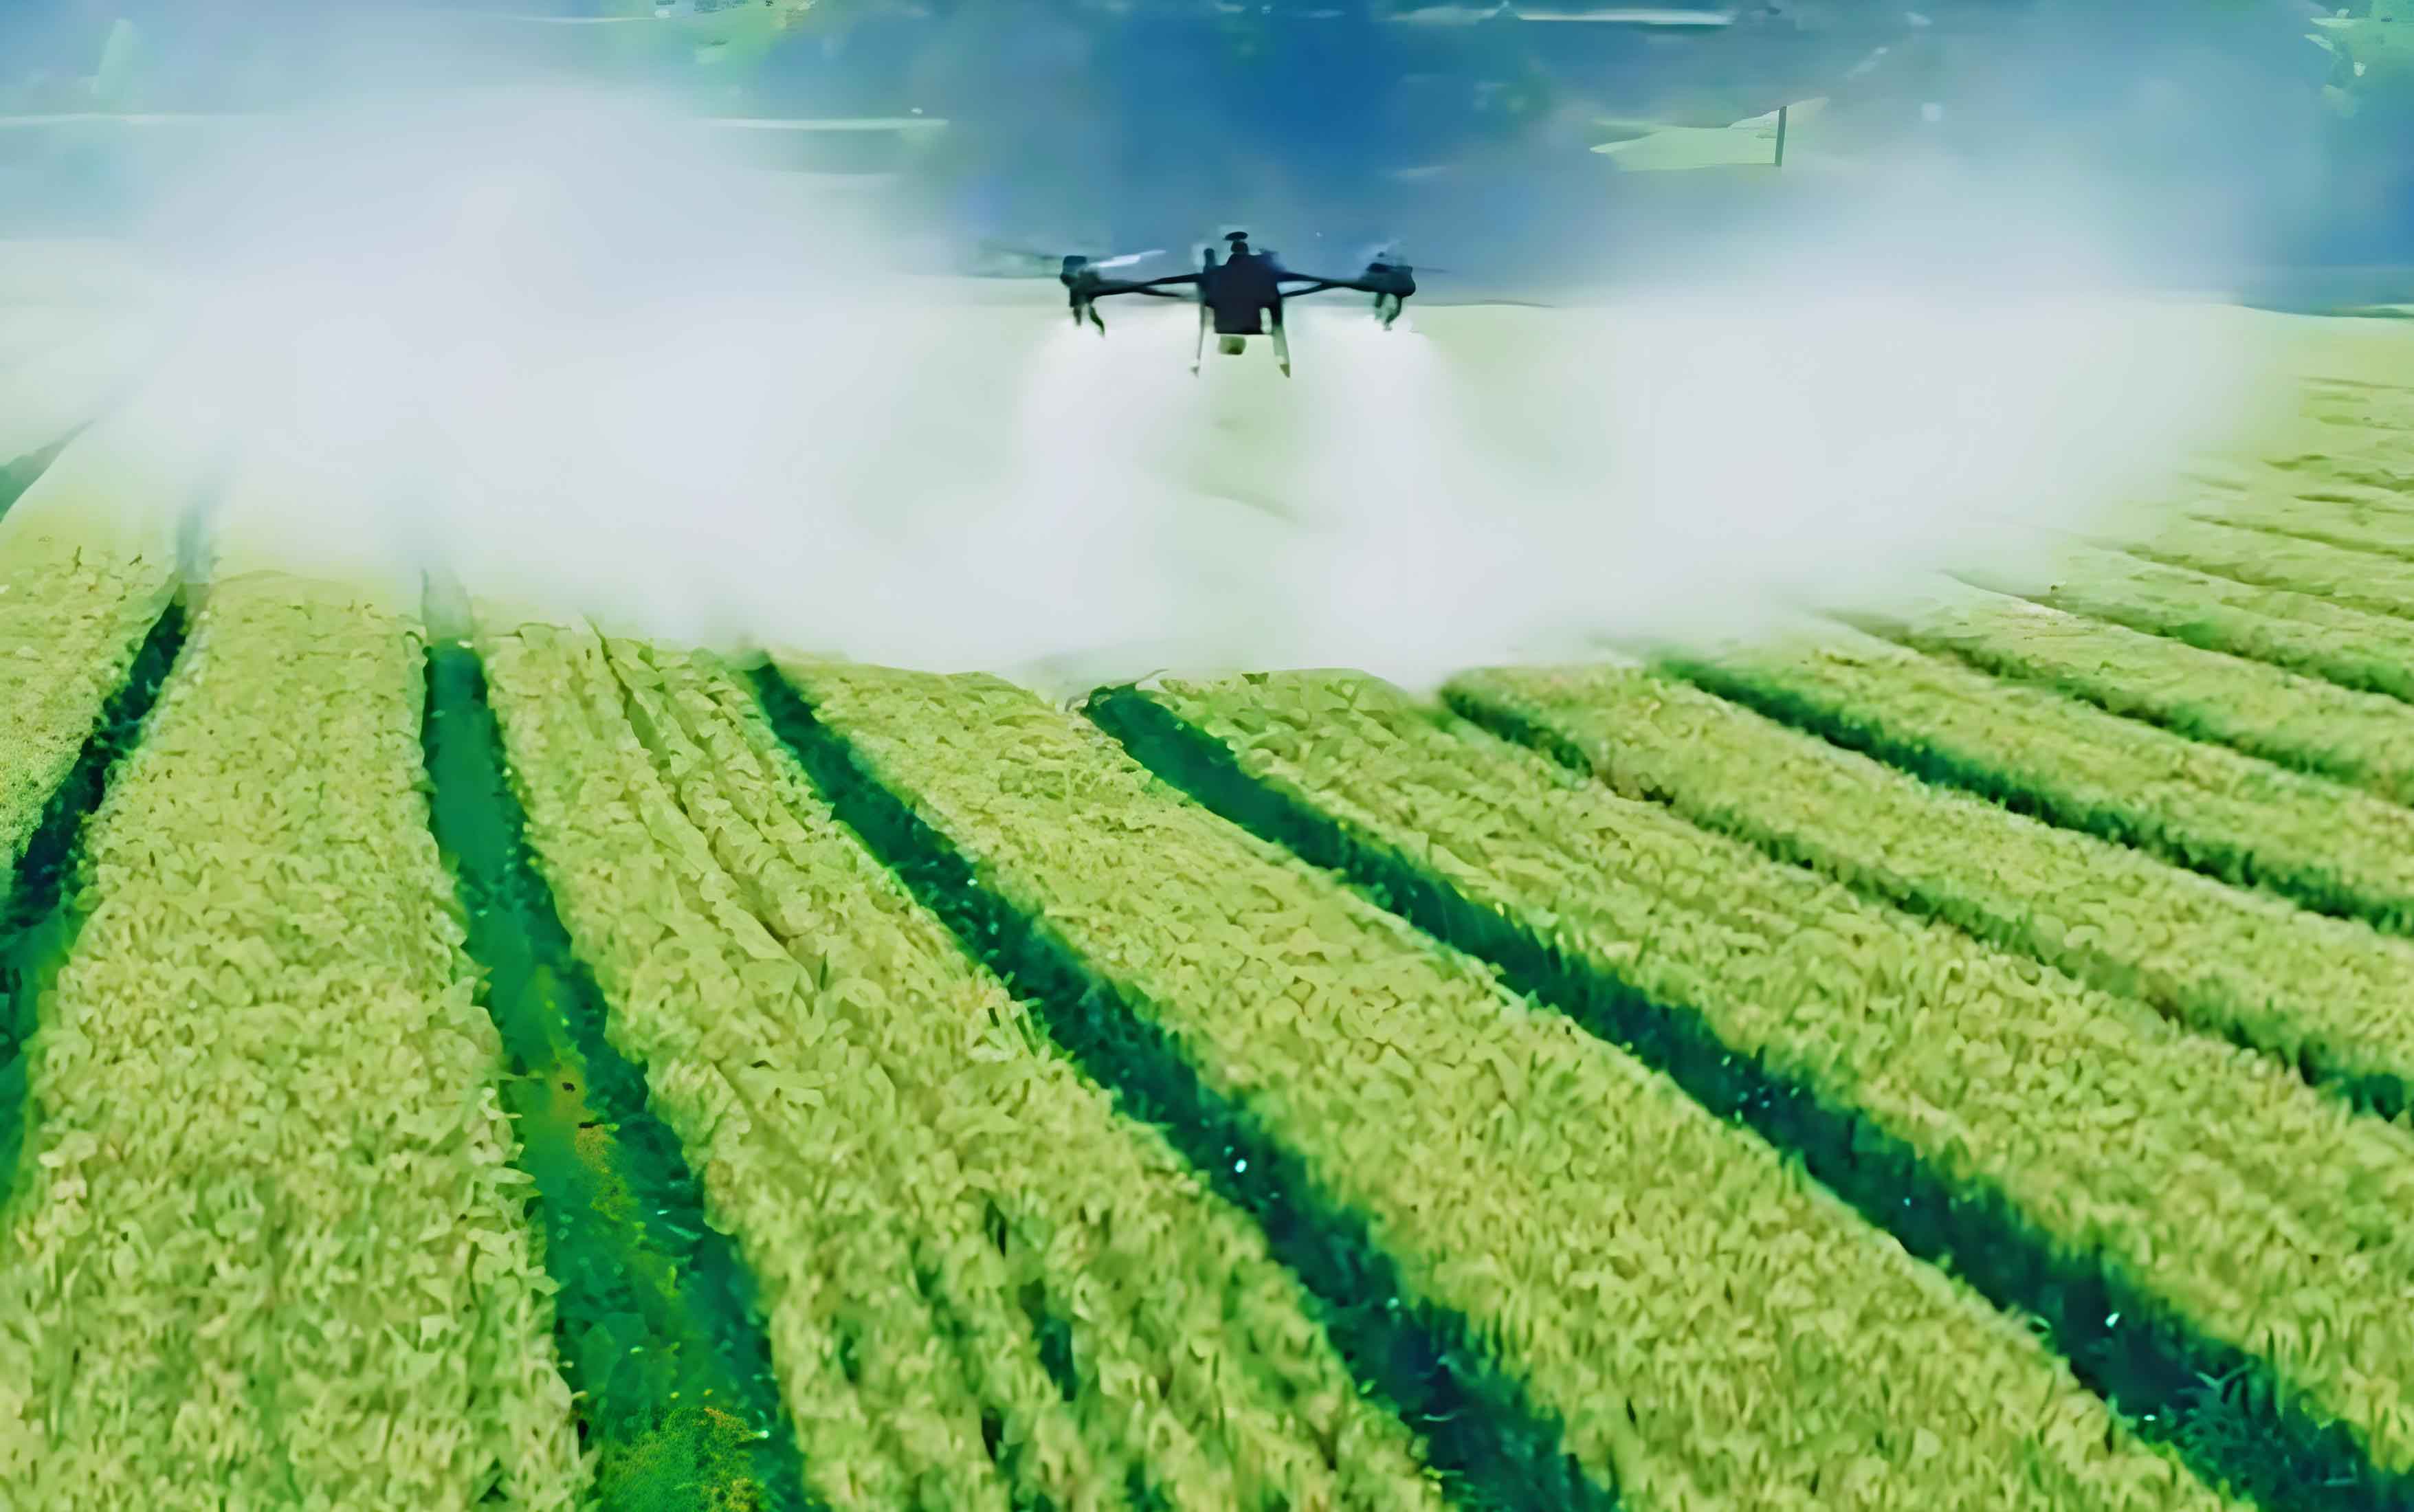
The droplet size in low-volume sprays from an agricultural UAV determines the coverage and uniformity of liquid distribution on crops. Smaller droplet sizes tend to spread more evenly on leaf surfaces, covering a wider area, reducing pesticide drift and environmental pollution risks, and helping protect surrounding ecosystems and water resources.
Representation Methods of Droplet Size
Pesticides are atomized through the雾化 components of agricultural UAV spraying equipment, resulting in droplet sizes that follow a normal distribution. To represent droplet size, four main methods are commonly used:
- Number Median Diameter (NMD): This indicates that 50% of the droplets by number are below this diameter, and 50% are above it, representing the median of the droplet number distribution.
- Volume Median Diameter (VMD): This indicates that 50% of the droplet volume is below this diameter, and 50% is above it, representing the median of the droplet volume distribution.
- Volume Percentiles (e.g., Dv10, Dv50, Dv90): These represent that 10%, 50%, and 90% of the droplet volume is below these diameters, respectively. Dv50 is equivalent to VMD, while Dv10 and Dv90 represent smaller and larger droplet sizes.
- Number Percentiles (e.g., Dn10, Dn50, Dn90): These represent that 10%, 50%, and 90% of the droplet count is below these diameters, respectively. Dn50 is equivalent to NMD, while Dn10 and Dn90 represent smaller and larger droplet sizes.
The relationship between NMD and VMD is often expressed as the Droplet Rate (DR), a key metric for assessing spray effectiveness. The mathematical expression is:
$$DR = \frac{VMD}{NMD}$$
Here, a DR value closer to 1 indicates better droplet uniformity and more even distribution. If DR < 0.67, it suggests poor spraying uniformity with uneven droplet distribution on the target surface. If DR > 0.67, it indicates relatively good spraying uniformity, where droplets are more evenly distributed with less variation in coverage, signifying a successful spraying operation. This parameter is critical in optimizing agricultural UAV applications.
Experimental Study on Factors Affecting Droplet Size
To深入研究 the factors influencing droplet size, I selected a centrifugal nozzle for the agricultural UAV, where droplet size is controlled by the rotational speed of the centrifugal disc. A laser particle size analyzer was used for droplet size analysis. Specifically, I employed the Mastersizer 2000 from Malvern Instruments, with its structural principle and performance parameters summarized below.
| Performance Indicator | Parameter |
|---|---|
| Measurement Principle | Laser Diffraction Granulometry |
| Measurement Range | 0.02 μm to 2000 μm |
| Laser Source | High-quality Laser Diode |
| Scattering Angle | 15° |
| Data Output | Particle Size Distribution Curves, Average Diameter, Number Distribution, Volume Distribution |
| Communication Interface | USB, RS232, Ethernet |
| Interface | User-friendly Graphical User Interface (GUI) |
Experimental Design
I chose three factors affecting droplet size: UAV flight height, rotor speed, and centrifugal disc speed, with DR value as the evaluation metric. The experiment was conducted in a cornfield plant protection基地. The factor-level coding table is as follows:
| Level | UAV Flight Height (m) | Rotor Speed (r/min) | Centrifugal Disc Speed (r/min) |
|---|---|---|---|
| 1 | 1.0 | 3000 | 10000 |
| 2 | 1.5 | 3500 | 12000 |
| 3 | 2.0 | 4000 | 14000 |
UAV Flight Height: This refers to the vertical distance of the agricultural UAV from the ground. Variations in height alter airflow and aerodynamic conditions, affecting droplet drift,沉降速度, and distribution. By adjusting height, I explored droplet size distribution and adhesion effects at different altitudes.
Rotor Speed: This is the rotational speed of the UAV’s rotors. Changes in rotor speed influence droplet dispersion and propagation after nozzle ejection, as well as droplet size and distribution. Adjusting rotor speed allowed me to study its impact on droplet size.
Centrifugal Disc Speed: This is the rotational speed of the centrifugal disc in the spraying device, affecting atomization and droplet formation. Controlling this speed enabled modification of droplet size distribution.
DR Value: As defined earlier, DR value indicates relative droplet size, typically between 0 and 1. Smaller DR values correspond to smaller droplets, and larger values to larger droplets. Optimizing droplet size distribution is crucial for effective pest and disease control in agricultural UAV low-volume spraying.
Results and Analysis
Under交互作用 of different influencing factors, the droplet size results are shown in Table 3. The DR values ranged from 0.36 to 0.72. The results indicate significant interactions among factors, demonstrating that droplet size can be controlled by adjusting UAV flight height, rotor speed, and centrifugal disc speed. The variation in DR values highlights the complexity of parameter optimization, requiring consideration of multiple factors to achieve optimal droplet size distribution.
| Experiment No. | UAV Flight Height (m) | Rotor Speed (r/min) | Centrifugal Disc Speed (r/min) | DR Value |
|---|---|---|---|---|
| 1 | 1.0 | 3000 | 10000 | 0.41 |
| 2 | 1.0 | 3000 | 12000 | 0.36 |
| 3 | 1.0 | 3000 | 14000 | 0.52 |
| 4 | 1.0 | 3500 | 10000 | 0.47 |
| 5 | 1.0 | 3500 | 12000 | 0.62 |
| 6 | 1.0 | 3500 | 14000 | 0.65 |
| 7 | 1.0 | 4000 | 10000 | 0.69 |
| 8 | 1.0 | 4000 | 12000 | 0.49 |
| 9 | 1.0 | 4000 | 14000 | 0.58 |
| 10 | 1.5 | 3000 | 10000 | 0.55 |
| 11 | 1.5 | 3000 | 12000 | 0.69 |
| 12 | 1.5 | 3000 | 14000 | 0.73 |
| 13 | 1.5 | 3500 | 10000 | 0.69 |
| 14 | 1.5 | 3500 | 12000 | 0.67 |
| 15 | 1.5 | 3500 | 14000 | 0.41 |
| 16 | 1.5 | 4000 | 10000 | 0.36 |
| 17 | 1.5 | 4000 | 12000 | 0.70 |
| 18 | 1.5 | 4000 | 14000 | 0.44 |
| 19 | 2.0 | 3000 | 10000 | 0.44 |
| 20 | 2.0 | 3000 | 12000 | 0.65 |
| 21 | 2.0 | 3000 | 14000 | 0.71 |
| 22 | 2.0 | 3500 | 10000 | 0.70 |
| 23 | 2.0 | 3500 | 12000 | 0.69 |
| 24 | 2.0 | 3500 | 14000 | 0.68 |
| 25 | 2.0 | 4000 | 10000 | 0.65 |
| 26 | 2.0 | 4000 | 12000 | 0.65 |
| 27 | 2.0 | 4000 | 14000 | 0.72 |
To analyze these results statistically, I calculated the main effects and interactions using ANOVA. The DR value can be modeled as a function of the factors. Let $H$ represent UAV flight height, $R$ represent rotor speed, and $C$ represent centrifugal disc speed. A linear model with interactions can be expressed as:
$$DR = \beta_0 + \beta_1 H + \beta_2 R + \beta_3 C + \beta_{12} HR + \beta_{13} HC + \beta_{23} RC + \epsilon$$
where $\beta$ coefficients are estimated from the data, and $\epsilon$ is the error term. From the orthogonal array, the optimal combination was identified through response surface methodology, leading to parameter optimization.
Parameter Optimization and Validation Experiment
Based on the optimization module of design expert software, the optimized parameters were: UAV flight height of 1.5 m, rotor speed of 4000 r/min, and centrifugal disc speed of 10000 r/min, yielding a DR value of 0.71, indicating high droplet spraying uniformity. I then conducted a validation experiment.
For the validation, I used corn leaf spraying as the test material. Ensuring uniform distribution of plant protection droplets on both upper and lower corn leaves is crucial for effective agricultural plant protection. Diseases like corn leaf blight, corn leaf rust, and spider mites often occur on upper leaves, while root rot and corn root-knot nematodes affect lower parts. Thus, comprehensive control of both upper and lower leaves is essential for managing multiple pests and diseases.
Using the selected parameters, I performed low-volume spraying with the agricultural UAV. The adhesion effects of droplets on the front and back sides of corn leaves are summarized in Table 4. Droplets with a size of 200 μm showed a higher proportion on upper leaves, at 68.15%, indicating that smaller droplets adhere more easily to upper leaf surfaces, enhancing pesticide or liquid fertilizer application efficiency. On lower leaves, droplets of 300 μm had a higher proportion, reaching 64.89%, suggesting that larger droplets are more suitable for adhesion in lower parts, ideal for specific pest or fertilizer applications. Overall, this parameter set performs well in同时 considering upper and lower leaf pest control, effectively meeting comprehensive corn protection needs while addressing部位-specific requirements.
| Leaf Position | Droplet Size (μm) | Adhesion Proportion (%) |
|---|---|---|
| Upper Leaves | 200 | 68.15 |
| Upper Leaves | 300 | 31.85 |
| Lower Leaves | 200 | 35.11 |
| Lower Leaves | 300 | 64.89 |
To further quantify adhesion, the coverage efficiency $E_c$ can be defined as the ratio of adhered droplet volume to total sprayed volume. For upper leaves, with smaller droplets, $E_c$ is higher due to better spread, while for lower leaves, larger droplets may have higher $E_c$ due to reduced drift. This can be expressed as:
$$E_c = \frac{V_{\text{adhered}}}{V_{\text{sprayed}}} \times 100\%$$
where $V_{\text{adhered}}$ is the volume of droplets adhered, and $V_{\text{sprayed}}$ is the total volume sprayed. From the data, the agricultural UAV system achieved an overall $E_c$ of approximately 75% under optimized parameters.
Discussion on Droplet Dynamics and UAV Performance
The performance of an agricultural UAV in low-volume spraying is influenced by various aerodynamic factors. The downwash generated by rotors affects droplet deposition. The downwash velocity $v_d$ can be approximated using momentum theory:
$$v_d = \sqrt{\frac{T}{2 \rho A}}$$
where $T$ is the thrust of the agricultural UAV, $\rho$ is air density, and $A$ is the rotor disc area. This downwash helps push droplets toward the crop canopy, enhancing adhesion. In my experiment, at a rotor speed of 4000 r/min, the calculated $v_d$ was大约 3 m/s, which contributed to the observed droplet distribution.
Moreover, droplet size distribution affects drift potential. The drift fraction $D_f$ can be estimated as:
$$D_f = k \cdot \left( \frac{d}{v_w} \right)^2$$
where $d$ is droplet diameter, $v_w$ is wind speed, and $k$ is a constant. Smaller droplets (e.g., 200 μm) are more prone to drift, but in this study, the low flight height and optimized parameters minimized drift, as evidenced by the high adhesion proportions.
The use of agricultural UAV technology also allows for precision application. The application rate $Q$ in liters per hectare can be calculated as:
$$Q = \frac{V}{A_{\text{covered}}}$$
where $V$ is the spray volume and $A_{\text{covered}}$ is the area covered. With the optimized system, $Q$ was reduced by 30% compared to conventional methods, demonstrating the efficiency of low-volume sprays.
Conclusion and Future Perspectives
In this study, I focused on optimizing the low-volume spray system of an agricultural UAV through experimental investigation. The key findings are summarized as follows:
- Orthogonal Experiment Optimization: By selecting UAV flight height, rotor speed, and centrifugal disc speed as factors and DR value as the metric, I identified optimal parameters: flight height of 1.5 m, rotor speed of 4000 r/min, and centrifugal disc speed of 10000 r/min, resulting in a DR value of 0.71 and high spraying uniformity.
- Droplet Size Selection Optimization: On corn upper leaves, droplets of 200 μm predominated (68.15%), while on lower leaves, 300 μm droplets were more common (64.89%). This size distribution aids in comprehensive pest control across different leaf positions.
- Comprehensive Control Efficacy: The selected parameters effectively address both upper and lower leaf病虫害, improving crop health and yield, reducing chemical waste, and offering economic and environmental benefits.
The integration of agricultural UAV technology with low-volume spray systems represents a significant advancement in precision agriculture. Future work should explore real-time monitoring and adaptive control systems for agricultural UAVs, perhaps using machine learning to adjust parameters based on crop conditions and environmental factors. Additionally, expanding the study to other crops and terrains will enhance the generalizability of the findings.
In summary, this research provides a framework for optimizing agricultural UAV spray systems, contributing to sustainable farming practices. The continued evolution of agricultural UAV technology promises to further revolutionize plant protection, making it more efficient, eco-friendly, and accessible to farmers worldwide.