
The operational expansion of large Unmanned Aerial Vehicles (UAVs) presents significant safety challenges. Their substantial mass and high kinetic energy mean that any failure or accident poses severe risks not only to the asset itself but also to people and property on the ground. To mitigate these risks, a systematic and quantitative understanding of the underlying risk factors and their interrelationships with accident severity is paramount. This research investigates the internal correlation between risk factor influence intensity and the consequences of safety incidents in large UAV operations. By effectively identifying key risk elements, the study aims to provide a foundation for targeted safety enhancements and risk management protocols.
The foundation of this analysis is a dataset comprising 52 accident investigation reports for large UAVs. From these reports, risk factors were extracted and categorized into a structured evaluation system spanning four classic dimensions: Human, Machine, Environment, and Management. The Human factors encompass the operator’s psychological state, physiological condition, and capability level. The Machine (UAV System) category is broken down into critical subsystems: Power, Structure, Fuel, Cooling, Electrical, Flight Control, Navigation, Data Link, and Avionics/Equipment. Environmental factors include adverse weather and external interference (e.g., birds, electromagnetic). Management factors cover technical training, supervision, and organizational processes. Concurrently, the accidents were classified into three severity levels—Minor, Major, and Catastrophic—based on the extent of loss and damage, providing the target variable for correlation analysis.
| Risk Category | Risk Factor | Representative Description from Reports |
|---|---|---|
| Human Factors | Psychological State (H1) | Complacency, negative habit transfer. |
| Physiological State (H2) | Fatigue leading to loss of situational awareness. | |
| Capability Level (H3) | Pilot failed to assess the nature of the emergency, executed incorrect procedure. | |
| UAV System (Machine) | Power Subsystem (S1) | Engine design flaw, turbocharger failure, propeller thrust bearing fault. |
| Structure Subsystem (S2) | Empennage bolt failure. | |
| Fuel Subsystem (S3) | Metal particulate contamination, fuel leak. | |
| Cooling Subsystem (S4) | Coolant pump supply line fault, coolant leak. | |
| Electrical Subsystem (S5) | Electrical short circuit. | |
| Flight Control Subsystem (S6) | Control unit, module, or chip failure. | |
| Navigation Subsystem (S7) | GPS failure, Embedded GPS/INS (EGI) fault. | |
| Data Link Subsystem (S8) | Uplink signal loss. | |
| Avionics/Equipment Subsystem (S9) | Computer internal anomaly causing entry into an unplanned mission mode. | |
| Environmental Factors | Adverse Weather (E1) | Lightning strike, low-level wind shear, gust, airframe icing. |
| Animal/External Interference (E2) | Ground-based downlink interference. | |
| Management Factors | Technical Training (M1) | Limited experience, exaggerated training program procedures. |
| Supervision & Management (M2) | Delayed sample analysis, improper crew scheduling, lack of unified top-level decision-making authority. | |
| Organizational Process (M3) | Missing step in the technical manual’s “pre-flight” checklist to guide crew in confirming video source selection before take-off. |
To quantify the influence strength of each identified risk factor on the accident severity level, Grey Relational Analysis (GRA) was employed. GRA is suitable for systems with incomplete information and measures the degree of similarity between the developmental trends of a reference sequence (accident severity) and comparative sequences (each risk factor). The higher the relational grade, the stronger the influence. The computational process is as follows:
First, the absolute difference between the reference sequence \( x_0(k) \) and a comparative sequence \( x_i(k) \) is calculated. Then, the grey relational coefficient \( \zeta_i(k) \) for the \( k \)-th data point is derived using the formula:
$$
\zeta_i(k) = \frac{\min_i \min_k | x_0(k) – x_i(k) | + \rho \, \max_i \max_k | x_0(k) – x_i(k) |}{| x_0(k) – x_i(k) | + \rho \, \max_i \max_k | x_0(k) – x_i(k) |}
$$
where \( \rho \) is the distinguishing coefficient, typically set to 0.5. Finally, the overall Grey Relational Grade \( r_{0i} \) for factor \( i \) is obtained by averaging the coefficients across all data points:
$$
r_{0i} = \frac{1}{n} \sum_{k=1}^{n} \zeta_i(k)
$$
The results of the GRA, ranking the factors by their influence on accident severity, are presented in the table below. This analysis serves as a crucial filter, highlighting the factors with the most significant correlation to severe outcomes.
| Factor | Relational Grade | Rank | Factor | Relational Grade | Rank |
|---|---|---|---|---|---|
| Capability Level (H3) | 0.970 | 1 | Adverse Weather (E1) | 0.841 | 10 |
| Flight Control Subsystem (S6) | 0.953 | 2 | Electrical Subsystem (S5) | 0.841 | 11 |
| Fuel Subsystem (S3) | 0.942 | 3 | Navigation Subsystem (S7) | 0.832 | 12 |
| Avionics/Equipment Subsystem (S9) | 0.942 | 4 | Cooling Subsystem (S4) | 0.747 | 13 |
| Data Link Subsystem (S8) | 0.927 | 5 | Structure Subsystem (S2) | 0.747 | 14 |
| Power Subsystem (S1) | 0.916 | 6 | Psychological State (H1) | 0.747 | 15 |
| Technical Training (M1) | 0.877 | 7 | Physiological State (H2) | 0.632 | 16 |
| Supervision & Management (M2) | 0.856 | 8 | Animal/External Interference (E2) | 0.543 | 17 |
| Organizational Process (M3) | 0.856 | 9 |
While GRA identifies influential factors, understanding their probabilistic interdependencies is key for predictive risk assessment. For this, a Bayesian Network (BN) model was constructed. A BN is a directed acyclic graph where nodes represent random variables (risk factors, accident severity) and edges represent conditional dependencies. The joint probability distribution of all variables \(X_1, X_2, …, X_N\) is given by:
$$
P(X_1, X_2, …, X_N) = \prod_{j=1}^{N} P(X_j | \pi(X_j))
$$
where \( \pi(X_j) \) denotes the parent nodes of \( X_j \). To establish a robust causal structure for the network, the concept of an interventional operator (\( do \)-calculus) was considered. This helps in reasoning about the effect of forcibly setting a variable to a specific state, which is more aligned with causal influence than mere correlation. The interventional conditional probability is defined as:
For a causal link \( A \rightarrow B \), intervening on the child does not affect the parent:
$$P(A = a | do(B = b)) = P(A = a)$$
Whereas, the standard conditional probability reflects the natural observation:
$$P(B = b | do(A = a)) = P(B = b | A = a)$$
where \(a, b \in \{0, 1\}\) represent the non-occurrence or occurrence of a risk factor, respectively. This logic, combined with the K2 algorithm for structure learning and insights from the GRA rankings, was used to develop the final BN topology. The network explicitly models how factors like drone training (M1), organizational processes (M3), and supervision (M2) influence the operator’s capability level (H3), and how subsystem failures propagate to directly cause an accident of a certain severity level.
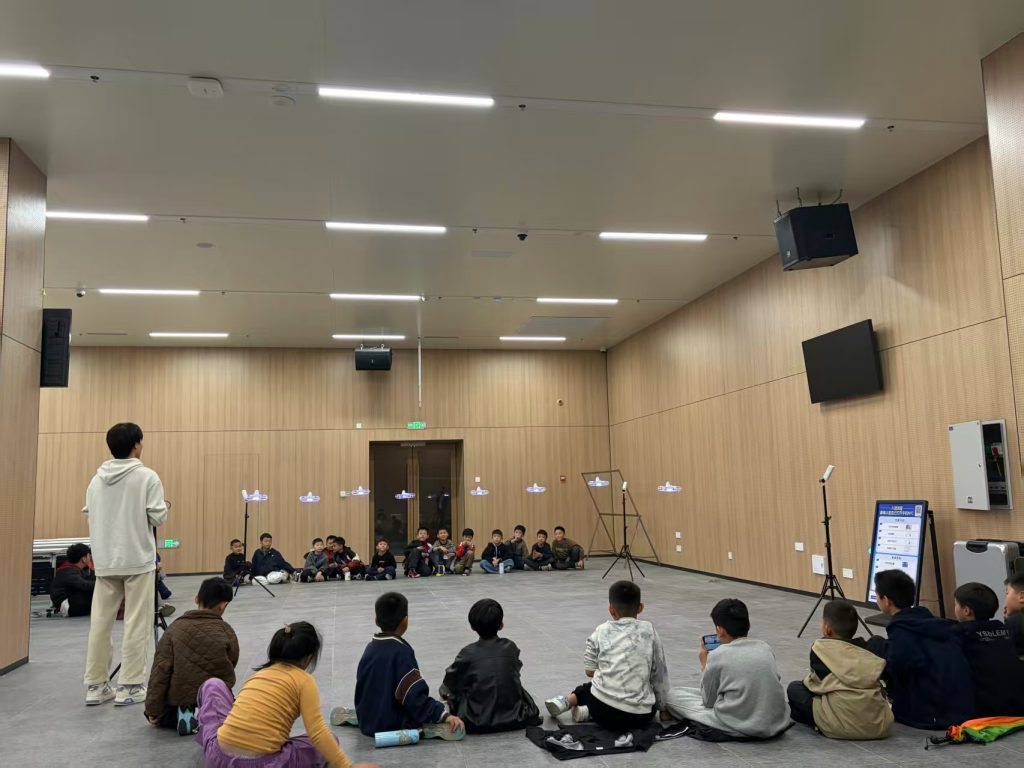
The importance of comprehensive and effective drone training cannot be overstated, as it is a primary managerial lever for improving the human operator’s capability level, which was identified as the most influential factor in accident severity. Parameter learning was then performed on the network using the 52-case dataset, where each variable was discretized (e.g., State1: No Influence, State2: Indirect Influence, State3: Direct Influence). The learned probabilities revealed crucial insights: the prior probability of a Minor accident was 78%, Major 18%, and Catastrophic 4%. The factors with the highest direct influence probability on the accident node were the Power Subsystem (32%), Capability Level (18%), and Flight Control Subsystem (16%). Among human factors, Capability Level had the highest occurrence probability (38%), and among management factors, Supervision & Management was most probable (21%).
The model’s accuracy was validated using k-fold cross-validation, yielding an overall accuracy of 0.839 for all nodes, indicating a reliable and robust model. Following validation, sensitivity analysis was conducted to determine which parent nodes most significantly affect the posterior probability of key target nodes. The analysis confirmed that the high-sensitivity nodes for different accident severity levels were consistent. Furthermore, when targeting the critical factors identified earlier:
- The Capability Level (H3) was most sensitive to changes in Organizational Process (M3) and Technical Training (M1).
- The Power Subsystem (S1) was highly sensitive to the Cooling (S4), Electrical (S5), and Fuel (S3) subsystems.
- The Flight Control Subsystem (S6) showed high sensitivity to the Structure Subsystem (S2).
Based on the integrated findings from the Grey Relational Analysis, Bayesian Network inference, and Sensitivity Analysis, targeted safety recommendations can be formulated. The central role of human capability necessitates a strong focus on drone training programs. These programs must be rigorous, standardized, and include recurrent training on emergency procedures and decision-making under stress. The sensitivity of capability to organizational processes further mandates that companies establish clear, detailed, and validated operational checklists and workflows. On the technical side, preventive maintenance programs should prioritize the inspection of the power system’s supporting subsystems—cooling, electrical, and fuel systems—given their high sensitivity. Although structural failures are rare, their direct link to flight control system failures necessitates regular and thorough airframe inspections. Finally, robust supervision protocols are needed to monitor both human performance and maintenance quality, ensuring that drone training principles and safety procedures are consistently applied in daily operations.
In conclusion, the safety of large UAV operations is governed by a complex web of interacting factors. This research employed a probabilistic reasoning framework, combining Grey Relational Analysis and a Bayesian Network, to move beyond qualitative lists and towards a quantitative understanding of risk influence and causation. The model successfully identified Capability Level, Power System, and Flight Control System as the most probabilistically significant direct contributors to accidents. The critical influence of management factors, especially drone training and organizational processes, on human capability was clearly delineated. The derived sensitivity measures provide a clear priority for resource allocation in safety programs. By implementing the targeted recommendations—centered on enhanced drone training, meticulous maintenance, and robust processes—operators and regulators can proactively address the root causes of large UAV accidents, thereby significantly reducing their likelihood and severity.