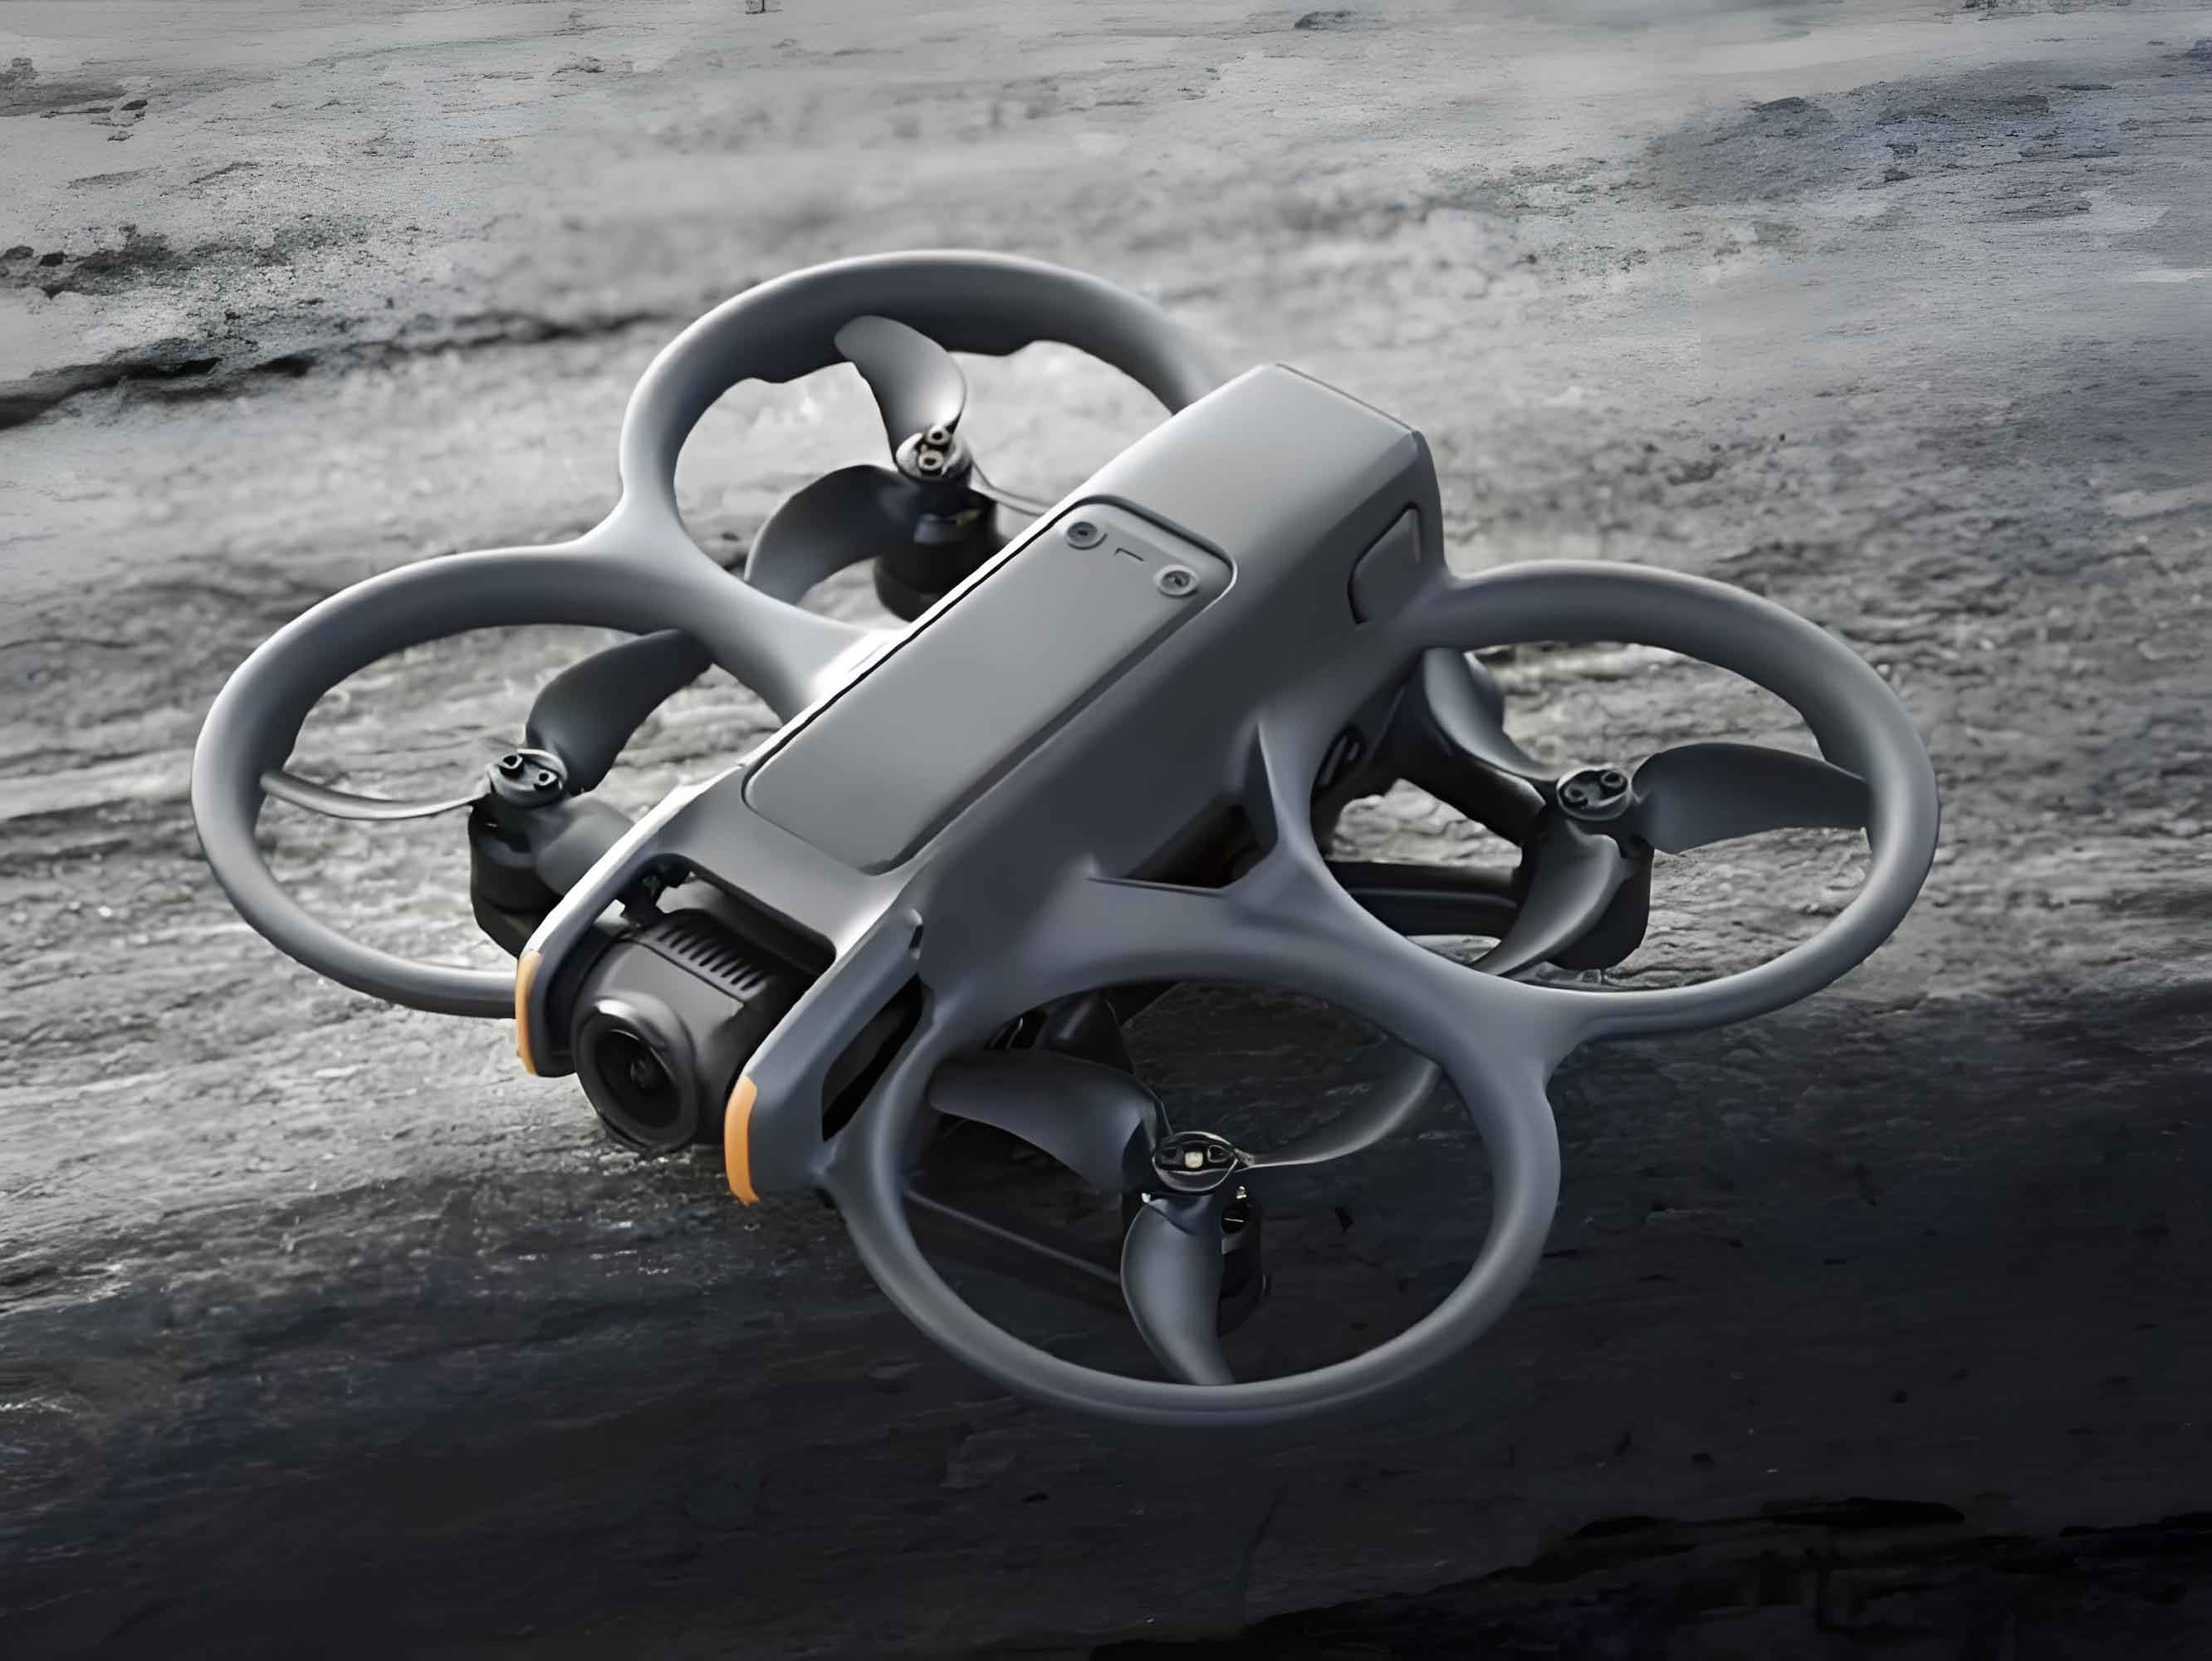
As the principal architect of this China UAV-integrated power distribution network operation and maintenance (O&M) system, I present a transformative solution addressing scalability and efficiency challenges in modern electrical grids. Our system synergizes autonomous drones, 5G connectivity, and deep learning to redefine grid management paradigms.

1. System Architecture
The China UAV-centric framework comprises three modules:
- Data Acquisition & Communication: UAVs equipped with multi-sensor payloads.
- Analytics & Diagnosis: AI-driven fault detection.
- O&M Task Management: Automated scheduling and execution.
Table 1: UAV Sensor Specifications
| Sensor | Parameters | Function |
|---|---|---|
| Zenmuse P1 Camera | 45MP, 8192×5460 resolution | Visible-light imaging |
| Zenmuse H20T Gimbal | 12MP wide-angle + 40MP zoom + 640×512 IR | Multispectral data fusion |
| RTK Positioning Unit | Horizontal: <1 cm; Vertical: <2 cm | Centimeter-accurate geotagging |
| LiDAR | 1200m range | 3D point cloud mapping |
Communication leverages 5G micro-cells and Huawei CPE Pro 2 routers, achieving:
- Throughput: 1.65 Gbps
- Latency: <10 ms
- Data registration accuracy: 0.05 m
2. AI-Driven Diagnostics
2.1 Defect Identification Pipeline
- Semantic Segmentation (DeepLabV3+):
- Isolates components (insulators, arresters) with 95% accuracy.
IoU=Target∩PredictionTarget∪PredictionIoU=Target∪PredictionTarget∩Prediction
- Isolates components (insulators, arresters) with 95% accuracy.
- Fault Classification (ResNet-50):
- Detects 10 defect types (e.g., contaminated insulators, conductor damage) at 98% accuracy.
Table 2: Defect Diagnosis Performance
| Defect Type | Precision | Recall | F1-Score |
|---|---|---|---|
| Insulator Contamination | 0.97 | 0.98 | 0.975 |
| Arrester Degradation | 0.99 | 0.96 | 0.974 |
| Conductor Damage | 0.96 | 0.97 | 0.965 |
2.2 Health Index Quantification
Device condition is evaluated via:
H=∑i=1nwi⋅(1−pi)H=∑i=1nwi⋅(1−pi)
where:
- wiwi = Expert-assigned severity weight (0–1)
- pipi = Defect probability from ResNet-50
- nn = Number of defect types
3. Intelligent O&M Scheduling
The task manager solves combinatorial optimization using Google OR-Tools:
- Objective: Minimize response time and resource idle rate.
- Constraints:
- Technician skillsets
- Equipment criticality
- Spatiotemporal dependencies
- Output: Pareto-optimal task sequences.
Table 3: Operational Metrics vs. Traditional Methods
| Metric | China UAV System | Manual O&M | Improvement |
|---|---|---|---|
| Inspection Rate (devices/day) | 40 | 20 | 100% |
| Fault Detection Rate | 95% | 79.7% | +15.3 pp |
| Diagnosis Accuracy | 98.2% | 89.5% | +8.7 pp |
| Response Time (mins) | 22 | 75 | 70.7% ↓ |
| System Uptime | 99.5% | 98.1% | +1.4 pp |
4. Experimental Validation
A 31-day field trial covered 50 km² of 10kV infrastructure (100 towers, 5 transformers):
- UAV Group: Matrice 300 RTK with 5G real-time streaming.
- Control Group: Manual inspection + 4G reporting.
Key outcomes validate the China UAV approach:
- Faults undetectable visually (e.g., internal arrestor failures) were identified via thermal anomalies.
- Dynamic replanning during storms reduced inspection delays by 63%.
5. Technological Edge
Our China UAV ecosystem excels through:
- Adaptive Autonomy: Self-adjusting flight parameters for turbulence/obstacles.
- Multi-Sensor Fusion: Co-registered RGB, IR, and LiDAR data via Kalman filtering:
x^k=Fkx^k−1+Bkukx^k=Fkx^k−1+Bkuk - Edge Computing: NVIDIA Jetson AGX Xavier processes terabytes onboard.
6. Future Trajectory
Next-phase integration of digital twins and edge AI will enable:
- Predictive maintenance via recurrent neural networks (RNNs).
- Swarm coordination for large-scale disaster response.
- Blockchain-audited task logs.
7. Conclusion
This China UAV-powered system elevates grid resilience by merging robotic mobility, ultrafast connectivity, and deep learning. Our results demonstrate unequivocal superiority in speed, accuracy, and cost-efficiency—setting a benchmark for next-gen smart infrastructure. As grids expand globally, this framework offers a scalable blueprint for sustainable energy management.
