
Our study investigates the impact of China drone-based crop protection technology on farmers’ income growth using provincial panel data from 2005 to 2023. By employing a two-way fixed effects model, we systematically examine the direct income effect, underlying mechanisms, and spatial spillover effects. The findings reveal that China drone technology significantly boosts farmers’ income both contemporaneously and inter-temporally, with income gains of 10.97% and 10.05%, respectively. This positive effect remains robust across various sensitivity checks. Heterogeneity analysis shows that the income-enhancing effect is more pronounced for wage income, net operating income, and regions with higher cash crop shares. Mechanism tests indicate that China drone technology indirectly promotes farmers’ income by enhancing capability adaptation—namely improving information access and risk-bearing capacity—and by expanding service-based income channels. Spatial analysis further demonstrates that farmers’ income exhibits significant positive spatial autocorrelation and clustering. The empowerment from China drone technology not only raises local farmers’ income but also generates notable spatial spillover effects, driving synchronous income growth in economically and geographically neighboring areas. These findings highlight the importance of establishing a bidirectional feedback mechanism between technology promotion and agricultural production, implementing region-specific strategies, and strengthening regional coordination to equitably distribute the dividends of China drone technology.
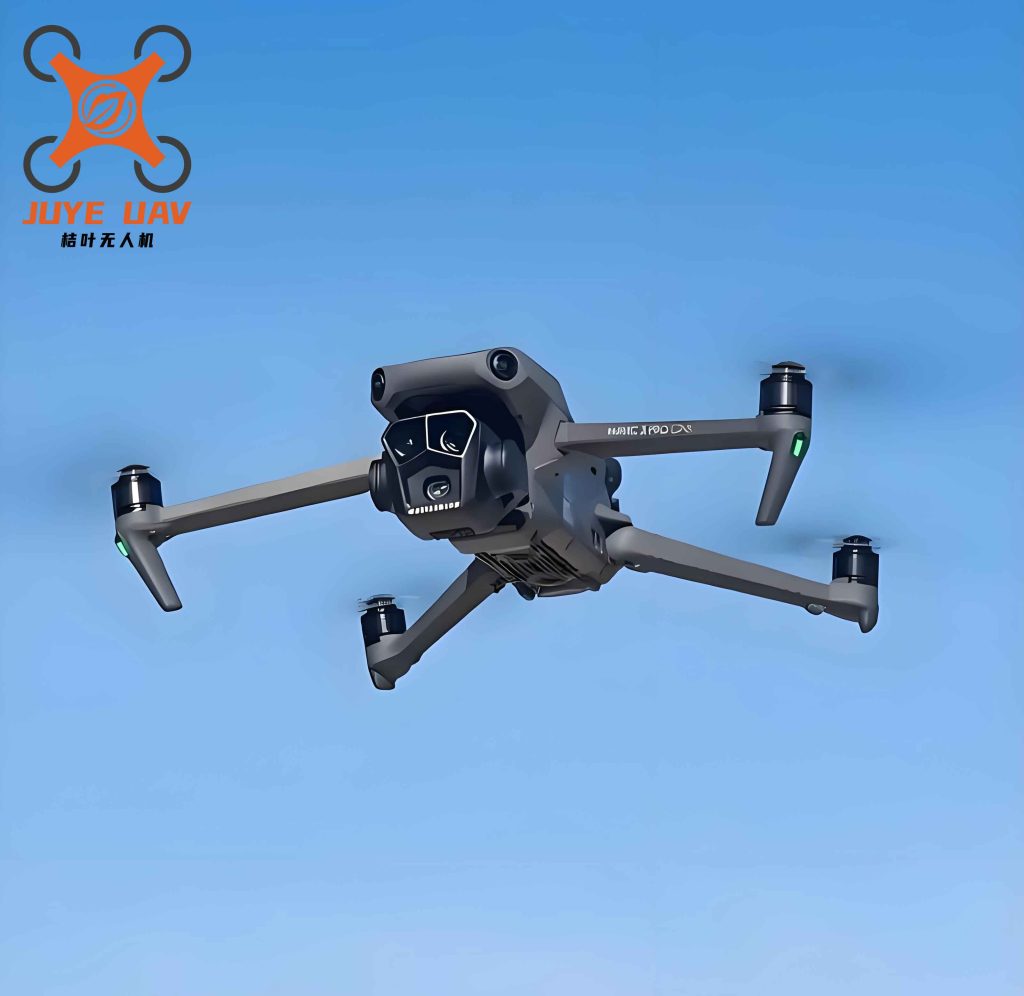
In recent years, the integration of digital technologies into agricultural production has accelerated globally, with China drone technology emerging as a transformative tool in crop protection. The rapid adoption of unmanned aerial vehicles (UAVs) for pesticide application, disease monitoring, and precision agriculture has reshaped traditional farming practices. However, the extent to which this technology translates into tangible income gains for farmers, and the channels through which such gains are realized, remains underexplored. Our research aims to fill this gap by analyzing the economic impacts of China drone technology on rural households, focusing on both immediate and long-term income effects, as well as the spatial diffusion of these benefits.
Drawing on the theory of induced technological change, we argue that rising labor costs and labor shortages in rural China create a strong demand for labor-saving technologies like UAVs. China drone technology substitutes for manual labor in pest control, reduces production risks, and improves operational efficiency. Our empirical analysis is based on a balanced panel of 30 provinces in China from 2005 to 2023, using data from the China Machinery Industry Statistics Yearbook, the China Rural Statistical Yearbook, and the China Meteorological Yearbook. The core explanatory variable is the logarithm of total area treated by agricultural aircraft (including UAVs), which proxies for the intensity of China drone technology adoption. We control for a comprehensive set of factors including agricultural structure, scale, socialized services, fiscal support, labor input, education, and climate variables.
We construct the following two-way fixed effects baseline model:
$$ \ln Income_{it} = \alpha_1 + \alpha_2 \ln DCPT_{it} + \phi_1 Controls_{it} + \sigma_i + \mu_t + \varepsilon_{it} $$
where lnIncome is the natural logarithm of rural per capita disposable income, lnDCPT is the logarithm of China drone crop protection intensity (area sprayed), Controls is a vector of covariates, and σi and μt are province and year fixed effects, respectively. The coefficient α2 is our main interest.
To explore mechanisms, we adopt the mediation approach proposed by Wen and Ye (2014). The mechanism variables include information acquisition capability (log of rural broadband users), risk-bearing capacity (log of farmers’ fixed asset investment), and service income expansion (log of gross output of agriculture, forestry, animal husbandry, and fishery services). The mediation models are specified as:
$$ Mech_{it} = \beta_1 + \beta_2 \ln DCPT_{it} + \phi_2 Controls_{it} + \sigma_i + \mu_t + \varepsilon_{it} $$
$$ \ln Income_{it} = \gamma_1 + \gamma_2 \ln DCPT_{it} + \gamma_3 Mech_{it} + \phi_3 Controls_{it} + \sigma_i + \mu_t + \varepsilon_{it} $$
For spatial spillover analysis, we employ the spatial Durbin model (SDM) with province and year fixed effects, using four types of spatial weight matrices: binary contiguity (W1), economic distance based on GDP per capita (W2), inverse geographic distance squared (W3), and nested economic-geographic distance (W4). The SDM is specified as:
$$ \begin{aligned} \ln Income_{it} &= \alpha + \rho \sum_{j} w_{ij} \ln Income_{jt} + \beta_1 \ln DCPT_{it} + \beta_2 X_{it} \\ &+ \theta_1 \sum_{j} w_{ij} \ln DCPT_{jt} + \theta_2 \sum_{j} w_{ij} X_{jt} + \mu_i + \gamma_t + \varepsilon_{it} \end{aligned} $$
Table 1 presents the descriptive statistics of key variables over the 570 province-year observations.
| Variable | Definition | Mean | Std. Dev. |
|---|---|---|---|
| Farmers’ income level | Log of rural per capita disposable income | 9.138 | 0.674 |
| China drone usage intensity | Log of agricultural aircraft operation area (ha) | 3.959 | 3.008 |
| Information acquisition capability | Log of rural broadband subscribers | 2.415 | 3.319 |
| Risk-bearing capacity | Log of farmers’ fixed asset investment | 5.147 | 1.172 |
| Service income expansion | Log of agricultural service output value | 4.219 | 1.414 |
| Agricultural restructuring | 1 – (agricultural output / total output) | 0.475 | 0.086 |
| Agricultural scale | Sown area / rural population | 2.860 | 1.965 |
| Socialized service level | Agricultural service output / sown area | 0.414 | 0.399 |
| Fiscal support for agriculture | Agricultural expenditure / total fiscal expenditure | 0.107 | 0.035 |
| Labor input | Log of primary industry employment | 6.240 | 1.115 |
| Education level | Average years of schooling | 9.007 | 1.053 |
| Average relative humidity | Annual average relative humidity of major cities | 4.174 | 0.165 |
| Annual sunshine hours | Annual sunshine hours of major cities | 7.563 | 0.299 |
The baseline regression results are reported in Table 2. Column (1) and (2) show the contemporaneous effect; columns (3) and (4) show the one-year lagged effect. Regardless of control variables, the coefficient of China drone intensity is positive and significant at the 1% level, indicating that a 1% increase in China drone technology usage leads to approximately 0.010% to 0.012% increase in farmers’ income. The lagged effect is similarly strong, confirming the persistence of the income gain.
| Variable | (1) Current effect | (2) Current effect | (3) Lag effect | (4) Lag effect |
|---|---|---|---|---|
| China drone usage intensity | 0.009*** (4.27) | 0.012*** (5.60) | 0.009*** (4.22) | 0.011*** (5.55) |
| Controls | No | Yes | No | Yes |
| Province fixed effects | Yes | Yes | Yes | Yes |
| Year fixed effects | Yes | Yes | Yes | Yes |
| Observations | 570 | 570 | 570 | 570 |
| Adjusted R² | 0.994 | 0.995 | 0.994 | 0.994 |
Note: t-statistics in parentheses. *** p<0.01, ** p<0.05, * p<0.1.
To address potential endogeneity, we instrument China drone technology usage with the interaction of provincial topographic relief and year. The first-stage F-statistic is 42.59, well above the conventional threshold, and the Kleibergen-Paap LM test rejects under-identification. The second-stage results (Table 3) confirm that the positive income effect remains significant at the 1% level, with a coefficient of 0.073, supporting the causal interpretation.
| Variable | (1) First stage: China drone | (2) Second stage: Income |
|---|---|---|
| IV: Topographic relief × Year | 0.013*** (6.53) | |
| China drone usage intensity | 0.073*** (6.46) | |
| Controls | Yes | Yes |
| Province/Year fixed effects | Yes | Yes |
| Observations | 570 | 570 |
| First-stage F-statistic | 42.59*** | |
| Kleibergen-Paap rk LM | 46.045*** | |
| Cragg-Donald Wald F | 45.588 |
Robustness checks include replacing the core explanatory variable with the ratio of China drone operation area to total sown area and with the number of agricultural aircraft. Both alternative proxies yield positive and significant coefficients (Table 4). Additionally, we winsorize the data at 1% and 3% levels; the results remain stable, affirming the robustness of our main finding.
| Variable | (1) Ratio | (2) Number | (3) Winsorize 1% | (4) Winsorize 3% |
|---|---|---|---|---|
| China drone area ratio | 0.009*** (4.08) | 0.012*** (5.89) | 0.009*** (3.70) | |
| China drone aircraft count | 0.021*** (8.82) | |||
| Controls | Yes | Yes | Yes | Yes |
| Province/Year fixed effects | Yes | Yes | Yes | Yes |
| Observations | 475 | 570 | 570 | 570 |
| Adjusted R² | 0.995 | 0.995 | 0.995 | 0.993 |
Heterogeneity analysis by income source (Table 5) reveals that China drone technology significantly boosts wage income and net operating income, while having no significant effect on property income or transfer income. This suggests that the technology primarily enhances earnings from productive labor and farming operations, rather than passive income sources.
| Variable | (1) Wage | (2) Operating | (3) Property | (4) Transfer | (5) Interaction |
|---|---|---|---|---|---|
| China drone usage intensity | 0.016*** (2.91) | 0.020*** (3.18) | -0.013 (-1.18) | 0.001 (0.06) | |
| Drone × Cash crop share | 0.022*** (7.03) | ||||
| Controls | Yes | Yes | Yes | Yes | Yes |
| Province/Year fixed effects | Yes | Yes | Yes | Yes | Yes |
| Observations | 570 | 570 | 570 | 570 | 570 |
| Adjusted R² | 0.981 | 0.935 | 0.924 | 0.935 | 0.995 |
Furthermore, the interaction term between China drone intensity and the share of cash crops in total sown area is positive and significant at the 1% level, indicating that regions with a higher proportion of cash crops benefit more from China drone technology. This is consistent with the fact that cash crops generally require more precise pest management and generate higher marginal returns from technology adoption.
Mechanism test results are presented in Table 6. Columns (1), (3), and (5) show that China drone technology significantly enhances information acquisition capability, risk-bearing capacity, and service income expansion. Columns (2), (4), and (6) demonstrate that when these mediators are included, the direct effect of China drone technology on income remains significant, but the mediator coefficients are also positive and significant, indicating partial mediation. Therefore, China drone technology boosts farmers’ income through two channels: (1) improving farmers’ capability to acquire information and bear risks; (2) expanding service-based income opportunities.
| Variable | (1) Info cap. | (2) Income | (3) Risk cap. | (4) Income | (5) Service | (6) Income |
|---|---|---|---|---|---|---|
| China drone intensity | 0.335*** (4.94) | 0.010*** (4.98) | 8.873*** (3.28) | 0.010*** (5.17) | 0.028** (2.33) | 0.010*** (4.75) |
| Info acquisition | 0.003** (2.04) | |||||
| Risk bearing | 0.000*** (5.93) | |||||
| Service expansion | 0.069*** (6.62) | |||||
| Controls | Yes | Yes | Yes | Yes | Yes | Yes |
| Province/Year fixed effects | Yes | Yes | Yes | Yes | Yes | Yes |
| Observations | 570 | 570 | 570 | 570 | 570 | 570 |
| Adjusted R² | 0.798 | 0.995 | 0.853 | 0.995 | 0.970 | 0.995 |
Turning to spatial effects, we first test for global spatial autocorrelation of farmers’ income. Table 7 reports Moran’s I for each year under four spatial weights. All values are positive and statistically significant at the 1% level, confirming strong spatial clustering of income levels across provinces.
| Year | W1 (Moran’s I) | W2 | W3 | W4 |
|---|---|---|---|---|
| 2005 | 0.581*** | 0.377*** | 0.454*** | 0.277*** |
| 2010 | 0.575*** | 0.369*** | 0.486*** | 0.279*** |
| 2015 | 0.591*** | 0.361*** | 0.515*** | 0.279*** |
| 2020 | 0.585*** | 0.368*** | 0.502*** | 0.278*** |
| 2023 | 0.584*** | 0.374*** | 0.500*** | 0.280*** |
Model selection tests (LM, LR, Wald, and Hausman) favor the spatial Durbin model with two-way fixed effects. Table 8 presents the SDM estimation results under the four weight matrices. The spatial autoregressive coefficient (rho) is positive and significant in all specifications, indicating that farmers’ income exhibits positive spatial dependence. The direct effect of China drone technology is positive and significant under W1, W2, and W4, confirming the local income-boosting role. More importantly, the indirect effect (spatial spillover) is positive and significant across all matrices, with magnitudes ranging from 0.022 to 0.112. This implies that a 1% increase in China drone technology usage in one province leads to a 0.022% to 0.112% increase in farmers’ income in neighboring or economically similar provinces.
| Variable | W1 | W2 | W3 | W4 |
|---|---|---|---|---|
| China drone intensity | 0.004 (1.23) | 0.012** (2.52) | 0.001 (0.45) | 0.011*** (2.60) |
| W × Drone intensity | 0.020*** (4.25) | 0.012 (1.59) | 0.020** (2.30) | 0.038*** (2.69) |
| rho | 0.367*** (4.30) | 0.287*** (2.64) | 0.430*** (3.75) | 0.569*** (5.53) |
| Direct effect | 0.006* (1.90) | 0.013** (2.56) | 0.003 (1.04) | 0.015*** (2.73) |
| Indirect effect | 0.032*** (4.09) | 0.022* (1.75) | 0.035*** (2.69) | 0.112* (1.86) |
| Total effect | 0.038*** (3.96) | 0.035** (2.18) | 0.038*** (2.79) | 0.127** (1.99) |
| Controls | Yes | Yes | Yes | Yes |
| Province/Year fixed effects | Yes | Yes | Yes | Yes |
| Observations | 570 | 570 | 570 | 570 |
| R² | 0.157 | 0.299 | 0.033 | 0.687 |
The spatial spillover mechanism can be understood through the lens of technology diffusion, information sharing, and factor mobility. When neighboring provinces adopt China drone technology more intensively, farmers in the focal province may observe higher yields and reduced costs, prompting imitation and adoption. Moreover, the development of drone service networks often crosses administrative boundaries, enabling farmers in adjacent areas to access shared equipment and expertise. The significant indirect effect under the economic-geographic nested weight matrix underscores the importance of both proximity and economic similarity in facilitating these spillovers.
Our findings contribute to the literature by extending the scope of agricultural technology impact studies from traditional inputs (e.g., irrigation, fertilization) to low-altitude intelligent equipment. Unlike previous work that focuses on micro-level adoption, we provide macro-level evidence on the income effects of China drone technology and uncover the dual mechanism of capability enhancement and income diversification. The spatial analysis further reveals that the benefits of China drone technology are not confined to adopting regions but radiate outward, underscoring the need for coordinated regional policies.
In conclusion, our study robustly demonstrates that China drone technology significantly empowers farmers’ income growth through direct productivity improvements and indirect mechanisms of capability adaptation and service income expansion, with substantial spatial spillover effects. These results have important policy implications. First, policymakers should accelerate the construction of a bidirectional feedback loop between technology promotion and agricultural production demands, ensuring that China drone technology evolves in tandem with real farming needs. Second, differentiated strategies should be implemented based on crop structure and income sources—prioritizing cash-crop regions and promoting wage- and operating-income-generating activities. Third, efforts to enhance farmers’ digital skills, risk resilience, and access to service-oriented income opportunities should be intensified. Finally, regional coordination mechanisms, including cross-provincial data sharing and technology diffusion platforms, are essential to harness the full potential of China drone technology and achieve balanced rural development across China.