
In the field of hydropower engineering, the instability and collapse of unstable rock masses on high-steep slopes pose a major geological hazard to both infrastructure and personnel. Traditional monitoring methods, such as manual inspection and crack gauges, suffer from limited coverage, low efficiency, and high risk. Although point-based sensors like GNSS and joint meters provide continuous accurate measurements, they are expensive and difficult to deploy over large areas, making it challenging to obtain the overall deformation field and the three-dimensional spatial distribution of cracks. In recent years, the integration of China UAV drones remote sensing with computer vision and deep learning has opened new pathways for slope crack monitoring. However, existing algorithms still struggle with recognizing fine and irregular cracks under complex backgrounds, automating the extraction of crack width variations, and achieving reliable multi-temporal image matching and numbering. To address these challenges, we developed an intelligent crack monitoring system that combines China UAV drones, an improved YOLO algorithm, and real-scene 3D modeling technology. This system provides a fully automated, replicable solution that does not rely on ground-based point sensors for monitoring unstable rock masses in hydropower stations.
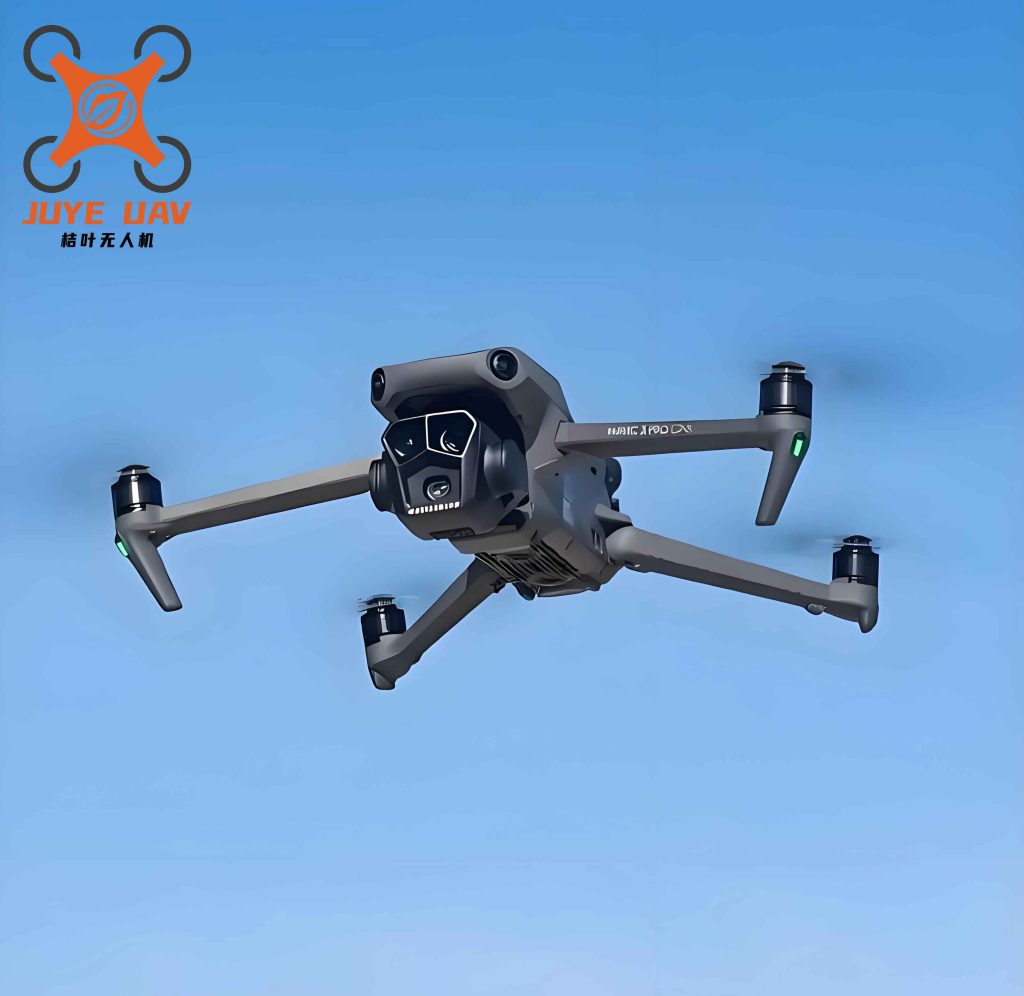
The system architecture follows a perception-cognition-decision framework with four layers. The perception layer utilizes an industrial-grade unattended airport to enable fully automated data collection. The data layer constructs centimeter-level real-scene 3D models via oblique photogrammetry. The cognition layer employs an improved YOLO algorithm for intelligent crack recognition and width variation extraction. The application layer provides 3D visualization and intelligent monitoring analysis functions. To achieve automated and refined inspection, we deployed a China UAV drone equipped with a 20‑megapixel visible light camera and a 12‑megapixel telephoto dual camera, along with a high-precision RTK module (horizontal accuracy ±1 cm, vertical accuracy ±2 cm). The unattended airport system is powered by solar and mains electricity, with an independent lightning rod, ensuring all-weather stable operation. Based on the real-scene 3D model, we planned optimal flight paths for each monitoring area. The camera is controlled by a three-axis stabilized gimbal to ensure that the optical axis is as perpendicular as possible to the slope surface, with the shooting angle deviation controlled within ±0.1°. For the B0, B4, and New Camp unstable rock areas, we adopted a strategy of area coverage, line proximity, and point verification, covering approximately 2 km² horizontally with an elevation difference of about 300 m, ensuring image overlap of at least 80%. The inspection scheme is summarized in the table below.
| Monitoring Area | Horizontal Coverage | Elevation Difference | Overlap Rate | Inspection Strategy |
|---|---|---|---|---|
| B0 Intake | ~0.7 km² | ~300 m | >80% | Area coverage + line proximity + point verification |
| B4 Spillway Tunnel | ~0.7 km² | ~300 m | >80% | Same as above |
| New Camp | ~0.6 km² | ~280 m | >80% | Same as above |
The core monitoring objective is the relative change (increment) in crack width. Unstable rock cracks appear in images as slender, irregular, and directionally varying linear features. Because the absolute width is affected by shooting angle and illumination, we model each crack as a thin elliptical region in image space. By extracting the short-axis pixel length and using precisely controlled camera poses and 3D models, we compute the relative width change between different periods. This method avoids the uncertainty of absolute width measurement and focuses on the trend, which is more indicative of engineering safety.
Our improved YOLO algorithm is built upon the YOLOv5s framework with two key modifications tailored to crack morphology:
- Reformulated loss function. The total loss \(L\) is decomposed as:
$$
L = L_c + L_o + L_b + L_a
$$
where \(L_c\) is classification loss, \(L_o\) is objectness loss, \(L_b\) is elliptical bounding box regression loss, and \(L_a\) is angular loss. Instead of traditional rectangular boxes, we model cracks as ellipses. The elliptical equation is:
$$
\frac{[(x – x_c)\cos\theta + (y – y_c)\sin\theta]^2}{a^2} + \frac{[(y – y_c)\cos\theta – (x – x_c)\sin\theta]^2}{b^2} = 1
$$
Here, \((x_c, y_c)\) are the center coordinates, \(a\) and \(b\) are the semi-major and semi-minor axes, and \(\theta\) is the orientation angle. The angular loss \(L_a\) constrains the prediction of crack orientation and is defined as:
$$
L_a = \text{SmoothL1Loss}\left( \min\left(|\phi_i – \phi_j|,\ \pi – |\phi_i – \phi_j|\right)\right)
$$
where \(\phi_i\) and \(\phi_j\) are the predicted and ground-truth angle parameters. The SmoothL1 function uses quadratic terms for small errors and linear terms for large errors, improving robustness in orientation regression.
- Width extraction method. The algorithm outputs the elliptical short-axis parameter \(b\), which represents the apparent crack width in the image plane. Using the collinearity equations of photogrammetry with known exterior orientation elements (ensured by RTK and gimbal control), we back-project the pixel coordinates to the real-scene 3D model to compute the width change sequence for each crack over time.
These improvements enable the system to detect fine cracks under complex backgrounds and extract width variations with high precision, laying the foundation for crack matching and numbering management.
The post-processing and matching pipeline consists of: (1) refining contours of initial detection boxes via grayscale segmentation and morphological operations; (2) manually classifying and numbering cracks from the first period (e.g., critical or general cracks) in the 3D platform; (3) in subsequent periods, using image matching algorithms based on SIFT features and spatial constraints to match newly detected cracks with the existing database; (4) automatically assigning a new number to unmatched cracks and adding them to the management library; and (5) mapping pixel measurements to real-world coordinates via 3D back-projection to produce width change sequences for each crack.
To train and validate the improved YOLO algorithm, we constructed a dataset of 12,000 crack images collected at the Luding Hydropower Station site. The dataset was split into training, validation, and test sets in an 8:1:1 ratio. The performance metrics on the test set are summarized in the table below.
| Metric | Improved YOLO | Baseline YOLOv5s |
|---|---|---|
| Precision (%) | 82.5 | 76.3 |
| Recall (%) | 78.1 | 67.2 |
| F1-Score | 0.803 | 0.715 |
| Detection rate for slender cracks (%) | 85.4 | 70.1 |
The improved algorithm shows a 15% increase in detection rate for slender, low-contrast cracks compared to the baseline. The algorithm’s detection results are reliably mapped onto the 3D model, as demonstrated by the projection of identified cracks onto the real-scene model, which confirms that the detected positions correspond accurately to the actual crack locations in three-dimensional space.
For the 3D modeling and monitoring platform, we employed oblique photogrammetry to build a centimeter-level real-scene 3D model with plane accuracy better than 2 cm and elevation accuracy better than 3 cm. The platform was developed based on WebGIS technology and integrates the following core functions:
- Full lifecycle management of cracks: automatic numbering, classification (e.g., critical, general), and attribute binding.
- Intelligent change detection and tracking: automatic identification of new cracks and tracking of width evolution trends for existing cracks.
- Monitoring analysis and risk assessment: threshold setting for cumulative width change and change rate, with high-light positions on the 3D scene when thresholds are exceeded.
- Interference handling: differentiation between transient texture changes (e.g., vegetation growth, rain wetting) and real crack expansion through multi-temporal comparison and seasonal pattern learning.
The system was deployed at the Luding Hydropower Station in Sichuan, China, covering three key monitoring areas: B0 intake, B4 spillway tunnel outlet, and New Camp. Approximately 200 high-precision artificial targets were placed as control and check points to provide an accurate baseline for projecting two-dimensional crack measurements onto the three-dimensional model.
From September 2025 to January 2026, the system completed 12 periodic inspections and several emergency inspections triggered by adverse weather, collecting more than 100,000 images. The 15-day periodic inspections were complemented by automatic emergency flights after heavy rainfall and strong winds, demonstrating the system’s robustness under complex climatic conditions.
The engineering application results are summarized as follows:
| Aspect | Performance |
|---|---|
| Automated inspection success rate | 100% (no manual intervention required) |
| Total cracks recognized and tracked | Over 3,500, with all critical cracks manually numbered and matched |
| Processing efficiency improvement | More than 20 times compared to manual interpretation |
| Width variation range (108 monitoring points, Dec 2025 – Jan 2026) | -0.4 mm to +0.6 mm (no sustained widening trend) |
| Overall stability assessment | Normal (no alarming trends) |
The continuous monitoring data from December 5, 2025 to January 6, 2026, covering 36 points in each of the three areas, showed that all crack width changes fluctuated within a small range (-0.4 to +0.6 mm) without a persistent expansion tendency. This indicates that the monitored unstable rock masses remained in a relatively stable phase under non-extreme conditions. The system successfully demonstrated its capability for long-term, continuous, automated quantitative monitoring and status assessment over a large area with multiple cracks.
In terms of management efficiency, the 3D platform enabled a “one-map” visualization of monitoring results, upgrading the traditional point-based monitoring mode to an area-wide perspective. This significantly improved the intuitiveness, collaboration, and decision-making efficiency of the monitoring workflow.
In conclusion, we have successfully developed and applied an intelligent crack monitoring system for unstable rock masses on high-steep slopes, leveraging China UAV drones, an improved YOLO algorithm, and real-scene 3D modeling. The system forms a complete technical chain from automated data acquisition to crack recognition, matching, change tracking, and visual analysis, thereby eliminating safety risks and reducing labor costs. Compared with traditional point-based sensor monitoring, this aerial solution offers wider coverage, flexible deployment, and no requirement for on-site personnel. The algorithm improvements, including elliptical bounding box regression loss and angular loss, effectively enhance the detection of fine, low-contrast cracks in complex backgrounds. The field application at Luding Hydropower Station verifies the system’s reliability, with 12 periodic inspections successfully completed and over 3,500 cracks tracked with numbered identification and continuous monitoring. This system provides an efficient, macroscopic intelligent monitoring and decision-support tool for slope safety management and has already demonstrated the potential to replace manual inspection and supplement point-based monitoring methods. Future work will focus on integrating ground sensor data, improving crack matching and prediction algorithms for intersecting and derived cracks, and standardizing the system architecture for broader deployment in hydropower infrastructure safety management, contributing to the intelligent transformation of engineering safety practices with China UAV drones.