
Unmanned Aerial Vehicle (UAV) remote sensing has become an indispensable technological solution for the rapid acquisition and real-time processing of spatial information in modern engineering. Compared to traditional satellite and manned aerial platforms, UAV drones offer unparalleled advantages in timeliness, operational flexibility, safety, high spatial resolution, and cost-effectiveness. These attributes have solidified their role as a primary tool for data collection in large-scale infrastructure projects, particularly railway survey and design. However, the practical application of imagery from UAV drones is often hampered by inherent platform limitations and environmental factors. The relatively small size and lower stability of UAV drones compared to manned aircraft can lead to motion blur and vibration artifacts. Furthermore, operations are frequently conducted under suboptimal weather conditions, such as haze, low-contrast lighting, or thin clouds. These factors collectively result in captured images that commonly suffer from degraded contrast, reduced clarity, and suppressed fine details, significantly increasing the difficulty of subsequent automated processing and manual interpretation, thereby limiting their direct utility in precision-demanding railway engineering tasks.
Therefore, developing fast and effective image enhancement techniques is of paramount practical importance for improving the efficiency of railway route investigation, optimizing design schematics, and ensuring the accuracy of derived products like digital surface models and orthomosaics. The core objective of image enhancement is to process an image so that the result is more suitable than the original for specific applications, be it visual analysis or machine-based algorithms. Common methods are broadly categorized into frequency-domain and spatial-domain techniques. While frequency-domain methods, such as high-pass or homomorphic filtering, operate on the image’s transform coefficients, spatial-domain methods manipulate pixel intensities directly. Among the latter, point operations like histogram modification and local statistical filters (e.g., Wallis filter) have been widely applied to aerial and satellite imagery. For instance, the Wallis filter is known to enhance texture and increase the number of reliable feature points for matching. However, a significant drawback of such methods is their tendency to produce over-enhancement and saturation effects, potentially introducing artifacts or losing information in highlight and shadow regions.
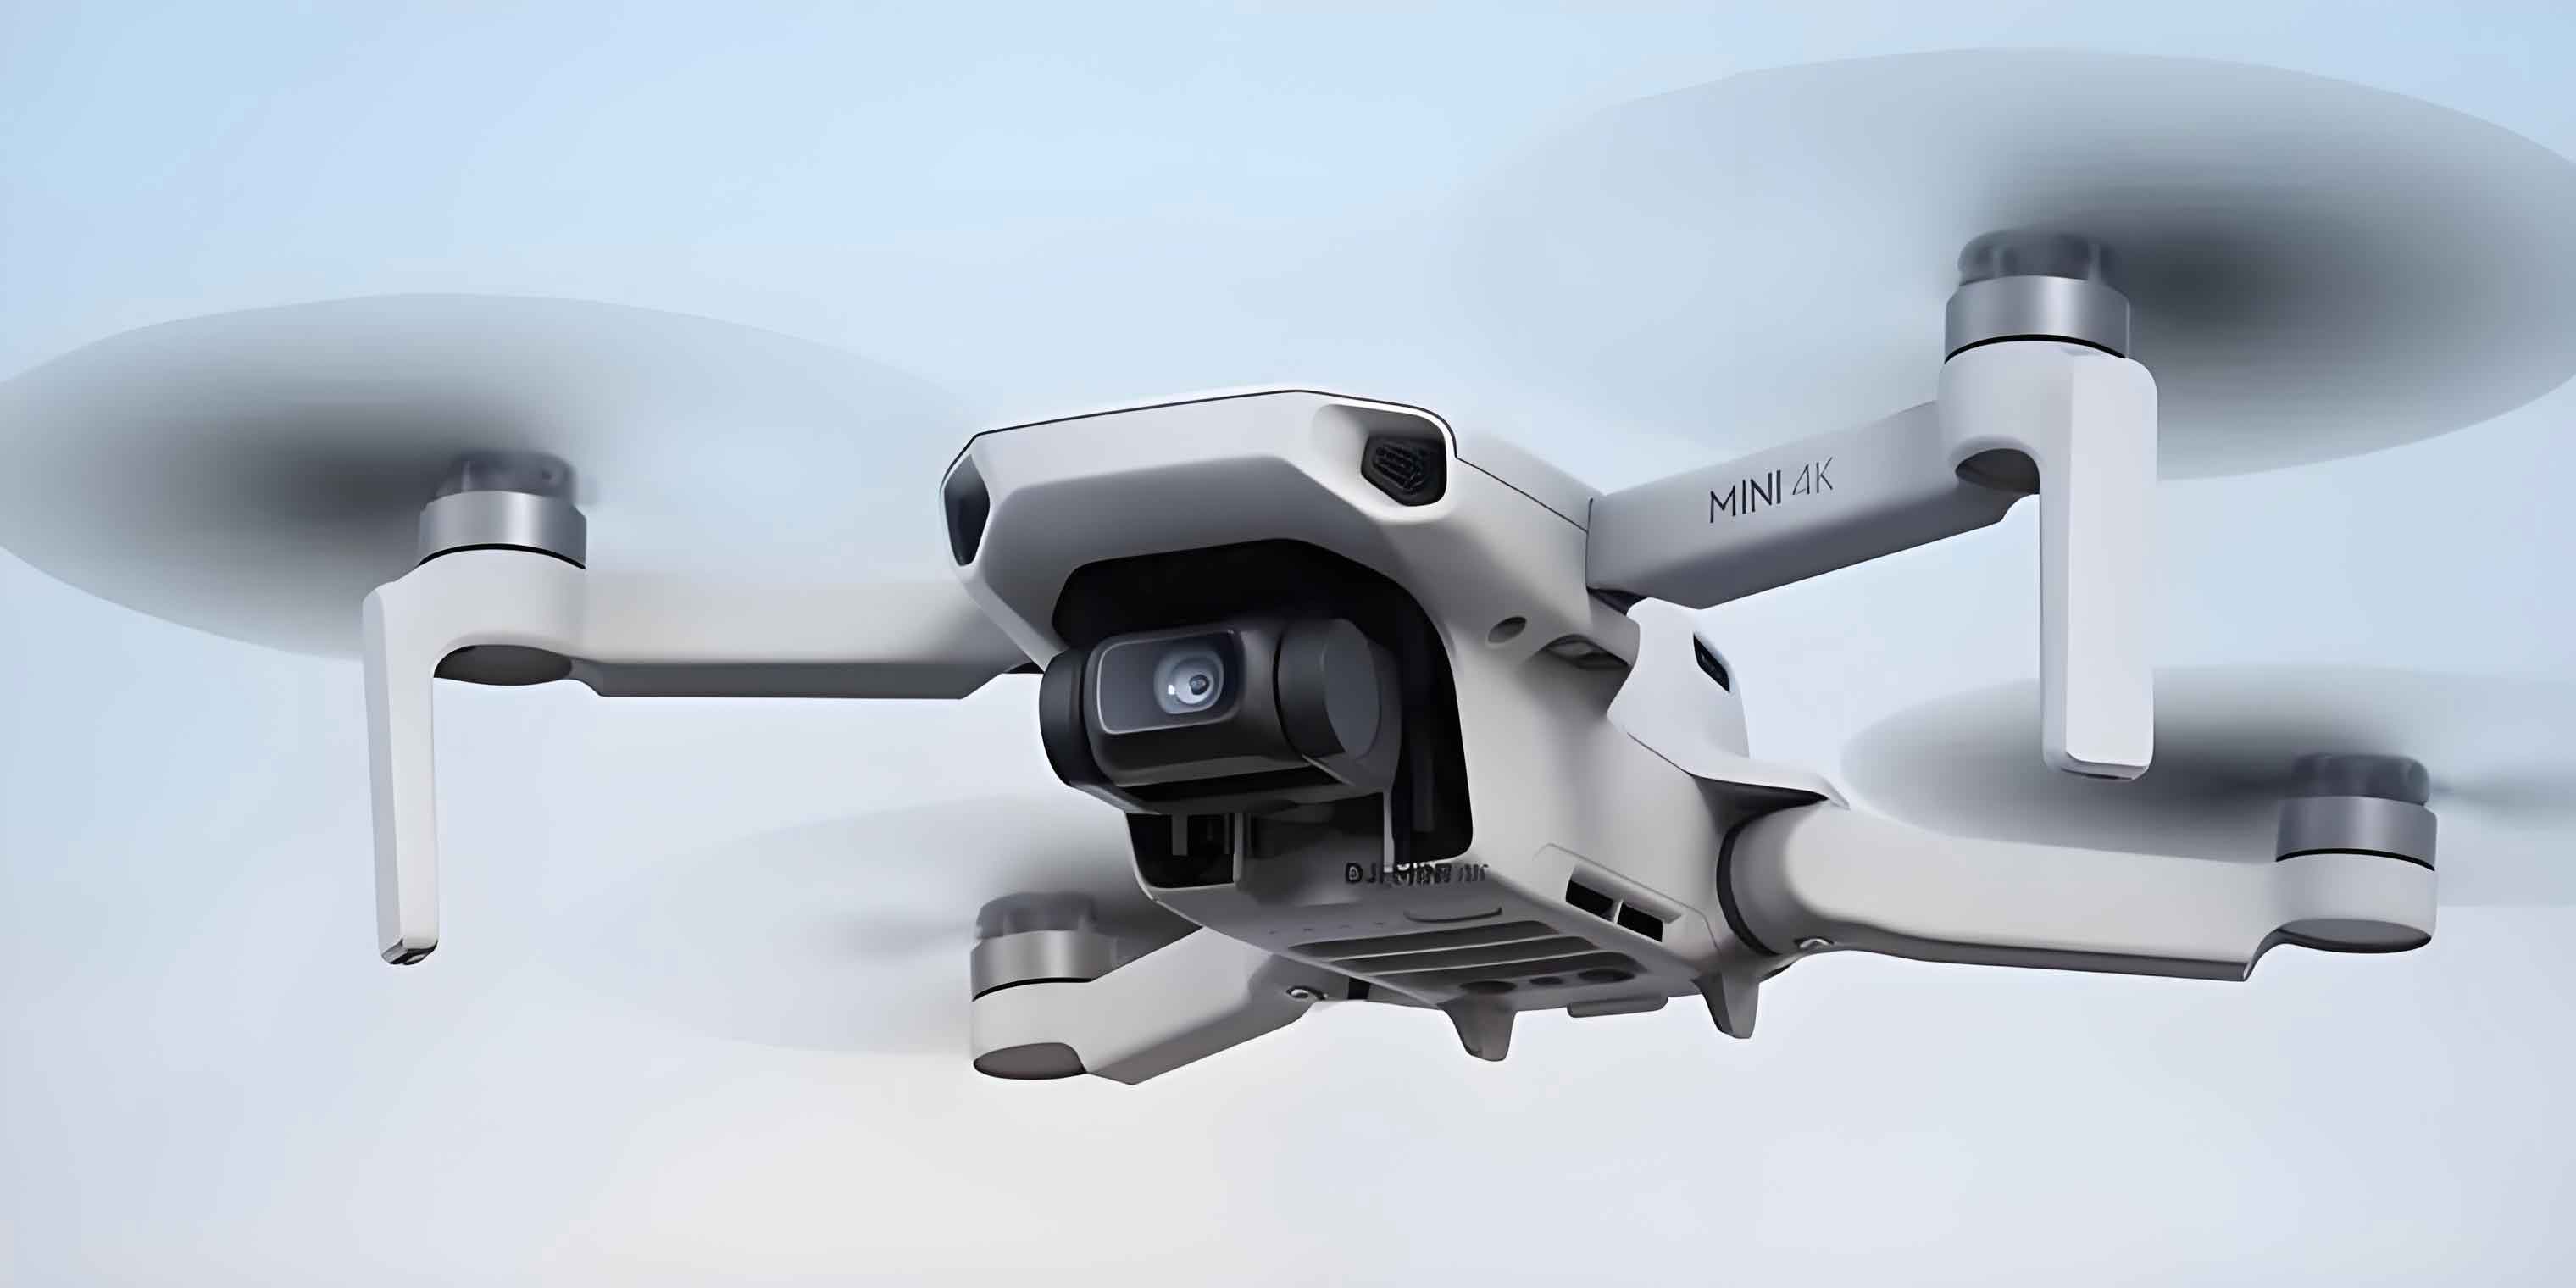
To address the prevalent issue of quality degradation in imagery from UAV drones, this paper proposes a novel enhancement algorithm that synergistically combines the principles of adaptive histogram matching and guided filtering. The proposed method is designed to be computationally efficient while robustly improving visual quality and algorithmic suitability for tasks like feature matching, which is fundamental for photogrammetric processing pipelines in railway survey. The core idea is to first expand the local dynamic range of the image to reveal subtle details, then employ a filter that can smooth noise while preserving and even sharpening edges, and finally recombine the components with emphasis on the enhanced details.
Theoretical Foundation: Guided Filtering
Guided filtering is a modern edge-preserving smoothing operator known for its effectiveness and computational efficiency. It has found applications in diverse fields such as stereo matching, image matting, and HDR tone mapping. The filter operates with three images: a guidance image \(I\), an input image \(p\), and the output filtered image \(q\). The guidance and input images can be identical.
The algorithm’s power stems from a local linear model. It assumes a linear relationship between the guidance \(I\) and the filtered output \(q\) within a local square window \(\omega_k\) centered at pixel \(k\) with radius \(r\):
$$q_i = a_k I_i + b_k, \forall i \in \omega_k$$
where \((a_k, b_k)\) are constant linear coefficients assumed within window \(\omega_k\).
These coefficients are determined by minimizing the difference between the filtered output \(q\) and the noisy input \(p\), subject to a regularization constraint:
$$E(a_k,b_k) = \sum_{i \in \omega_k} ((a_k I_i + b_k – p_i)^2 + \epsilon a_k^2)$$
Here, \(\epsilon\) is a regularization parameter preventing \(a_k\) from becoming too large. The solution to this ridge regression problem is:
$$
\begin{aligned}
a_k &= \frac{\frac{1}{|\omega|} \sum_{i \in \omega_k} I_i p_i – \mu_k \bar{p}_k}{\sigma_k^2 + \epsilon} \\
b_k &= \bar{p}_k – a_k \mu_k
\end{aligned}
$$
where \(\mu_k\) and \(\sigma_k^2\) are the mean and variance of \(I\) in \(\omega_k\), \(|\omega|\) is the number of pixels in the window, and \(\bar{p}_k\) is the mean of \(p\) in \(\omega_k\).
Since a pixel \(i\) is contained in multiple overlapping windows \(\omega_k\), its final output value \(q_i\) is computed by averaging all possible linear expressions for it:
$$q_i = \frac{1}{|\omega|} \sum_{k: i \in \omega_k} (a_k I_i + b_k) = \bar{a}_i I_i + \bar{b}_i$$
where \(\bar{a}_i\) and \(\bar{b}_i\) are the average coefficients over all windows covering pixel \(i\). This formulation leads to a weighted-sum expression, defining the kernel of the guided filter.
The edge-preserving property becomes clear when the guidance image is the input image itself (\(I = p\)). In this case, the coefficients simplify to:
$$
\begin{aligned}
a_k &= \frac{\sigma_k^2}{\sigma_k^2 + \epsilon} \\
b_k &= (1 – a_k) \mu_k
\end{aligned}
$$
Two key scenarios emerge:
- “High-variance” (Edge) Regions: Where \(\sigma_k^2 \gg \epsilon\), leading to \(a_k \approx 1, b_k \approx 0\), and thus \(q_i \approx p_i\). The filter does little smoothing, preserving edges.
- “Flat” Regions: Where \(\sigma_k^2 \ll \epsilon\), leading to \(a_k \approx 0, b_k \approx \mu_k\), and thus \(q_i \approx \mu_k\). The filter acts as an average smoother, effectively reducing noise.
This analysis indicates that enhancing the local variance (\(\sigma_k^2\)) of the input image prior to guided filtering can promote the edge-preserving behavior, selectively enhancing detailed areas.
Proposed Enhancement Algorithm for UAV Drones Imagery
The proposed algorithm is designed to tackle the low-contrast, hazy nature of images captured by UAV drones. It is a sequential three-step process, as summarized in the following table, which enhances local contrast, separates detail from base layers, and amplifies the detail component.
| Step | Objective | Key Operation | Output |
|---|---|---|---|
| 1 | Expand Local Dynamic Range & Contrast | Block-wise Adaptive Histogram Matching | Contrast-enhanced Image \(J\) |
| 2 | Separate Detail from Base Layer | Guided Filtering with \(I=J, p=I_{ori}\) | Base Layer \(q\) |
| 3 | Amplify Details | Linear Recombination: \(I_{enh} = \lambda(J – q) + q\) | Final Enhanced Image \(I_{enh}\) |
Step 1: Block-wise Adaptive Histogram Matching
The goal is to increase local contrast uniformly across the image. Direct global histogram equalization often over-enhances noise and creates unnatural artifacts. Our approach processes the original UAV image \(I_{ori}\) in non-overlapping blocks of size \(\delta \times \delta\) pixels. For each block \(\Omega_i\), we calculate its mean \(m_i\) and variance \(d_i^2\):
$$
\begin{aligned}
m_i &= \frac{1}{\delta^2} \sum_{(x,y) \in \Omega_i} f(x,y) \\
d_i^2 &= \frac{1}{\delta^2} \sum_{(x,y) \in \Omega_i} [f(x,y) – m_i]^2
\end{aligned}
$$
To prevent over-enhancement of already high-contrast blocks and to robustly enhance low-contrast ones, the target variance \(d’_i\) for histogram matching is adjusted:
$$ d’_i = \begin{cases} \tau, & \text{if } d_i < \tau \\ d_i, & \text{if } d_i \ge \tau \end{cases} $$
where \(\tau\) is an empirical threshold (e.g., between 40² and 70²).
Each block is then transformed via histogram matching. We use a Gaussian function as the target probability density function (PDF), with its mean set to the block’s original mean \(m_i\) and its variance to the adjusted value \(d’_i\):
$$ p_i(r) = \frac{1}{\sqrt{2\pi d’_i}} \exp\left( -\frac{(r – m_i)^2}{2 {d’_i}^2} \right) $$
where \(r\) is the gray level (0 to 255). This adaptive, block-wise process yields an intermediate image \(J\) with uniformly enhanced local contrast and preserved local mean, providing an ideal input for the subsequent guided filter by increasing variance in texture-rich areas.
Step 2: Guided Filtering for Detail-Base Separation
In this step, we use the contrast-enhanced image \(J\) as the guidance image \(I\) and the original UAV drones image \(I_{ori}\) as the input image \(p\). The guided filtering process, as described theoretically, is implemented efficiently using box-filter (mean filter) operations. The algorithm steps are as follows, where \(f_{mean}(\cdot)\) denotes a mean filter with window radius \(r\):
- Compute mean images: \( \mu_I = f_{mean}(I), \quad \mu_p = f_{mean}(p) \).
- Compute correlation images: \( corr_{II} = f_{mean}(I \cdot I), \quad corr_{Ip} = f_{mean}(I \cdot p) \).
- Compute variance of \(I\) and covariance of \(I\) and \(p\):
$$ \sigma_I^2 = corr_{II} – \mu_I \cdot \mu_I, \quad cov_{Ip} = corr_{Ip} – \mu_I \cdot \mu_p $$ - Compute linear coefficients \(a\) and \(b\):
$$ a = \frac{cov_{Ip}}{\sigma_I^2 + \epsilon}, \quad b = \mu_p – a \cdot \mu_I $$ - Compute mean coefficients: \( \bar{a} = f_{mean}(a), \quad \bar{b} = f_{mean}(b) \).
- Generate the filtered base layer: \( q = \bar{a} \cdot I + \bar{b} \).
The output \(q\) represents a smoothed version of the original image, where noise and small variations in flat areas are suppressed, but major edges (whose strength was increased in Step 1) are preserved. The detail layer is implicitly defined as the difference \((I – q)\) or \((p – q)\).
Step 3: Linear Recombination for Detail Enhancement
The final enhanced image \(I_{enh}\) is produced by amplifying the detail layer and adding it back to the base layer. Since we used \(J\) as the guide, the detail layer extracted is \(J – q\). The recombination is a simple linear operation:
$$ I_{enh} = \lambda (J – q) + q $$
where \(\lambda > 1\) is a detail amplification factor. This formulation effectively increases the weight of the high-frequency detail component, making textures and edges more pronounced in the final output suitable for analysis from UAV drones surveys.
Experimental Analysis and Application in Railway Context
To validate the effectiveness of the proposed algorithm for processing imagery from UAV drones in railway survey applications, we conducted two sets of experiments: one evaluating the enhancement of detail and texture information, and another assessing the improvement in a key photogrammetric task—image feature matching. Comparisons were made against the original images and results from the classical Wallis filter method.
Experiment 1: Enhancement of Detail and Texture
We used two real-world datasets captured by UAV drones during railway corridor surveys: the Yangqiaodian area (mountainous terrain) and the Pingdingshan area (urban/industrial terrain). Each dataset contained 5 images. The proposed method and the Wallis filter were applied. A qualitative visual assessment clearly shows that both methods improve overall clarity and contrast over the original UAV imagery. However, the proposed method demonstrates superior performance in rendering fine details, such as the edges of vegetation and structural textures, more naturally and sharply without the halo artifacts or over-saturation often seen with the Wallis filter.
For quantitative evaluation, we employed two metrics: Contrast (C) and Information Entropy (H). Contrast, calculated from the gray-level co-occurrence matrix (GLCM), measures local intensity variations, with higher values indicating sharper images. Information Entropy, defined as \(H = -\sum_{i=0}^{255} p_i \log_2 p_i\), measures the richness of information, where higher entropy suggests more detail.
The following table presents the average results for the five images in each UAV drones dataset:
| Dataset | Contrast | Information Entropy | ||||
|---|---|---|---|---|---|---|
| Original | Wallis | Proposed | Original | Wallis | Proposed | |
| Yangqiaodian | 20.70 | 41.01 | 45.71 | 6.69 | 7.62 | 7.79 |
| Pingdingshan | 28.48 | 42.35 | 43.11 | 6.70 | 7.56 | 7.74 |
The data confirms that both enhancement methods significantly improve the metrics over the original imagery captured by UAV drones. Crucially, the proposed method achieves higher values in both contrast and entropy for both terrain types, indicating its superior capability in enhancing texture details and informational content, which is vital for interpreting complex railway environments.
Experiment 2: Improvement in Image Feature Matching
Feature matching is a cornerstone of photogrammetric processing from UAV drones, enabling tasks like orientation, 3D reconstruction, and change detection. We evaluated matching performance on the Oxford benchmark datasets (Bikes, Trees) and our own UAV drones datasets. The SURF detector/descriptor was used for feature extraction and initial matching. For the Oxford datasets, correct matches were identified using the known ground-truth homography (reprojection error < 1 pixel). For the UAV datasets, geometric verification was performed using RANSAC to estimate the fundamental matrix and homography, with correct matches satisfying both epipolar and reprojection constraints.
The following table summarizes the matching results for the UAV drones datasets, showing the average number of correct correspondences per image pair and the average geometric precision (measured as distance to epipolar line). The Increase Ratio is calculated relative to the ‘No Enhancement’ baseline.
| Method | Yangqiaodian Dataset (Mountainous) | Pingdingshan Dataset (Urban) | ||||
|---|---|---|---|---|---|---|
| Correct Matches | Increase Ratio | Precision (pixels) | Correct Matches | Increase Ratio | Precision (pixels) | |
| No Enhancement | 2923 | 0% | 0.435 | 1667 | 0% | 0.288 |
| Wallis Filter | 5560 | 90.2% | 0.442 | 3860 | 131.6% | 0.283 |
| Proposed Method | 6972 | 138.5% | 0.441 | 5980 | 258.7% | 0.281 |
The results are striking. For the challenging mountainous UAV data, the proposed method yields 138.5% more correct matches than the unenhanced imagery and 25.4% more than the Wallis filter. The improvement is even more dramatic for the urban UAV drones dataset, with a 258.7% increase over the baseline and a 54.9% increase over the Wallis filter. Critically, this substantial boost in match quantity does not come at the cost of precision, which remains consistently high and even slightly improves. This demonstrates that the enhancement provided by our algorithm creates imagery from UAV drones that is not only visually better but also significantly more amenable to reliable automated processing, a key requirement for efficient railway survey pipelines.
Conclusion
This paper presented a novel and effective image enhancement method specifically tailored to address the common quality issues found in imagery acquired by UAV drones, with direct application to railway survey and design. The algorithm integrates adaptive block-wise histogram matching with guided filtering in a principled three-stage pipeline. The histogram matching pre-processing stage adaptively boosts local contrast, preparing the image for the guided filter which then expertly separates the scene into a smooth base layer and a detail layer. The final recombination step allows for controlled amplification of critical details. Experimental validation on real UAV drones survey data from both mountainous and urban railway corridors demonstrates that the proposed method surpasses the classical Wallis filter in both qualitative visual assessment and quantitative metrics (contrast and entropy). Most importantly, it dramatically improves the performance of downstream photogrammetric processes, such as feature matching, increasing the number of reliable correspondences by factors between 1.25 and 2.59 without compromising geometric precision. By transforming low-contrast, hazy UAV drones imagery into clear, detail-rich data, this enhancement technique unlocks greater value from UAV-based surveys, accelerating route planning, design optimization, and volumetric analysis in railway engineering projects. While currently implemented for grayscale images, the core methodology provides a strong foundation for extension to color imagery in future work.