
River channel surveying serves as a foundational element for hydraulic engineering planning, flood control design, and water resource management. The precision and efficiency of these surveys directly impact the scientific rigor of hydrological analysis and governance decisions. Traditional surveying methods, such as total station measurements and GPS point surveys, are often plagued by long operation cycles, high labor intensity, and limited coverage, struggling to meet the demands of complex terrains and dynamically changing environments. With the continuous advancement of low-altitude photogrammetry, UAV drone aerial survey technology has emerged as a potent technical solution in river mapping, leveraging its high resolution, rapid deployment, and three-dimensional modeling capabilities. UAV drone-based surveys enable large-scale, high-precision, and repeatable data acquisition for river channels, playing a crucial enhancement role in urban flood disaster mitigation and the construction of intelligent water resource management systems. This study constructs a comprehensive UAV drone aerial survey and modeling workflow, aiming to provide robust technical support for dynamic river monitoring, emergency response, and decision-making within key domains of smart cities like smart water conservancy and smart water affairs. Furthermore, it seeks to offer a reference for data fusion and real-time updates in future city-level intelligent water resource platforms.
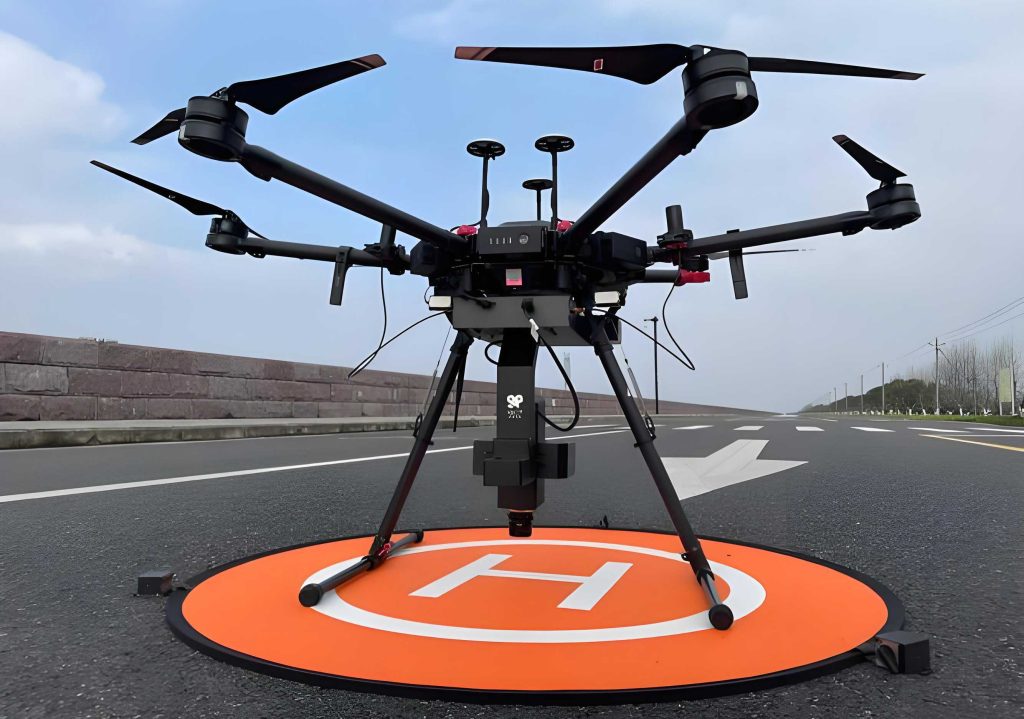
The implementation of UAV drone technology addresses a critical gap in modern surveying. This research details a systematic approach, from mission design to analytical output, demonstrating the adaptability and superiority of UAV drone platforms for hydrological applications. The core objective is to establish a replicable framework that balances high accuracy with operational efficiency, a balance often difficult to achieve with conventional tools.
To contextualize the technical requirements, it is essential to understand the typical challenges of riverine environments. The chosen study area represents a midsection of a river system characterized by transitional geomorphology between hills and alluvial plains. The channel exhibits a typical valley morphology, with variable width and a sinuous course. The riverbed substrate consists primarily of sand, gravel, and silty clay, with localized occurrences of sandbar accumulation and exposed bedrock, contributing to complex hydrodynamic conditions. In recent years, significant channel morphological changes have been observed, including cross-sectional siltation, disorderly widening, bank scour, and collapse. Existing monitoring, often reliant on sparse manual surveys, lacks the density and temporal frequency to dynamically reflect these topographical evolution processes. Therefore, there is an urgent need for a high-precision measurement system to achieve digital, three-dimensional, and time-series monitoring of river channels, a need perfectly suited for UAV drone deployment.
Technical Requirements and the Adaptability of UAV Drone Surveys
The specification of technical metrics is paramount for any surveying project. For river channel applications, the demands are particularly stringent due to the dynamic and often intricate nature of the terrain.
Accuracy and Density Specifications
The primary technical indicators revolve around the precision of cross-sections and longitudinal profiles. For a channel with a main channel width varying between approximately 20 and 70 meters and asymmetric bank slopes, cross-sectional measurements require elevation accuracy at the 0.1-meter level and horizontal resolution within 0.5 meters to accurately capture bed structure and bank profiles. The required measurement density is significantly higher than traditional standards. While conventional surveys may deploy 3 to 5 cross-sections per kilometer, the complex morphology addressed here necessitates a density of 7 to 10 cross-sections per kilometer. Within each cross-section, the spacing between elevation sample points should not exceed 1 meter to achieve high-resolution capture of micro-topographic details.
The overall vertical accuracy of an aerial survey can be estimated by considering the propagation of errors from various sources. A simplified error propagation model is given by:
$$ \sigma_h = \sqrt{ \sigma_p^2 + \sigma_g^2 + \sigma_m^2 } $$
where:
- $\sigma_h$ is the final elevation error.
- $\sigma_p$ is the image measurement error influenced by ground sampling distance (GSD) and platform attitude accuracy.
- $\sigma_g$ is the error associated with ground control points (GCPs).
- $\sigma_m$ is the model fitting error from aerial triangulation, which fluctuates with terrain complexity.
This formula underscores the need to control each error component meticulously when planning a UAV drone mission.
Comparative Adaptability Analysis
The suitability of UAV drone aerial survey becomes evident when contrasted with traditional techniques. The following table summarizes a comparative analysis of key performance indicators:
| Survey Method | Vertical Accuracy | Spatial Resolution / Data Type | Daily Productivity (per 2-person crew) | Coverage & Environmental Adaptability |
|---|---|---|---|---|
| RTK-GPS | ±2–3 cm | Discrete point data (5–10 m spacing) | ~2 km line survey | Limited to accessible points; weather-sensitive. |
| Total Station | ±2–3 cm | Discrete point data | < 2 km line survey | Highly terrain-dependent; requires line-of-sight. |
| Bathymetric Sonar | ±5–10 cm | Continuous underwater profile | Varies with vessel speed | Requires waterborne platform; limited to navigable waters. |
| UAV Drone Aerial Survey | ±5–10 cm | Continuous surface (GSD 2–5 cm) | 5–8 km² or 6–8 km river length | Wide area coverage; strong adaptability to complex terrain; cost-effective for large areas. |
As illustrated, while traditional methods like RTK offer slightly better point accuracy, the UAV drone excels in providing continuous, high-density spatial data over large areas with remarkable efficiency. This makes the UAV drone platform exceptionally suitable for applications requiring frequent, basin-scale monitoring or high-resolution digital modeling.
Design and Implementation of the UAV Drone Aerial Survey System
The successful application of UAV drone technology hinges on a meticulously designed and executed workflow. This section outlines the core components of the implemented system.
Platform Configuration and Intelligent Flight Planning
The survey utilized a multi-rotor UAV drone platform equipped with a high-resolution optical camera and an integrated RTK/INS navigation system. This setup, managed by a ground control system, enables autonomous mission planning, path optimization, and intelligent data management. A critical step is the design of the flight plan. The number of required flight lines is determined based on the channel width and the sensor’s footprint. The calculation is governed by:
$$ N = \left\lceil \frac{W + 2M}{w \cdot (1 – OL_s)} \right\rceil $$
where:
- $N$ is the number of flight lines.
- $W$ is the width of the survey corridor.
- $M$ is the boundary buffer (e.g., 20 m).
- $w$ is the ground coverage width of a single image.
- $OL_s$ is the side overlap ratio (set to 65%).
Forward overlap is controlled by the relationship between flight speed $v$, camera trigger interval $t$, and the ground distance $d$ covered between shots:
$$ d = v \cdot t $$
$$ OL_f = 1 – \frac{d}{L} $$
where:
- $OL_f$ is the forward overlap ratio (targeting 80%).
- $L$ is the ground coverage length of a single image.
For this mission, parameters were set as: flight height = 120 m, speed $v$ = 4.5 m/s, and interval $t$ = 2.5 s, resulting in $d \approx$ 11.25 m and achieving the desired 80% forward overlap. Each flight sortie covered approximately 0.4 km².
Ground Control and Georeferencing Strategy
Accurate georeferencing is vital for survey precision. An adaptive ground control point (GCP) layout strategy was employed, guided by pre-analysis of digital terrain data to ensure optimal distribution across areas of high relief and along the survey boundaries. The minimum number of GCPs was estimated using an empirical formula:
$$ N_c \geq 4 + \frac{A}{0.25} $$
where $N_c$ is the number of GCPs and $A$ is the survey area in km². This resulted in a density exceeding 8-10 GCPs per km². Each GCP consisted of a high-contrast target with a unique QR code for automated identification during processing. Coordinates for all GCPs were acquired using dual-frequency RTK-GNSS receivers, achieving horizontal errors ≤ ±1 cm and vertical errors ≤ ±2 cm.
Data Acquisition and Quality Assurance
The data acquisition process was managed through a standardized digital log system, recording flight times, sortie IDs, GCP information, and environmental parameters like wind speed and illumination. An intelligent flight monitoring module was implemented to handle anomalies. In case of signal loss, low battery, or obstructions, the UAV drone would automatically execute a “hover-return-resume” protocol, with the system logging the breakpoint and planning a补拍 path to ensure continuous photographic coverage. This robust procedure guarantees data integrity.
Data Processing and Terrain Modeling Workflow
Post-flight processing transforms the collected UAV drone imagery into accurate topographic products. The pipeline consists of several automated and optimized stages.
Preprocessing and Aerial Triangulation
Upon completion of the UAV drone sortie, all images undergo an automated quality assessment. Images are filtered based on metrics like edge gradient entropy (blur detection), histogram analysis (exposure issues), and attitude deviation checks. Substandard images are flagged and excluded to enhance processing stability. Subsequent processing utilizes Structure-from-Motion (SfM) and Multi-View Stereo (MVS) algorithms within specialized software. The workflow begins with feature extraction (e.g., using SIFT or SURF algorithms) to find matching points across overlapping UAV drone images. Bundle Adjustment with ground control points is then performed to solve for precise camera positions and orientations, minimizing reprojection errors. The mathematical optimization refines the parameters $\mathbf{P}_j$ (camera poses) and $\mathbf{X}_i$ (3D point locations) by minimizing:
$$ \sum_{i=1}^{n} \sum_{j=1}^{m} v_{ij} \, d(\mathbf{Q}(\mathbf{P}_j, \mathbf{X}_i), \mathbf{x}_{ij})^2 $$
where $d(\cdot)$ is the distance between the projected 3D point $\mathbf{Q}$ and the observed image point $\mathbf{x}_{ij}$, and $v_{ij}$ is a visibility indicator. This step outputs a sparse point cloud and refined exterior orientation parameters for every UAV drone image frame.
Dense Cloud Generation and DEM/DSM Production
Using the calibrated camera parameters, a dense point cloud is reconstructed via MVS algorithms. The point density is adaptively adjusted based on GSD and overlap, often exceeding 500 points per square meter. Automated filtering techniques, such as Cloth Simulation Filtering (CSF), are applied to classify ground points and remove noise (e.g., vegetation, artifacts). The classified ground points are then used to generate a Digital Terrain Model (DTM or bare-earth DEM), while all points contribute to a Digital Surface Model (DSM). Interpolation methods, like Triangular Irregular Network (TIN) creation followed by rasterization, produce the final gridded elevation models. For this study, the DEM was produced with a spatial resolution of 0.1 m. All spatial data is transformed from the WGS84 geographic coordinate system to a national projected coordinate system (e.g., using a Gauss-Krüger projection) via standard transformation functions $T$:
$$ (X, Y)_{projected} = T(Lat, Lon)_{WGS84} $$
Channel Feature Extraction
From the high-resolution DEM, channel cross-sections and longitudinal profiles are extracted automatically within a GIS environment. Cross-section lines are defined perpendicular to the channel centerline at regular intervals (e.g., every 50 m). The elevation $z$ for any point $i$ along a section is extracted directly from the DEM:
$$ z_i = \text{DEM}(x_i, y_i), \quad i = 1, 2, \dots, N $$
where $(x_i, y_i)$ are the coordinates of the $N$ sample points along the section. Similarly, the longitudinal profile is derived from the elevation of the thalweg points. These extracted geometries form the basis for quantitative hydraulic and geomorphic analysis.
Performance Analysis and Application Results
The efficacy of the UAV drone-based approach was validated through comparative analysis with traditional surveying and through temporal change detection.
Comparative Validation with RTK Surveying
A direct comparison was conducted on five representative cross-sections within the study area. Both UAV drone-derived elevations and RTK-measured point elevations were obtained for these sections. The root mean square error (RMSE) was calculated to quantify vertical agreement. The operational efficiency was also recorded. The results are consolidated in the following table:
| Metric | RTK Survey Method | UAV Drone Aerial Survey Method |
|---|---|---|
| Vertical Accuracy (RMSE) | ±2.5 cm | ±4.8 cm |
| Spatial Data Type | Discrete points (5-10 m spacing) | Continuous surface (GSD ~2.5 cm) |
| Operational Efficiency (Line survey per day per 2-person crew) |
Approximately 2 km | 6 to 8 km |
| Areal Coverage Efficiency (Area per day per 2-person crew) |
Not applicable (point-based) | 6 to 8 km² |
The analysis confirms that while the UAV drone survey exhibits a slightly lower point-wise vertical accuracy compared to RTK, the difference remains within acceptable limits for most engineering applications (e.g., ±5 cm). Crucially, the UAV drone method provides a continuous, high-resolution topographic surface rather than sparse points, and it achieves a 3-4 times higher linear survey efficiency. This demonstrates the compelling trade-off: accepting a modest, controllable reduction in absolute point accuracy to gain orders-of-magnitude improvement in data density and survey speed. The UAV drone platform is therefore ideal for creating comprehensive baseline maps and monitoring changes over extensive river reaches.
Channel Deformation and Sediment Analysis
One of the most powerful applications of UAV drone technology is repeat surveying for change detection. Elevation models from two surveys conducted at different times (T1 and T2) were compared using a simple differencing algorithm:
$$ \Delta z(x, y) = \text{DEM}_{T2}(x, y) – \text{DEM}_{T1}(x, y) $$
A positive $\Delta z$ indicates deposition, while a negative value indicates erosion. The raster difference map was analyzed, and key changes along specific cross-sections were quantified. The following table presents results from five selected cross-sections, illustrating the spatial pattern of change:
| Section ID | Mean $\Delta z$ (m) | Maximum Deposition (m) | Maximum Erosion (m) | Dominant Change Characteristic |
|---|---|---|---|---|
| S1 | +0.18 | +0.35 | -0.22 | Deposition on left bank, scour on right bank. |
| S2 | -0.07 | +0.12 | -0.31 | Overall channel bed scour dominant. |
| S3 | +0.22 | +0.41 | -0.15 | Significant point bar accumulation. |
| S4 | -0.04 | +0.08 | -0.19 | Localized, mild scour. |
| S5 | +0.11 | +0.25 | -0.10 | Minor thalweg aggradation. |
The difference analysis clearly reveals the migration and redistribution of sediments. For instance, Section S1 shows deposition on the left side and erosion on the right, suggesting a potential shift in the main thalweg. Section S3 exhibits substantial localized deposition, likely associated with a developing point bar. These insights, derived efficiently from UAV drone data, demonstrate a strong capability for monitoring hydromorphological evolution and can directly inform targeted river management and restoration strategies.
Conclusion
This study has presented and validated a comprehensive technological framework for river channel surveying based on UAV drone aerial survey systems. The developed workflow encompasses intelligent mission planning for the UAV drone, rigorous ground control, robust data acquisition protocols, and an automated processing pipeline yielding high-resolution digital elevation models and derived channel geometries. The comparative analysis substantiates that UAV drone-based surveys offer a superior balance between accuracy, spatial coverage, and operational efficiency compared to traditional point-based methods like RTK-GPS. While the absolute vertical accuracy of a UAV drone survey may be marginally lower, the benefit of obtaining a continuous, centimeter-resolution terrain model over kilometers of river in a single day is transformative. Furthermore, the application of repeat UAV drone surveys for change detection quantitatively revealed channel migration and sediment dynamics, showcasing the technology’s potent capacity for monitoring hydrological and geomorphological processes. The integration of UAV drone platforms into routine surveying practice provides a powerful data foundation for the digitalization and intelligent management of water resources. It enables dynamic, three-dimensional, and frequent assessment of river systems, which is critical for informed decision-making in flood risk management, ecosystem restoration, and sustainable water governance. Future work will focus on integrating UAV drone data with other sensing modalities and streamlining processing for real-time or near-real-time applications in smart city operational centers.