The leaf area index (LAI), defined as the total one-sided leaf area per unit ground surface area, is a fundamental biophysical parameter in agro-ecosystems. It serves as a critical proxy for plant growth status, photosynthetic capacity, and ultimately, yield potential. Accurate, timely, and spatially explicit estimation of LAI is therefore paramount for precision agriculture, enabling informed decisions on irrigation, fertilization, and pest management. Traditional field methods for measuring LAI, such as direct harvesting or using instruments like the LAI-2200 plant canopy analyzer, are inherently point-based, labor-intensive, and destructive, making them impractical for large-area monitoring.
The advent of unmanned aerial vehicle (UAV) technology has revolutionized agricultural remote sensing. UAV drones offer unparalleled flexibility, high spatial resolution, and the ability to operate under cloud cover, providing a cost-effective platform for frequent field monitoring. When equipped with advanced sensors like hyperspectral imagers, a UAV drone becomes a powerful tool for capturing detailed spectral information across hundreds of narrow, contiguous bands. This hyperspectral data contains rich fingerprints of plant physiology and structure, far beyond the capabilities of standard RGB or multispectral cameras.
This capability is particularly valuable in unique agricultural settings like the “Nanfan” breeding region in South China. Here, crops like maize are grown during the winter season to accelerate breeding cycles. The pollination stage of maize is a phenologically critical window, lasting only 5-8 days, which largely determines kernel set and final yield. Monitoring LAI during this brief period is essential for assessing breeding material performance and managing crop health. The complex canopy structures and diverse genetic materials in such breeding plots present a significant challenge for accurate LAI estimation, one that hyperspectral sensing from a UAV drone is well-suited to address.
The core objective of this research is to develop and evaluate robust methods for inverting maize LAI at the pollination stage using hyperspectral data collected by a UAV drone. We focus on comparing the performance of various predictive modeling approaches, from traditional empirical regressions to modern machine learning algorithms, to identify the most reliable and accurate inversion framework.
Methodology: From UAV Flight to Predictive Models
The study was conducted in a maize breeding base located in Ledong County, Hainan Province, a core area for Nanfan breeding. Data acquisition synchronized UAV-based remote sensing with ground-truth measurements.
1. Ground-Truth LAI Measurement:
Leaf Area Index was measured on the ground using an LAI-2200C plant canopy analyzer. A total of 116 sample plots were established across multiple breeding trial fields. Within each plot, one above-canopy reading and four below-canopy readings were taken and averaged to compute the LAI value, ensuring measurements were conducted under diffuse light conditions (dawn or dusk) to minimize error.
2. UAV-Based Hyperspectral Data Acquisition:
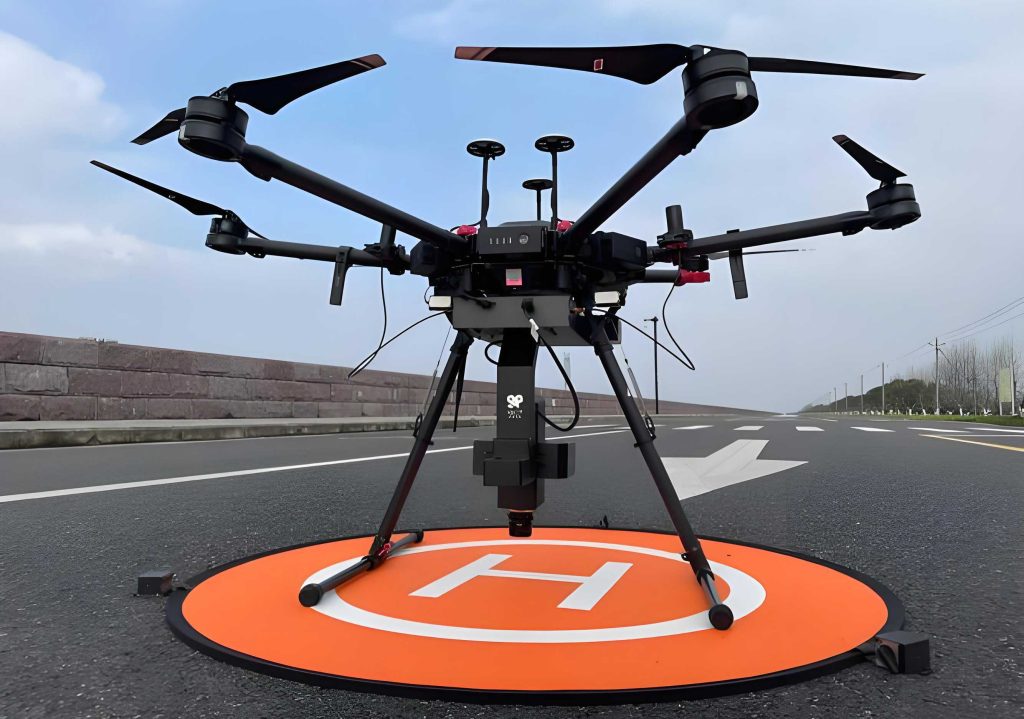
A DJI Matrice 300 RTK UAV drone was employed as the aerial platform. It was equipped with a ULTRIS X20 Plus hyperspectral imager, which captures data in the 350-1000 nm spectral range with a spectral sampling interval of approximately 4 nm. The flight was executed at noon under clear sky conditions with the parameters detailed in Table 1.
| Parameter | Specification |
|---|---|
| Platform | DJI Matrice 300 RTK |
| Sensor | ULTRIS X20 Plus Hyperspectral Imager |
| Flight Altitude | 40 m |
| Ground Sampling Distance (GSD) | ~1.5 cm |
| Spectral Range | 350 – 1000 nm |
| Overlap (Side/Front) | 75% / 75% |
The raw imagery was processed through radiometric calibration (using a white reference panel), orthomosaic generation, and geometric correction. The mean spectral reflectance for each of the 116 ground sample plots was then extracted from the processed hyperspectral orthomosaic for subsequent analysis.
3. Vegetation Indices (VIs) as Predictors:
Instead of using all hundreds of raw spectral bands, which can lead to model overfitting, we calculated a suite of 28 established vegetation indices. These indices are mathematical combinations of reflectances at specific wavelengths designed to enhance the signal related to vegetation properties while minimizing noise from soil background and atmospheric effects. The indices selected, listed in Table 2, are known to be sensitive to LAI, chlorophyll content, and canopy structure, with a particular emphasis on those utilizing the physiologically sensitive “red-edge” region (680-750 nm).
| Vegetation Index | Formula | Key Reference |
|---|---|---|
| Normalized Difference Vegetation Index (NDVI) | $$NDVI = \frac{R_{800} – R_{670}}{R_{800} + R_{670}}$$ | Rouse et al., 1974 |
| Enhanced Vegetation Index (EVI) | $$EVI = 2.5 \times \frac{R_{800} – R_{670}}{R_{800} + 6 \times R_{670} – 7.5 \times R_{475} + 1}$$ | Huete et al., 1994 |
| Green Normalized Difference VI (GNDVI) | $$GNDVI = \frac{R_{800} – R_{550}}{R_{800} + R_{550}}$$ | Gitelson & Merzlyak, 1996 |
| Red Edge Chlorophyll Index (CIred edge) | $$CI_{red\ edge} = \frac{R_{800}}{R_{750}} – 1$$ | Gitelson et al., 2003 |
| Modified Red Edge Simple Ratio (mSR705) | $$mSR_{705} = \frac{R_{750} – R_{445}}{R_{705} – R_{445}}$$ | Sims & Gamon, 2002 |
| Modified Triangulated Vegetation Index (MTVI) | $$MTVI = 1.2 \times [1.2 \times (R_{800} – R_{550}) – 2.5 \times (R_{670} – R_{550})]$$ | Haboudane et al., 2004 |
| Red Edge Position (REP) | $$REP = 700 + 40 \times \frac{(R_{670}+R_{780})/2 – R_{700}}{R_{740} – R_{700}}$$ | Clevers, 1994 |
Note: Rλ denotes reflectance at wavelength λ (nm).
4. Correlation Analysis and Predictor Selection:
We performed Pearson correlation analysis between all 28 calculated VIs and the measured ground LAI. This step identifies the spectral features most strongly associated with LAI variations in our specific maize plots at pollination. The VIs with the highest absolute correlation coefficients (|r|) were selected as candidate predictors for building the inversion models. This pre-selection helps in creating parsimonious and effective models.
5. Inversion Modeling Approaches:
We implemented and compared six different regression modeling strategies to establish the relationship between the selected VIs (predictors) and LAI (response variable). The 116 samples were randomly split into a modeling/training set (80%, n=92) and a validation set (20%, n=24).
- Univariate Linear Regression (ULR): A simple linear model using the single best-performing VI.
- Multiple Stepwise Regression (MSR): An empirical multivariate method that automatically selects the most significant subset of VIs to build a linear model.
- Partial Least Squares Regression (PLSR): A multivariate technique effective for handling collinear predictors (like VIs) by projecting them into latent factors.
- Machine Learning Models:
- Random Forest Regression (RFR): An ensemble method building multiple decision trees.
- Support Vector Regression (SVR): A kernel-based method aiming to fit the error within a threshold.
- Back-Propagation Neural Network (BPNN): A classic artificial neural network with one hidden layer.
6. Model Validation and Evaluation:
The performance of all models was rigorously evaluated using the independent validation dataset. Two key metrics were employed:
1. Coefficient of Determination (R²): Measures the proportion of variance in LAI explained by the model. Closer to 1 is better.
2. Root Mean Square Error (RMSE): Measures the average magnitude of prediction errors. Closer to 0 is better.
The formula for RMSE is:
$$RMSE = \sqrt{\frac{1}{n}\sum_{i=1}^{n}(y_i – \hat{y}_i)^2}$$
where \(y_i\) is the measured LAI, \(\hat{y}_i\) is the predicted LAI, and \(n\) is the number of samples.
Results and Analysis
1. Spectral Response and Correlations:
Analysis of the canopy spectral reflectance revealed a characteristic green vegetation profile. The correlation between reflectance at each narrow band and measured LAI showed a distinct pattern: negative correlation in the visible region (especially red around 670 nm due to chlorophyll absorption), transitioning to a strong positive correlation in the near-infrared (NIR) plateau (750-900 nm) where scattering from the leaf mesophyll dominates. The strongest positive correlations were observed in the NIR region beyond 900 nm. Notably, the “red-edge” slope (690-730 nm) showed a very rapid shift from negative to high positive correlation, underlining its sensitivity to canopy density and chlorophyll content, both related to LAI.
2. Performance of Vegetation Indices:
Correlation analysis confirmed that most VIs were highly significant predictors of LAI (p < 0.01). The top-performing indices, predominantly those incorporating red-edge wavelengths, are listed in Table 3. The Red Edge Position (REP) index showed the highest linear correlation (r = 0.789), demonstrating the superior sensitivity of red-edge parameters for LAI estimation in the structurally complex pollination-stage maize canopy observed by the UAV drone.
| Rank | Vegetation Index | Correlation with LAI (r) |
|---|---|---|
| 1 | Red Edge Position (REP) | 0.789 |
| 2 | Normalized Difference Spectral Index (NDSI) | 0.784 |
| 3 | Chlorophyll Index Red Edge (CIred edge) | 0.780 |
| 4 | Double Difference Index (DDN) | -0.779 |
| 5 | Normalized Difference Red Edge 2 (NDRE2) | 0.774 |
3. Comparative Performance of Inversion Models:
The accuracy metrics for all six models on both the training and validation sets are summarized in Table 4. The results lead to several clear conclusions:
| Model | Training Set | Validation Set | Key Observation | ||
|---|---|---|---|---|---|
| R² | RMSE | R² | RMSE | ||
| Univariate Linear (ULR) – REP | 0.62 | 0.56 | 0.54 | 0.62 | Baseline model, prone to saturation. |
| Multiple Stepwise (MSR) | 0.85 | 0.35 | 0.80 | 0.40 | Robust empirical model with good generalization. |
| Partial Least Squares (PLSR) | 0.80 | 0.41 | 0.77 | 0.43 | Stable and consistent performance. |
| Random Forest (RFR) | 0.96 | 0.18 | 0.85 | 0.37 | Highest accuracy, best capture of non-linearity. |
| Support Vector (SVR) | 0.61 | 0.57 | 0.61 | 0.56 | Moderate performance, potential underfitting. |
| Neural Network (BPNN) | 0.62 | 0.57 | 0.60 | 0.55 | Moderate performance, similar to SVR. |
Key Findings:
– Multivariate vs. Univariate: All multivariate models (MSR, PLSR, RFR) significantly outperformed the best single-VI linear model (ULR). This highlights the advantage of integrating complementary spectral information from multiple indices for robust LAI estimation from UAV drone data.
– Machine Learning vs. Traditional: Among the tested algorithms, the Random Forest Regressor (RFR) demonstrated the highest predictive accuracy. It achieved a near-perfect fit on the training data (R²=0.96) and maintained the highest validation accuracy (R²=0.85, RMSE=0.37). RFR’s ensemble structure effectively captured the complex, non-linear relationships between the hyperspectral VIs and LAI without severe overfitting.
– Performance of Other Models: The traditional MSR model performed remarkably well, offering a strong balance of accuracy, simplicity, and interpretability with a validation R² of 0.80. PLSR also showed stable and reliable results. In contrast, SVR and BPNN, in their implemented forms, showed only moderate performance, possibly due to the specific hyperparameter settings or the nature of the dataset.
4. Variable Importance:
Analysis of the best-performing RFR model revealed which VIs contributed most to its predictions. The Double Difference Index (DDN), a red-edge-based index, was assigned the highest importance, accounting for over 30% of the model’s decision-making. This was followed by other red-edge indices like NDSI and NDRE2. This internal model analysis consistently underscores the critical role of red-edge spectral information derived from the UAV drone hyperspectral sensor for estimating LAI in dense maize canopies.
Discussion and Implications
The superior performance of the Random Forest model aligns with its known strengths in handling multidimensional, collinear data and modeling non-linear ecological relationships. Its resistance to overfitting, compared to other complex models like BPNN, makes it particularly suitable for agricultural remote sensing applications where sample sizes may be moderate. The success of MSR and PLSR confirms that well-constructed linear models based on expert-selected VIs can still provide highly reliable estimates, offering a simpler, more interpretable alternative.
The dominance of red-edge-sensitive vegetation indices across all successful models is a significant finding. The red-edge region is where reflectance rapidly increases due to the combined effects of strong chlorophyll absorption in the red and high scattering in the NIR. For crops like maize at advanced growth stages (e.g., pollination), where LAI is high and canopies are dense, traditional indices like NDVI often saturate. Red-edge indices, such as REP, CIred edge, and DDN, are less susceptible to this saturation effect, providing a greater dynamic range for accurately quantifying high LAI values. This makes data from a modern hyperspectral-equipped UAV drone indispensable for monitoring mid-to-late season crop biophysical parameters.
The ability to generate high-resolution LAI maps, as enabled by the RFR model applied to the UAV drone orthomosaic, provides breeders and agronomists with an unprecedented spatial view of canopy development. Spatial patterns of LAI can reveal within-field variability due to soil differences, water stress, or genetic performance, guiding targeted scouting and management. For the Nanfan breeding program specifically, this technology offers a non-destructive, high-throughput phenotyping tool to efficiently evaluate the canopy architecture of hundreds or thousands of breeding lines during the critical pollination period.
Conclusion
This study demonstrates a practical and effective framework for inverting leaf area index in maize using hyperspectral remote sensing data acquired by a UAV drone. By systematically evaluating a suite of vegetation indices and multiple regression algorithms, we conclude that:
- Hyperspectral data, particularly through red-edge-derived indices, provides highly sensitive predictors for maize LAI estimation, overcoming saturation issues common at high biomass levels.
- Multivariate modeling approaches consistently and significantly outperform univariate models.
- Among the tested algorithms, the Random Forest regression model achieved the highest accuracy and robustness for predicting pollination-stage maize LAI, making it the recommended choice for this application.
- The integration of UAV-based hyperspectral imaging with machine learning analytics, as demonstrated here, forms a powerful, scalable solution for precise, non-destructive crop monitoring and high-throughput field phenotyping, with direct benefits for precision agriculture and accelerated crop breeding programs.
The methodology outlined is not limited to maize or the pollination stage but provides a transferable blueprint for estimating key vegetation traits across various crops and growth conditions using versatile UAV drone platforms.