With the accelerating pace of global urbanization, subway systems have become indispensable to metropolitan public transportation due to their high capacity and efficiency. The construction of subway stations invariably involves extensive and deep foundation pit excavation, which introduces significant geotechnical and operational hazards. Traditional manual inspection methods for these sites are often labor-intensive, time-consuming, and subject to human error and bias. To address these challenges, this study proposes an automated inspection framework that integrates unmanned aerial vehicle (UAV drone) technology with advanced deep learning algorithms. Specifically, we develop a modified object detection model tailored for identifying critical risk sources, such as heavy machinery and ground cracks, from high-resolution UAV drone imagery. The primary contributions of this work are threefold: First, we establish a practical and cost-effective data acquisition pipeline using commercial-grade UAV drones. Second, we construct a specialized dataset for foundation pit risk sources. Third, we introduce architectural improvements to the YOLOv5 model, incorporating depthwise separable convolutions and a large-scale detection head, which significantly enhances detection performance on large-format aerial images while reducing model complexity. Experimental results validate the efficacy of our approach, demonstrating high accuracy and promising potential for real-world deployment in construction safety management.
1. Introduction and Background
The safety monitoring of geotechnical construction sites, particularly deep foundation pits for subway stations, presents a persistent challenge in civil engineering. These sites are dynamic environments with multiple concurrent activities, including excavation, shoring, and the operation of various heavy equipment. The primary risk sources can be categorized into two major groups: Equipment-related hazards (e.g., cranes, pile drivers, concrete pump trucks, dump trucks operating in close proximity) and Geotechnical indicators (e.g., ground settlements, linear cracks, and网状crack patterns on slopes or retaining walls). Manual visual inspection, the conventional method, is not only inefficient and costly but also exposes personnel to potential site dangers. Recent advancements in remote sensing and computer vision offer transformative solutions.
UAV drones, or unmanned aerial vehicles, have emerged as powerful tools for site surveying and inspection across various engineering domains. Their advantages include rapid deployment, access to hard-to-reach or hazardous areas, and the ability to capture high-resolution geospatial data from unique vantage points. Researchers have successfully employed UAV drone platforms for inspecting infrastructure like bridges, dams, and building facades. For instance, automated UAV drone systems have been designed for periodic dam inspection, and frameworks combining UAV drone data with Building Information Modeling (BIM) have been explored for construction progress tracking and safety compliance checking on building sites. However, the application of automated, deep learning-based UAV drone inspection specifically for the complex and congested environment of subway foundation pit construction remains less explored.
This research gap motivates our work. We posit that a specialized deep learning model, trained on imagery captured by a cost-effective UAV drone, can reliably automate the detection of key risk sources in near real-time. This paper details the entire pipeline, from data collection and preprocessing using a UAV drone to the development and validation of a novel object detection algorithm. The proposed system aims to provide site managers with a timely, objective, and comprehensive safety assessment tool, thereby enhancing risk mitigation strategies in metro construction projects.
2. Methodology
Our methodology is structured into three core phases: (A) UAV drone-based Data Acquisition and Preprocessing, (B) Dataset Curation and Annotation, and (C) the Design and Training of the Deep Learning Detection Model.
2.1 UAV Drone Data Acquisition and Image Processing
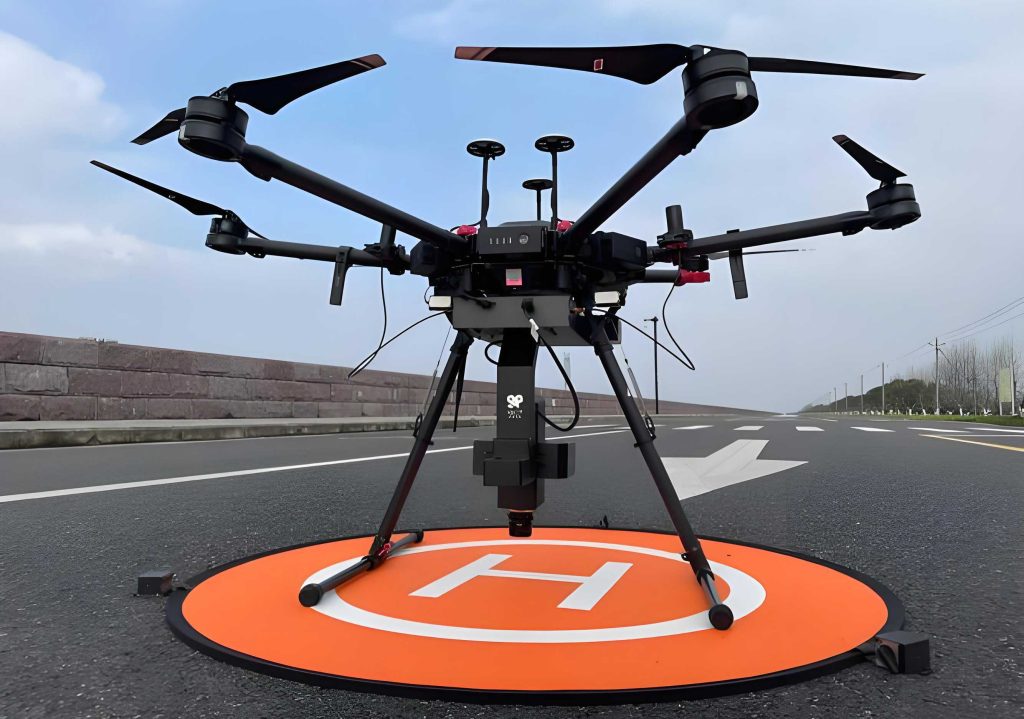
For data collection, we utilized a widely available commercial UAV drone, the DJI Mavic 2 Air. Its key specifications relevant to this study are summarized in Table 1. To ensure the model’s robustness to varying flight altitudes, we conducted missions at two distinct heights: 80 meters and 120 meters above ground level, capturing nadir (vertical) imagery.
| Parameter | Value |
|---|---|
| Model | DJI Mavic 2 Air |
| Camera Resolution | 48 MP (8000 × 6000 pixels) |
| Sensor | 1/2-inch CMOS |
| Lens (Equivalent) | 24 mm, f/2.8 |
| Gimbal | 3-axis (Pitch: -90° to +24°) |
| Positioning System | GPS + Galileo |
The flight plan was designed to cover the target foundation pit area comprehensively. The flight path was centered on the pit’s axis, extending 150 meters along its length and 80 meters to either side. A high forward and side overlap (greater than 50%) was maintained between consecutive images to facilitate subsequent photogrammetric processing.
The raw images captured by the UAV drone underwent a two-stage preprocessing sequence before being used for model training or synthetic orthomosaic generation:
- Lens Distortion Correction: Based on the known lens parameters (focal length, distortion coefficients) embedded in the image metadata and the flight altitude, we applied a radial and tangential distortion correction model to each image. This step rectifies the inherent optical distortion, ensuring geometric accuracy. The correction for a pixel location (x, y) can be modeled as:
$$x_{corrected} = x(1 + k_1 r^2 + k_2 r^4 + k_3 r^6) + [2p_1xy + p_2(r^2+2x^2)]$$
$$y_{corrected} = y(1 + k_1 r^2 + k_2 r^4 + k_3 r^6) + [p_1(r^2+2y^2) + 2p_2xy]$$
where $r^2 = x^2 + y^2$, and $k_n$, $p_n$ are the radial and tangential distortion coefficients, respectively. - Image Stitching for Orthomosaic: For generating a unified, large-scale site map (orthomosaic), we used a feature-based alignment and blending algorithm. Keypoint detectors (e.g., SIFT or ORB) identified matching features in overlapping UAV drone images, which were then used to compute homography matrices for precise alignment and stitching into a seamless, georeferenced orthophoto.
It is important to note that for the deep learning model training, we used the individual, undistorted UAV drone images rather than the stitched orthomosaic. This approach provides a larger number of training samples with varied contexts and avoids potential artifacts from the stitching process.
2.2 Dataset Construction for Risk Source Detection
We constructed a custom dataset focusing on the two main categories of risk sources prevalent in subway foundation pit construction. The dataset composition is detailed in Table 2. Annotation was performed manually using the LabelMe tool, drawing bounding boxes around each instance of the target objects. The dataset was randomly split into training (60%), validation (30%), and test (10%) sets, ensuring no spatial or temporal data leakage between splits.
| Risk Source Category | Sub-class | Instances (80m) | Instances (120m) | Total Instances |
|---|---|---|---|---|
| Crack | Linear Crack | 50 | 50 | 100 |
| Mesh Crack | 20 | 20 | 40 | |
| Heavy Machinery | Pile Driver | 20 | 20 | 40 |
| Crane | 50 | 50 | 100 | |
| Dump Truck | 20 | 20 | 40 | |
| Concrete Pump Truck | 50 | 50 | 100 |
2.3 Proposed Deep Learning Model: YOLOv5-ds
We selected YOLOv5l as our base model due to its excellent balance between speed and accuracy in object detection. However, direct application to high-resolution UAV drone imagery presents two challenges: (1) The computational cost and model size can be prohibitive for potential edge deployment, and (2) the standard detection heads may not optimally capture features for objects that appear small relative to the large image canvas. To address these, we propose YOLOv5-ds (Depthwise Separable), incorporating two key modifications.
2.3.1 Depthwise Separable Convolution (DSC) Module
We replace the standard convolutional blocks in the backbone and neck of YOLOv5 with a DSC module, termed Conv_ds. A standard convolution applies a 3D kernel across all input channels simultaneously. In contrast, DSC factorizes this operation into two efficient steps:
- Depthwise Convolution (DW): A spatial convolution is applied independently to each input channel. For an input feature map $F \in \mathbb{R}^{H \times W \times C_{in}}$, it uses $C_{in}$ kernels of size $K \times K \times 1$. The output $O_{DW}$ has the same dimensions $H’ \times W’ \times C_{in}$.
- Pointwise Convolution (PW): A 1×1 convolution is used to combine the outputs from the depthwise step across channels. It applies $C_{out}$ kernels of size $1 \times 1 \times C_{in}$ to produce the final output $O_{PW} \in \mathbb{R}^{H’ \times W’ \times C_{out}}$.
The computational cost ratio between standard convolution (Std Conv) and DSC is approximately:
$$\frac{\text{Cost}_{DSC}}{\text{Cost}_{StdConv}} \approx \frac{1}{C_{out}} + \frac{1}{K^2}$$
where $K$ is the kernel size. This factorization dramatically reduces the number of parameters and floating-point operations (FLOPs), leading to a lighter and faster model—a critical advantage for processing the voluminous data from UAV drone surveys.
2.3.2 Large-Scale Detection Head
Standard YOLOv5 employs detection heads at three different scales (e.g., 80×80, 40×40, 20×20 from an input of 640×640). For our high-resolution UAV drone images (often downsampled to 1280×1280 or larger for training), objects like cracks or distant machinery can be extremely small. To improve detection sensitivity for these small objects in a large scene, we introduce an additional detection head at a finer scale of 160×160. This head is connected to an earlier, higher-resolution feature map in the feature pyramid network (FPN). The multi-scale prediction scheme of our final model is summarized in Table 3.
| Detection Head | Feature Map Scale | Primary Target Object Size |
|---|---|---|
| Head 1 (Large-scale) | 160 × 160 | Very Small Objects (e.g., fine cracks) |
| Head 2 | 80 × 80 | Small to Medium Objects |
| Head 3 | 40 × 40 | Medium Objects |
| Head 4 | 20 × 20 | Large Objects |
The overall architecture of YOLOv5-ds is illustrated in the following conceptual block diagram, highlighting the integration of the C3_ds module (which uses Conv_ds) and the four detection heads.
[Architecture Diagram Description: A flowchart showing the modified YOLOv5l structure. The Backbone consists of Conv and multiple C3_ds modules, reducing spatial dimensions. The Neck includes SPPF and Concat operations for feature fusion from different stages. Four detection heads (160×160, 80×80, 40×40, 20×20) branch out from the Neck, each containing Conv and final detection layers.]
3. Experimental Setup and Evaluation Metrics
3.1 Implementation Details
All experiments were conducted on a workstation with an NVIDIA RTX 2070 GPU, using PyTorch 1.8.1 and Python 3.6. The model was trained for 300 epochs with a batch size of 8. We used the AdamW optimizer with an initial learning rate of 0.001, which was scheduled to decay using a cosine annealing strategy. Standard data augmentations for UAV drone imagery were applied, including mosaic augmentation, random affine transformations (scaling, translation, shear), and color jittering (hue, saturation, value adjustments).
3.2 Evaluation Metrics
Model performance was evaluated using standard object detection metrics based on the Intersection over Union (IoU) threshold:
- Precision (P): Measures the model’s ability to avoid false positives.
$$Precision = \frac{TP}{TP + FP}$$ - Recall (R): Measures the model’s ability to find all positive instances.
$$Recall = \frac{TP}{TP + FN}$$ - Average Precision (AP): The area under the Precision-Recall curve for a single class.
- mean Average Precision (mAP@0.5): The mean of AP values across all classes at an IoU threshold of 0.5.
- IoU: Measures the overlap between a predicted bounding box $B_p$ and a ground truth box $B_{gt}$.
$$IoU = \frac{Area(B_p \cap B_{gt})}{Area(B_p \cup B_{gt})}$$
Here, $TP$ (True Positives) are correct detections, $FP$ (False Positives) are incorrect detections, and $FN$ (False Negatives) are missed ground truths.
4. Results and Analysis
4.1 Quantitative Performance
The training curves for loss and metrics showed stable convergence. The final Precision-Recall (P-R) curve for the proposed YOLOv5-ds model is shown below, indicating high area under the curve for most classes. The primary quantitative results are presented in Table 4.
| Class | Precision | Recall | AP@0.5 | mAP@0.5 |
|---|---|---|---|---|
| Linear Crack | 0.821 | 0.780 | 0.812 | 0.879 |
| Mesh Crack | 0.794 | 0.735 | 0.781 | |
| Pile Driver | 0.901 | 0.850 | 0.885 | |
| Crane | 0.935 | 0.920 | 0.932 | |
| Dump Truck | 0.862 | 0.810 | 0.848 | |
| Concrete Pump Truck | 0.923 | 0.905 | 0.918 |
The proposed model achieved an overall mAP@0.5 of 87.9%, demonstrating strong performance in identifying both machinery and cracks from UAV drone imagery. Cranes and concrete pump trucks, which are frequent and structurally distinct, achieved the highest AP scores (>0.91). The detection of cracks, which are more challenging due to their irregular shapes and lower contrast, still achieved respectable AP scores above 0.78. The performance for dump trucks was slightly lower, likely due to their relatively lower instance count in the dataset and visual similarity to other site vehicles.
4.2 Model Efficiency Analysis
A key objective was to develop a model suitable for potential on-edge processing of UAV drone data. Table 5 compares the efficiency of our YOLOv5-ds model against the baseline YOLOv5l model.
| Model | Parameters (Millions) | Model Size (MB) | GFLOPs (1280×1280) | Inference Time (ms/image)* |
|---|---|---|---|---|
| YOLOv5l (Baseline) | 46.5 | 91.2 | 109.1 | 42 |
| YOLOv5-ds (Ours) | 18.7 | 38.5 | 45.3 | 28 |
* Average time on RTX 2070 GPU.
The integration of depthwise separable convolutions resulted in a dramatic reduction of over 60% in both the number of parameters and computational load (GFLOPs). Consequently, the model size was reduced from 91.2 MB to 38.5 MB, and inference speed improved by approximately 33%. This makes the YOLOv5-ds model highly attractive for deployment scenarios where computational resources may be limited, such as on a companion computer aboard the UAV drone itself or on mobile devices at the construction site.
4.3 Qualitative Results and Discussion
Visual inspection of the model’s predictions on stitched UAV drone orthomosaics confirms its practical utility. The model successfully localizes and classifies multiple instances of heavy machinery with high confidence (often >0.84). As shown in the results figure, cranes are consistently detected with confidence scores exceeding 0.90. Linear cracks on excavated slopes and ground surfaces are also identified, providing crucial early warnings for potential geotechnical instability.
[Result Figure Description: A section of a large stitched orthomosaic from UAV drone imagery. Multiple bounding boxes with labels and confidence scores are overlaid. A crane is detected with 0.96 confidence, a concrete pump truck with 0.92, and several linear cracks with confidences around 0.82-0.85.]
However, the analysis also reveals limitations. First, the detection accuracy for less frequent classes like dump trucks is sub-optimal, suggesting the need for more balanced data collection in future work. Second, while the large-scale detection head improved small object detection, the accuracy for very fine cracks, especially those captured from the higher UAV drone altitude (120m), remains a challenge. This is likely due to the cracks occupying only a few pixels, making their features difficult to distinguish from background texture.
5. Conclusion and Future Work
In this study, we have developed and validated a comprehensive framework for automated safety inspection in subway foundation pit construction using UAV drone technology and deep learning. The proposed YOLOv5-ds model, enhanced with depthwise separable convolutions and a multi-scale detection strategy, effectively identifies key risk sources, including heavy machinery and ground cracks, from high-resolution aerial imagery. With a mean average precision of 87.9%, a significantly reduced model footprint (38.5 MB), and faster inference, the system demonstrates high practicality and economic viability for routine construction site monitoring.
The use of a cost-effective commercial UAV drone makes this technology readily accessible to construction firms. The automated detection pipeline eliminates the subjectivity and inefficiency of manual inspections, enabling frequent, consistent, and comprehensive site assessments. Safety managers can thus receive timely alerts regarding the presence and location of hazards, facilitating proactive risk management.
Future work will focus on several avenues for improvement. First, expanding the dataset to include more instances of underrepresented classes and diverse environmental conditions (e.g., different lighting, weather, soil types) will enhance model robustness. Second, exploring more advanced architectures, such as vision transformers tailored for aerial imagery, could further improve detection performance, particularly for small and elongated objects like cracks. Third, integrating temporal analysis by processing video streams or time-series UAV drone images could allow for the detection of dynamic risks, such as unsafe equipment movement or progressive crack propagation. Finally, developing a fully integrated system that combines real-time UAV drone data acquisition with on-board or edge-based inference would represent a significant step towards fully autonomous construction site inspection.
In conclusion, the fusion of UAV drone-based remote sensing and optimized deep learning models presents a powerful paradigm shift for construction safety management. This work contributes a validated, efficient, and scalable solution towards achieving higher levels of automation and safety in the critical domain of geotechnical construction.