1. Introduction
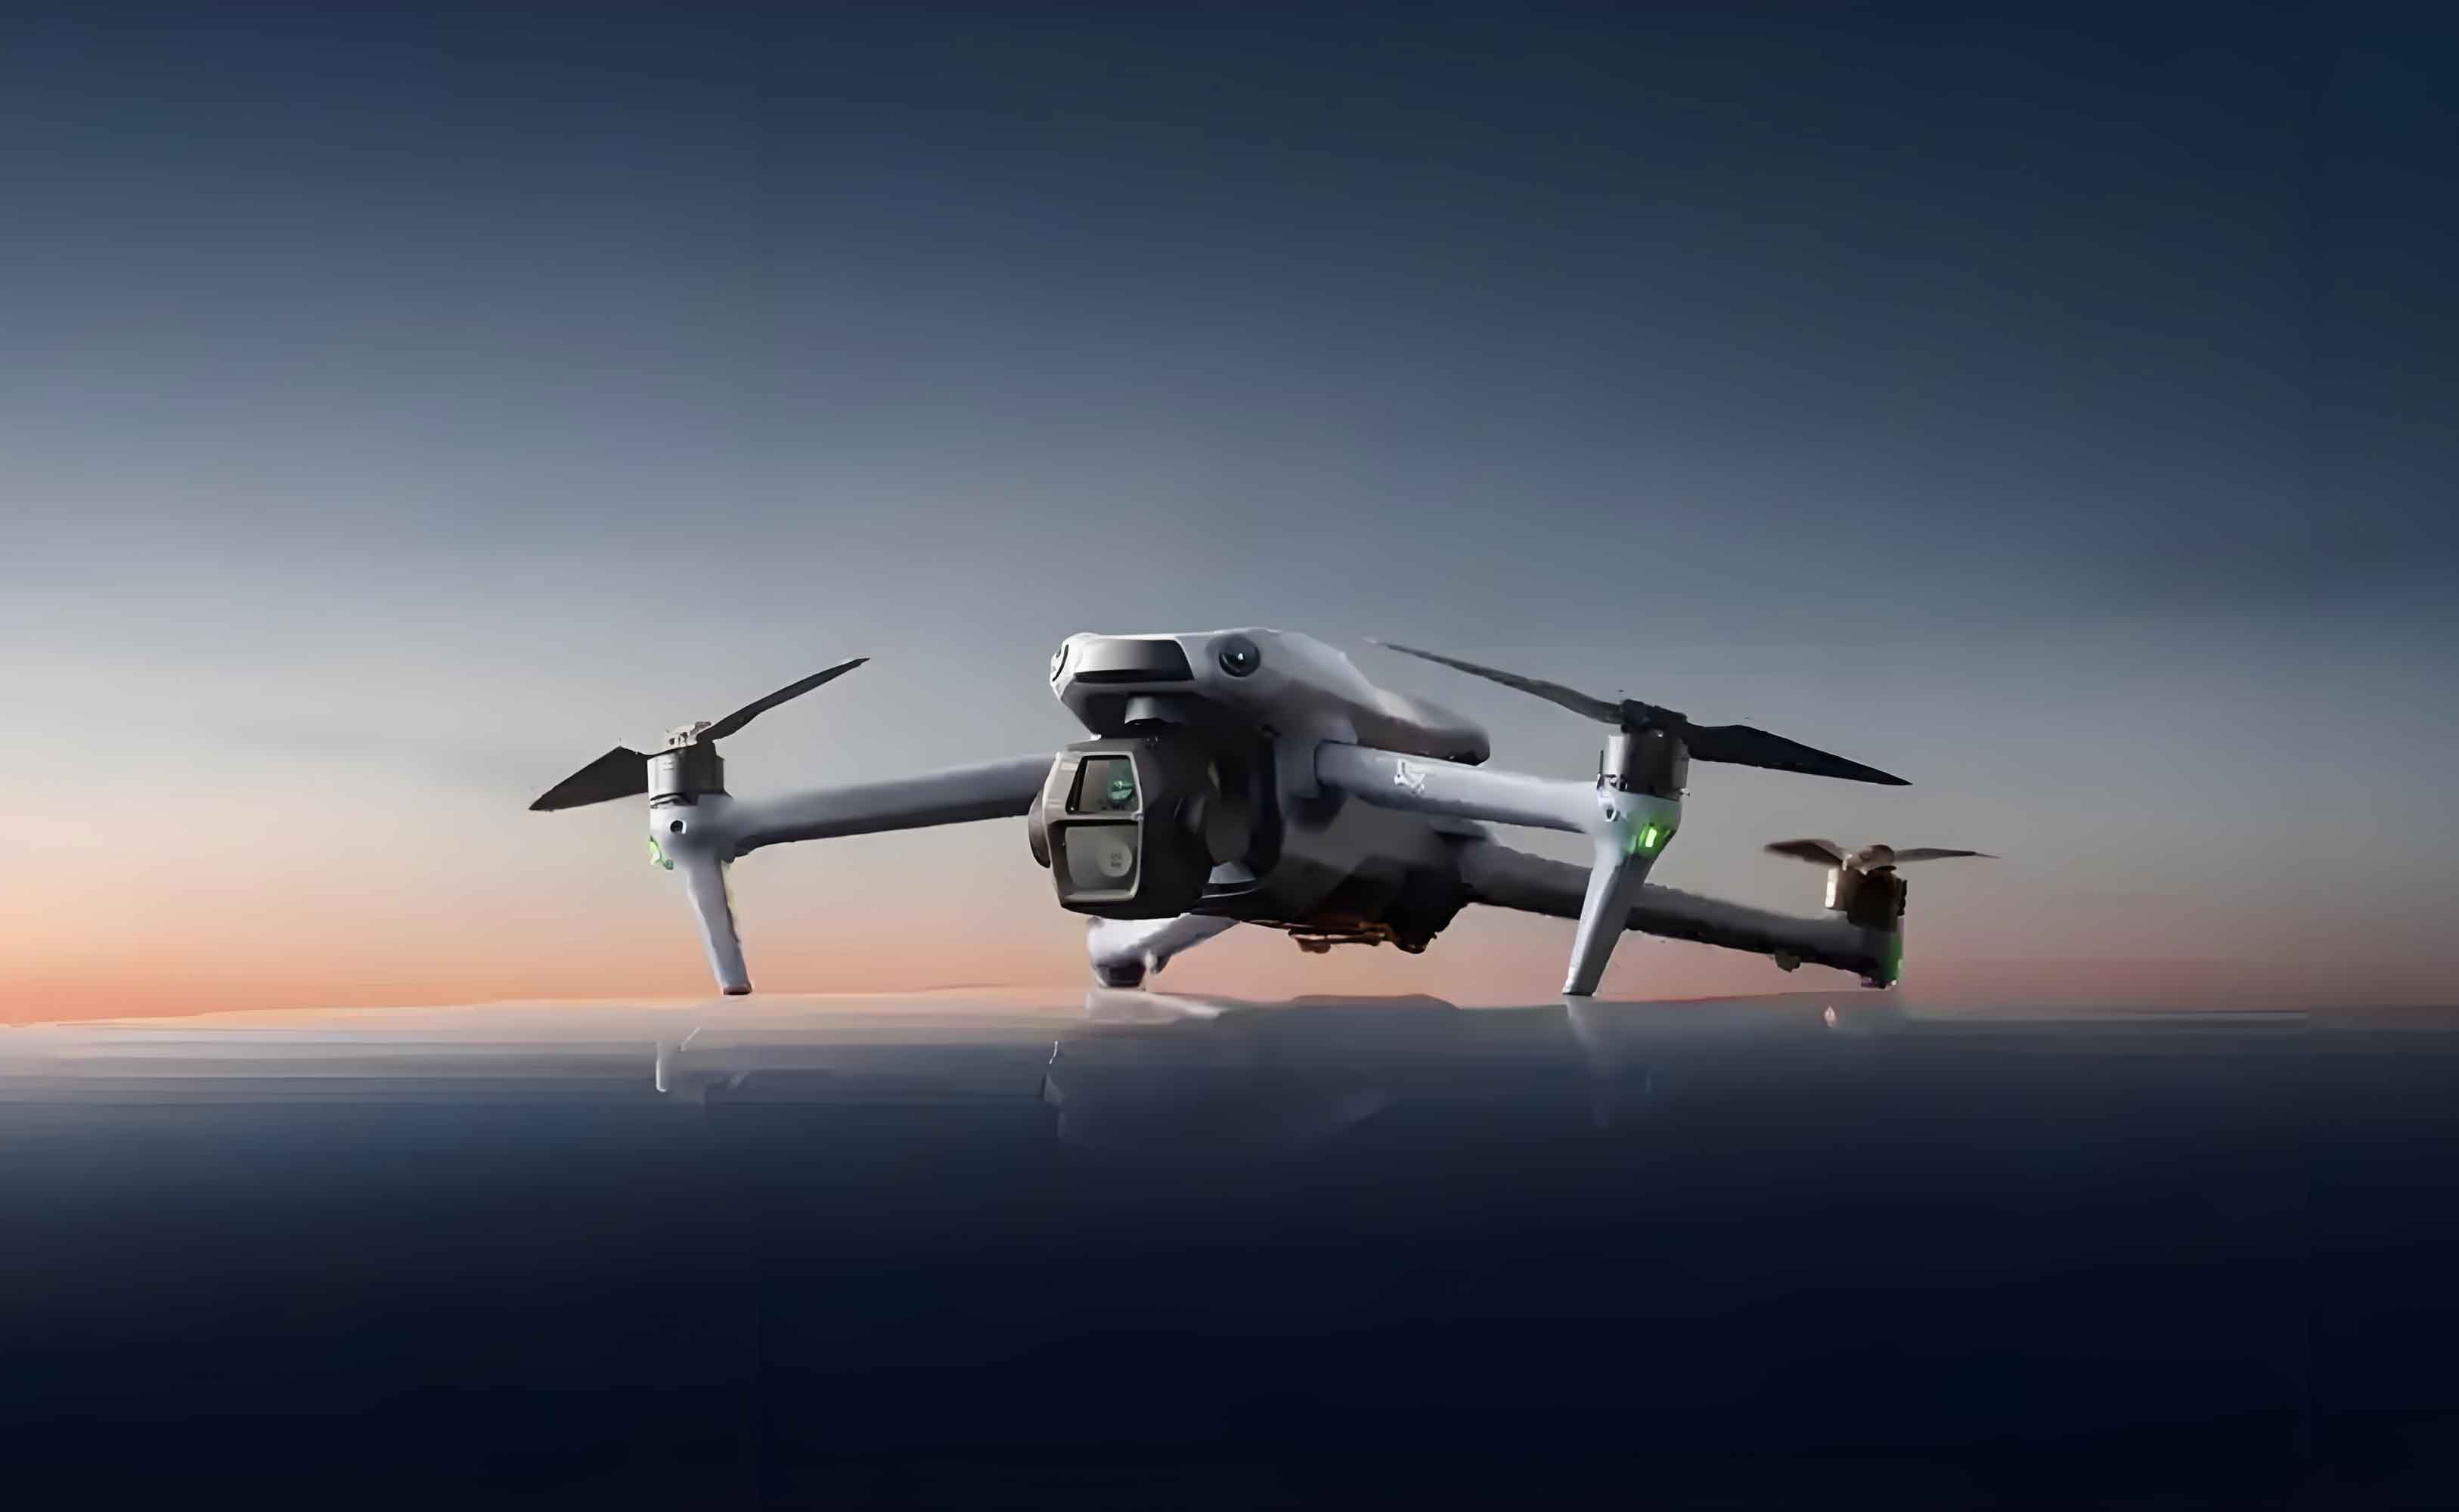
The adoption of UAV aerial photography has revolutionized fields such as geographic mapping, battlefield reconnaissance, and cinematography due to its broad perspective, high mobility, efficiency, and low cost. However, achieving precise auto-focusing (AF) in low-altitude environments remains challenging. Complex lighting conditions and airflow disturbances degrade AF stability and sensitivity, hindering accurate ground target detection. Traditional passive focusing methods, like Depth-from-Focus (DFF), leverage image sharpness evaluation functions but struggle with multidirectional edge gradients in UAV aerial photography. This study addresses these limitations by proposing a novel Threshold-based Tenengrad-Roberts (TR) focusing evaluation function.

2. Limitations of Traditional Spatial Domain Focus Functions
Spatial domain focus functions evaluate sharpness using gradient variations. Clear images exhibit steeper edge gradients than blurred ones. An ideal focus evaluation curve (Figure 1) must satisfy:
- Unimodality: A single global peak at the optimal focus position.
- High Sensitivity: Steep gradient near the peak for precise focus localization.
- Robustness: Noise immunity and computational efficiency.
Common functions and their limitations in UAV aerial photography are summarized below:
Table 1: Traditional Focus Evaluation Functions
| Function | Gradient Calculation | Limitations in UAV Context |
|---|---|---|
| SMD | Absolute differences in horizontal/vertical neighbors. | Low clarity ratio (RR), multi-peak curves. |
| Roberts | Diagonal gradients (±45°). | Ignores horizontal/vertical edges. |
| Sobel | Weighted horizontal/vertical gradients. | Low sensitivity (MSEMSE). |
| Brenner | Horizontal gradients (0°). | Limited directionality. |
| SML | Laplacian-based second-order differences. | Prone to local peaks. |
| Tenengrad | Thresholded Sobel gradients. | Insufficient multidirectional sensitivity. |
Mathematically:
- Roberts: Gx=∣f(x+1,y+1)−f(x,y)∣Gx=∣f(x+1,y+1)−f(x,y)∣, Gy=∣f(x+1,y)−f(x,y+1)∣Gy=∣f(x+1,y)−f(x,y+1)∣
- Tenengrad: FTen=∑(Gx2+Gy2)FTen=∑(Gx2+Gy2), where Gx,GyGx,Gy are Sobel gradients.
3. TR Focus Evaluation Function
3.1 Design Principles
The TR function synergizes:
- Tenengrad’s noise robustness via thresholding.
- Roberts’ multidirectional sensitivity by extending gradient detection to ±45° and ±135°:
G1(x,y)=f(x+1,y+1)−f(x,y)G2(x,y)=f(x−1,y−1)−f(x,y)G3(x,y)=f(x+1,y)−f(x,y+1)G4(x,y)=f(x−1,y)−f(x,y−1)G1(x,y)G2(x,y)G3(x,y)G4(x,y)=f(x+1,y+1)−f(x,y)=f(x−1,y−1)−f(x,y)=f(x+1,y)−f(x,y+1)=f(x−1,y)−f(x,y−1)
3.2 Adaptive Thresholding
Edge pixels (2–5% of total pixels) dominate gradient information. TR incorporates an adaptive threshold TT derived from Otsu’s method:T=1MN∑[f(x,y)−TOtsu]2T=MN1∑[f(x,y)−TOtsu]2
where TOtsuTOtsu is Otsu’s segmentation threshold, and MNMN is image size.
3.3 Final TR FormulationS(x,y)=G12+G22+G32+G42S(x,y)=G12+G22+G32+G42FTR=∑[S(x,y)]2forS(x,y)>TFTR=∑[S(x,y)]2forS(x,y)>T
This ensures:
- Multidirectional gradient detection (±45°, ±135°).
- Noise suppression via adaptive thresholding.
4. Experimental Validation
4.1 Setup
- Hardware: Intel® Core™ i7-13700KF, UAV-mounted imaging system.
- Datasets: 3 groups (A, B, C) of 21 images each (defocus → focus → defocus).
- Metrics:
- Clarity Ratio (RR): R=fmax/fminR=fmax/fmin.
- Sensitivity (MSEMSE): MSE=fmax−f(xmax+Δx)f(xmax+Δx)MSE=f(xmax+Δx)fmax−f(xmax+Δx) (Δx=3Δx=3).
- Interval Sum (SS): S=∑f(x)S=∑f(x) (lower = better).
- Local Peaks (αα): Fewer peaks indicate higher stability.
- Runtime (ττ).
4.2 Results
Table 2: Performance Comparison (Group A)
| Function | RR | MSEMSE | αα | SS | ττ (s) |
|---|---|---|---|---|---|
| Sobel | 3.77 | 0.47 | 1.00 | 0.92 | 0.421 |
| Roberts | 17.00 | 1.58 | 0.50 | 0.563 | 0.503 |
| Tenengrad | 11.78 | 1.21 | 0.70 | 0.998 | 0.598 |
| TR (Proposed) | 373.81 | 2.67 | 0.53 | 0.830 | 0.830 |
Table 3: Performance Comparison (Group B)
| Function | RR | MSEMSE | αα | SS | ττ (s) |
|---|---|---|---|---|---|
| Roberts | 26.86 | 3.74 | 0.57 | 0.574 | 0.574 |
| Tenengrad | 27.69 | 2.69 | 0.54 | 1.00 | 0.571 |
| TR (Proposed) | 300.03 | 7.10 | 0.30 | 0.830 | 0.830 |
Table 4: Performance Comparison (Group C)
| Function | RR | MSEMSE | αα | SS | ττ (s) |
|---|---|---|---|---|---|
| Roberts | 12.64 | 1.02 | 0.59 | 0.563 | 0.563 |
| Tenengrad | 14.83 | 0.74 | 0.34 | 0.999 | 0.999 |
| TR (Proposed) | 539.99 | 2.12 | 0.41 | 0.831 | 0.831 |
Key Observations:
- Clarity Ratio (RR): TR outperforms others by 1–2 orders of magnitude (e.g., 373.81 vs. 17.00 in Group A).
- Sensitivity (MSEMSE): TR achieves the highest values (e.g., 7.10 vs. 3.74 in Group B).
- Stability: TR eliminates multi-peak issues (α<0.53α<0.53) and minimizes SS.
- Real-time Viability: All τ<1τ<1s, suitable for UAV aerial photography.
5. Conclusion
The TR focus evaluation function significantly enhances AF performance in UAV aerial photography:
- Superior Clarity & Sensitivity: RR and MSEMSE exceed traditional functions by orders of magnitude.
- Robustness: Adaptive thresholding mitigates noise from lighting/aerodynamic disturbances.
- Efficiency: Sub-second computation enables real-time focusing.
This work bridges the gap between theoretical AF algorithms and practical demands of low-altitude UAV operations. Future efforts will optimize TR for embedded UAV hardware.
