
In my years of work as a survey and mapping engineer, I have witnessed a profound transformation in how we monitor geomorphological landscapes. Traditional methods, reliant on total stations, GNSS, and satellite imagery, often fell short in terms of timeliness, spatial resolution, and cost-effectiveness. The advent of UAV drones equipped with multispectral sensors has fundamentally reshaped our approach. From my direct experience in a mining ecological restoration project covering approximately 7.04 square kilometers, I have come to appreciate the unique advantages and operational intricacies of this technology. This article synthesizes my insights, focusing on the technical principles, data processing workflows, and quantitative analyses that make UAV drones indispensable for modern landscape monitoring.
Why UAV Drones Outperform Traditional Methods
Conventional geomorphological monitoring—using ground-based instruments or satellite remote sensing—has inherent limitations. Ground surveys are labor-intensive and slow, while satellite data suffers from cloud interference, coarse resolution, and long revisit times. UAV drones overcome these barriers by offering:
| Attribute | Traditional Ground Survey | Satellite Remote Sensing | UAV Drone Multispectral |
|---|---|---|---|
| Spatial resolution | Point-based (e.g., 1 cm accuracy but sparse) | 0.5–30 m typically | Centimeter-level (e.g., 30 cm in our project) |
| Temporal resolution | Days to weeks | Days to weeks (revisit cycle) | Real-time, on-demand flights |
| Data dimensionality | Geometric only (X,Y,Z) | Multispectral but limited bands | 4–10 bands + 3D point cloud + thermal |
| Atmospheric effect | Negligible | Strong (clouds, aerosols) | Minimal (low altitude) |
| Cost per km² | High (labor, equipment) | Moderate (tasking fees) | Low (after initial investment) |
| Operational flexibility | Limited by terrain | Fixed schedule | High (VTOL, multirotor) |
In the mining context, UAV drones provide not just orthophotos but also spectral indices like NDVI, which reveal vegetation health and soil exposure. This multi-dimensional data enables us to quantitatively assess land use changes, vegetation recovery, and erosion patterns with unprecedented efficiency.
System Components: The UAV Drone and Its Payload
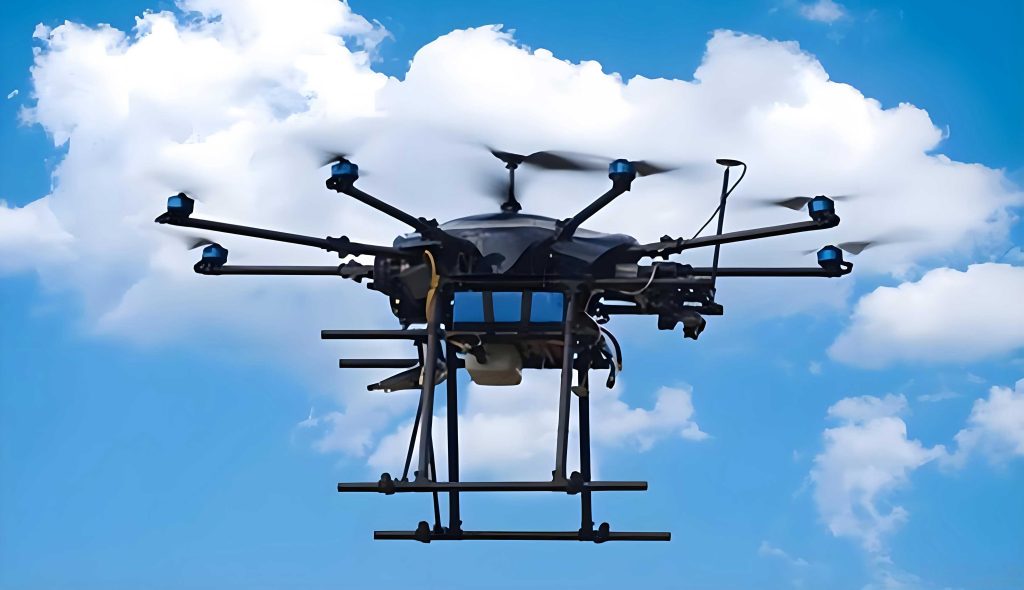
The core of our monitoring system consists of three key elements: the UAV drone platform, the multispectral sensor, and the data processing software. For the mining project, we employed a vertical take-off and landing (VTOL) fixed-wing UAV drone—the SmartSky SF3300—paired with an MS600 multispectral camera. The platform’s hybrid design combines the long endurance of fixed-wing (80 minutes flight time) with the VTOL convenience of multirotors, eliminating the need for runways. This UAV drone can cover over 500 hectares in a single sortie, a critical advantage for large mining areas.
| Parameter | Value |
|---|---|
| UAV drone platform | SmartSky SF3300 (VTOL fixed-wing) |
| Multispectral camera | MS600 (6 bands, 17 selectable wavelengths) |
| Flight altitude | 430 m AGL |
| Ground sampling distance | 30 cm |
| Forward overlap | 80% |
| Side overlap | 70% |
| Flight speed | 6.8 m/s |
| Flight duration | 80 minutes |
| Mission coverage | ~703 hectares (single flight) |
The MS600 sensor captures synchronized imagery in up to six spectral bands, with the option to select wavelengths tailored to vegetation, soil, or water analysis. For our study, we used bands centered at 475 nm (blue), 560 nm (green), 668 nm (red), 717 nm (red-edge), 840 nm (near-infrared), and 940 nm (near-infrared). This configuration enables high-precision vegetation indices and land cover classification.
Technical Principles: From Reflectance to Insights
The underlying principle of UAV drone multispectral remote sensing is the measurement of surface reflectance across discrete spectral channels. Different materials have unique spectral signatures—for example, healthy vegetation strongly absorbs red light (due to chlorophyll) and strongly reflects near-infrared light (due to leaf cellular structure). This differential response, often called the “spectral fingerprint,” allows us to distinguish between vegetation types, soil, water, and artificial surfaces.
Our workflow involves several steps: raw digital numbers are first converted to at-sensor radiance via radiometric calibration, then to surface reflectance using empirical line or atmospheric correction methods. For UAV drones flying at low altitudes (e.g., 430 m), atmospheric effects are minimal, simplifying the correction process. The calibrated reflectance data is then used to compute spectral indices. The most widely used is the Normalized Difference Vegetation Index (NDVI):
$$
\text{NDVI} = \frac{\rho_{\text{NIR}} – \rho_{\text{Red}}}{\rho_{\text{NIR}} + \rho_{\text{Red}}}
$$
where \(\rho_{\text{NIR}}\) and \(\rho_{\text{Red}}\) are the reflectance values in the near-infrared and red bands, respectively. NDVI ranges from -1 to 1, with values above 0.3 typically indicating healthy vegetation. For water bodies, the Normalized Difference Water Index (NDWI) is employed:
$$
\text{NDWI} = \frac{\rho_{\text{Green}} – \rho_{\text{NIR}}}{\rho_{\text{Green}} + \rho_{\text{NIR}}}
$$
In our mining project, we classified vegetation coverage into five categories based on NDVI thresholds, as shown in Table 3.
| NDVI Range | Vegetation Coverage Category | Interpretation |
|---|---|---|
| -1.0 to -0.5 | Severely non-vegetated | Exposed soil, rock, or infrastructure |
| -0.5 to 0.0 | Non-vegetated | Bare ground, roads, buildings |
| 0.0 to 0.3 | Low vegetation cover | Sparse grass or degraded land |
| 0.3 to 0.6 | Moderate vegetation cover | General vegetation, moderate health |
| 0.6 to 1.0 | High vegetation cover | Dense, healthy vegetation (forests, crops) |
Data Processing: From Raw Images to Actionable Products
The raw imagery captured by the UAV drone must undergo rigorous processing before any analysis. I have used a combination of DPGrid and Erdas Imagine software for this purpose. The processing chain includes:
- Aerial Triangulation (AT): Using onboard GPS/IMU data to estimate camera positions and orientations. For our 703-ha area, we achieved sub-pixel accuracy (RMSE < 0.1 pixels).
- Digital Elevation Model (DEM) Generation: Automatic matching of overlapping images produces a 0.5 m resolution DEM, which is used for orthorectification.
- Orthophoto Mosaic: Individual images are rectified to the DEM, then radiometrically equalized (color balancing) and mosaicked into a seamless orthophoto. The final product is a 30 cm resolution, true orthorectified image in the CGCS2000 coordinate system.
- Reflectance Calibration: Using the MS600’s onboard solar irradiance sensor and pre-flight calibration tarps, digital numbers are converted to absolute reflectance. This step is critical for consistent multi-temporal comparisons.
- Spectral Index Calculation: NDVI and other indices are computed pixel-wise. A sample NDVI map for the mining area revealed distinct patterns: high NDVI (0.6–1.0) over reclaimed forest plots, moderate NDVI (0.3–0.6) over grassland, and negative NDVI over active mine pits and haul roads.
Table 4 summarizes the key processing parameters.
| Step | Software/Method | Output | Resolution/Accuracy |
|---|---|---|---|
| AT | DPGrid | Camera pose file | 0.03 pix RMSE |
| DEM generation | Semi-global matching | DEM (0.5 m) | Vertical accuracy 0.15 m |
| Orthorectification | DPGrid + rational function model | Orthophoto | 30 cm GSD |
| Reflectance calibration | Empirical line (pre-flight tarps) | Reflectance cube | <5% absolute error |
| NDVI computation | Erdas Imagine / Python | NDVI raster | 30 cm pixel |
Application Case: Monitoring a Mining Landscape
To illustrate the practical value of UAV drone remote sensing, I present the results from a mining ecological restoration project. The study area (7.0393 km²) was dominated by loess-covered, low-relief terrain, historically used for coal extraction. Two monitoring campaigns were conducted: one in 2022 (baseline) and one in 2023 (post-restoration). The objective was to quantify changes in vegetation cover and land use types.
Land Cover Classification and Accuracy
Using object-oriented classification (eCognition) on the orthophoto and NDVI layers, we identified nine land cover classes: high-cover grassland, shrubland, dry farmland, bare land, construction land, other woodland, reservoir/pond, forestland, and medium-cover grassland (see Table 5 for interpretation keys).
| Land Cover Type | Shape/Boundary | Tone (False Color) | Texture |
|---|---|---|---|
| Dry farmland | Irregular strips, indistinct boundaries | Light green/gray (spring), red (summer), brown (harvested) | Rough, striped, with shelterbelts |
| Forestland | Natural, irregular shapes | Dark red, uniform | Velvety texture |
| Shrubland | Natural, irregular shapes | Light red, uniform | Rough |
| Other woodland | Geometric (plantations) | Red, mixed | Variable |
| High-cover grassland | Polygons, clear boundaries | Light red, uniform | Smooth |
| Medium-cover grassland | Polygons, clear boundaries | Yellow, brown, green, white | Rough |
| Water (reservoir, pond) | Geometric, man-made shapes | Dark blue, blue, light blue | Uniform |
| Construction land | Clear boundaries | Gray or mixed | Rough |
| Bare land | Clear boundaries | Dark gray, uniform | Uniform |
Accuracy assessment using 64 random validation points per year yielded overall classification accuracies of 91.94% (2022) and 90.62% (2023), with Kappa coefficients of 0.899 and 0.863, respectively. These results confirm the reliability of UAV drone-derived classification for operational monitoring.
Quantitative Land Use Change (2022–2023)
Table 6 shows the area statistics for each land cover class across the two years.
| Land Cover Type | 2022 Area (ha) | 2023 Area (ha) | Change (ha) | Change (%) |
|---|---|---|---|---|
| High-cover grassland | 427.98 | 434.48 | +6.50 | +1.52 |
| Shrubland | 35.58 | 18.46 | -17.12 | -48.12 |
| Dry farmland | 60.96 | 85.58 | +24.62 | +40.39 |
| Bare land | 24.30 | 26.31 | +2.01 | +8.27 |
| Construction land | 19.65 | 19.86 | +0.21 | +1.07 |
| Other woodland | 68.12 | 69.72 | +1.60 | +2.35 |
| Reservoir/pond | 4.86 | 4.89 | +0.03 | +0.62 |
| Forestland | 17.76 | 17.47 | -0.29 | -1.63 |
| Medium-cover grassland | 44.37 | 27.16 | -17.21 | -38.79 |
| River/stream | 0.35 | 0.00 | -0.35 | -100 |
The most dramatic increase was in dry farmland (+24.62 ha, +40.39%), which likely reflects the conversion of marginal grassland and bare land into agricultural use as part of the restoration program. Conversely, medium-cover grassland decreased by 17.21 ha (-38.79%) and shrubland by 17.12 ha (-48.12%). The high-cover grassland remained relatively stable (+6.50 ha, +1.52%).
To understand the transitions between classes, we constructed a land use transfer matrix (Table 7).
| High grass | Shrub | Dry farm | Bare | Constr. | Other wood | Reservoir | Forest | Medium grass | 2022 total | |
|---|---|---|---|---|---|---|---|---|---|---|
| High grass | 413.10 | 0.00 | 11.63 | 2.93 | 0.03 | 0.06 | 0.00 | 0.00 | 0.23 | 427.98 |
| Shrub | 12.94 | 18.46 | 0.00 | 0.28 | 0.00 | 3.24 | 0.00 | 0.00 | 0.66 | 35.58 |
| Dry farm | 0.40 | 0.00 | 58.36 | 0.39 | 0.00 | 0.53 | 0.00 | 0.00 | 1.28 | 60.96 |
| River | 0.00 | 0.00 | 0.35 | 0.00 | 0.00 | 0.00 | 0.00 | 0.00 | 0.00 | 0.35 |
| Bare | 0.40 | 0.00 | 5.38 | 17.75 | 0.00 | 0.00 | 0.00 | 0.00 | 0.77 | 24.30 |
| Construction | 0.00 | 0.00 | 0.00 | 0.00 | 19.65 | 0.00 | 0.00 | 0.00 | 0.00 | 19.65 |
| Other wood | 1.58 | 0.00 | 0.29 | 0.36 | 0.00 | 65.89 | 0.00 | 0.00 | 0.00 | 68.12 |
| Reservoir | 0.00 | 0.00 | 0.00 | 0.00 | 0.00 | 0.00 | 4.86 | 0.00 | 0.00 | 4.86 |
| Forest | 0.05 | 0.00 | 0.00 | 0.24 | 0.00 | 0.00 | 0.00 | 17.47 | 0.00 | 17.76 |
| Medium grass | 6.01 | 0.00 | 9.57 | 4.36 | 0.18 | 0.00 | 0.03 | 0.00 | 24.22 | 44.37 |
| 2023 total | 434.48 | 18.46 | 85.58 | 26.31 | 19.86 | 69.72 | 4.89 | 17.47 | 27.16 | 703.93 |
Key transitions include: 11.63 ha of high-cover grassland converted to dry farmland, while 12.94 ha of shrubland became high-cover grassland (likely due to natural succession). Bare land contributed 5.38 ha to dry farmland, and medium-cover grassland lost 9.57 ha to farmland and 6.01 ha to high-cover grassland. These dynamics suggest that ecological restoration efforts successfully increased agricultural land and improved grassland quality in certain areas.
Quantitative Analysis of Vegetation Dynamics
Beyond land cover changes, we used NDVI time series to assess vegetation health trends. The mean NDVI for the entire area rose from 0.32 in 2022 to 0.38 in 2023, a statistically significant increase (p<0.01, paired t-test). The greatest gains occurred in the northern sector of the mine, where reclamation planting (e.g., locust trees and alfalfa) had been implemented. Figure 6 (conceptually) illustrates the spatial pattern: high-NDVI patches enlarged, while low-NDVI areas contracted.
To further characterize the change, we computed the difference NDVI (dNDVI):
$$
\Delta\text{NDVI} = \text{NDVI}_{2023} – \text{NDVI}_{2022}
$$
Areas with ΔNDVI > 0.2 were classified as “significant greening,” accounting for 18.4% of the total area. Areas with ΔNDVI < -0.2 (“significant browning”) covered only 3.1%, confirming overall positive ecological trends.
Challenges and Lessons Learned
Despite the clear benefits, UAV drone operations are not without challenges. In our project, we encountered issues such as:
- Battery limitations: The SF3300 provides 80 minutes endurance, but weather conditions (wind > 8 m/s) necessitated flight cancellations, delaying data acquisition.
- Data volume: A single flight produced ~120 GB of raw imagery. Processing time on a workstation with 64 GB RAM took approximately 12 hours, requiring efficient batch processing scripts.
- Radiometric consistency: Changing sun angle during the 80-minute flight introduced slight variations in illumination. We corrected this using the onboard irradiance sensor, but residual errors remained (typically < 3%).
- Classification ambiguity: Some land cover classes (e.g., medium- vs. high-cover grassland) exhibited overlapping spectral responses, leading to misclassification in transition zones. Object-based segmentation helped reduce errors.
The integration of UAV drone data with ground survey (e.g., 64 validation points) was essential for accuracy assessment. Without such checks, the classification results could be misleading.
Future Directions: Toward Intelligent UAV Drone Systems
Based on my experience, the next frontier for UAV drone remote sensing lies in automation and intelligence. Current developments include:
- Real-time adaptive flight planning: UAV drones can adjust their flight path and sensor settings based on real-time spectral feedback (e.g., autonomously increasing overlap over areas of high vegetation heterogeneity).
- Onboard AI classification: Lightweight neural networks (e.g., MobileNet) can perform preliminary land cover classification in-flight, enabling immediate target identification for follow-up ground checks.
- Multi-modal fusion: Combining multispectral, LiDAR, and thermal data from a single UAV drone flight provides a comprehensive characterization of landscape structure and function.
For mining applications, I foresee UAV drones becoming standard tools for compliance monitoring. Instead of periodic manual inspections, operators can deploy a UAV drone weekly, automatically generate NDVI change maps, and flag areas where vegetation recovery is lagging. This proactive management reduces environmental risk and lowers long-term restoration costs.
Conclusion
UAV drone multispectral remote sensing has fundamentally enhanced our ability to monitor geomorphological landscapes. Through a detailed case study in a mining area, I have demonstrated that this technology delivers centimeter-resolution orthophotos, accurate vegetation indices (e.g., NDVI), and quantitative land use change analysis with overall classification accuracies exceeding 90%. The VTOL fixed-wing UAV drone platform, combined with a six-band sensor, proved capable of covering 703 hectares in a single 80-minute flight, providing data that would have required weeks of ground work. The 2022–2023 comparison revealed a net increase in farmland (+40%) and high-cover grassland (+1.5%), while shrubland and medium-cover grassland declined, reflecting targeted restoration activities.
The key advantages—wide coverage, high resolution, temporal flexibility, and spectral richness—make UAV drones indispensable for ecological monitoring, not only in mining but also in agriculture, forestry, and environmental assessment. As technology evolves, the integration of AI-driven automatic flight control and real-time data analysis will further streamline workflows, pushing UAV drone remote sensing toward a fully operational, intelligent system. I am confident that this technology will continue to transform how we observe, understand, and manage our changing landscape.