
With the rapid advancement of surveying and mapping technology, the industry is shifting from traditional coarse-grained operations to high-precision, efficient, and intelligent approaches. Fine mapping has become a critical foundation for urban planning, ecological monitoring, and disaster assessment. Conventional surveying methods often suffer from high costs and lengthy operational cycles. As a vital supplement to remote sensing, UAV drone technology, characterized by flexible deployment, low-altitude high-resolution imaging, and rapid data acquisition, has been widely applied in large-scale mapping and 3D modeling, providing a new pathway for restructuring surveying workflows and innovating technical systems. In this paper, we present a comprehensive analysis of the application of UAV drone aerial survey technology in fine mapping, focusing on system composition, operational workflow, data processing, and case studies.
System Architecture and Operational Workflow of UAV Drone Aerial Survey
The UAV drone aerial survey system is an integrated airborne-ground collaborative mapping framework that typically includes a flight platform, aerial sensor, position and orientation system (POS), mission planning and control unit, and data storage module. Based on operational environment and accuracy requirements, flight platforms are categorized into fixed-wing, multi-rotor, and vertical take-off and landing (VTOL) composite-wing types. Fixed-wing UAV drone systems offer long endurance and wide coverage, suitable for large-area surveying; multi-rotor platforms provide low-altitude maneuverability and stable hovering, ideal for complex urban environments. The core sensor is a high-resolution digital aerial camera, which can be supplemented by LiDAR, thermal infrared, or oblique photography modules to enrich data types and improve overall mapping accuracy. The inertial navigation system combined with differential GPS forms a high-precision POS subsystem, ensuring that each image frame carries accurate spatial-temporal coordinates. Mission planning software precisely controls parameters such as overlap ratio, flight altitude, and ground sample distance (GSD), significantly enhancing the scientific design and field efficiency of flight operations.
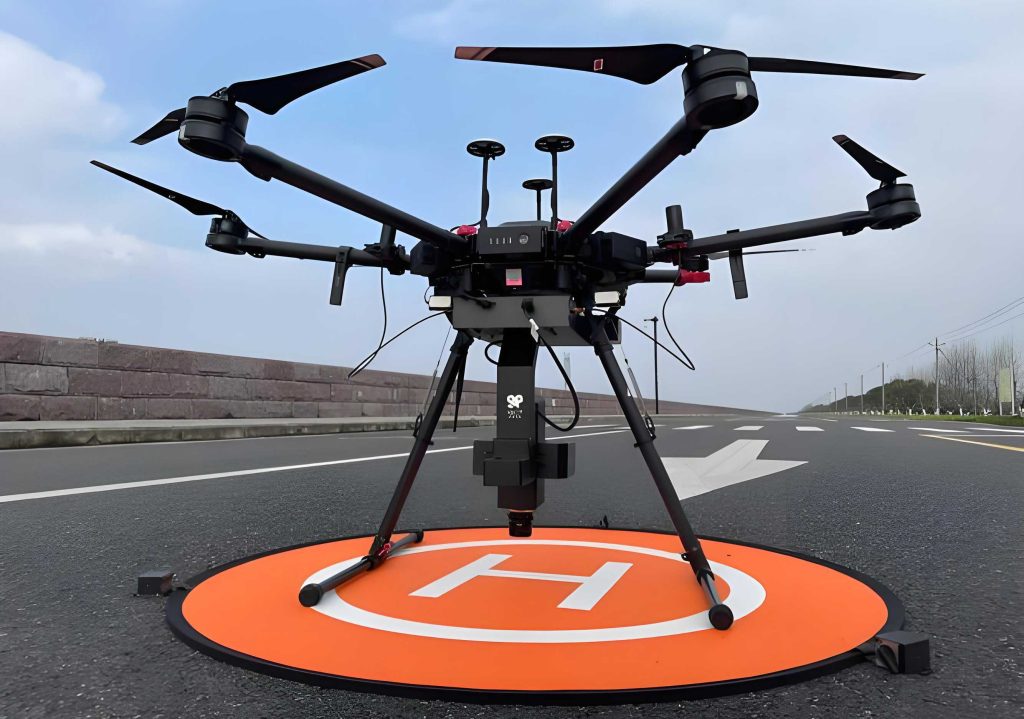
The operational workflow of UAV drone aerial survey consists of five key stages: mission design, flight route planning, data acquisition, data processing, and quality inspection. Mission design defines the mapping scale, coverage area, and target accuracy grade. According to terrain undulation and obstacle distribution, flight parameters are dynamically adjusted. Route planning sets forward overlap (typically 70%–85%) and side overlap (40%–60%) to ensure sufficient stereoscopic intersection conditions. Image acquisition is performed under stable weather conditions, with real-time monitoring of GPS signal quality, battery level, and image capture status. Flight altitude is linearly related to GSD; for fine mapping projects, GSD is generally set between 2 cm and 5 cm, while flight speed and route spacing are adjusted to maintain consistent image overlap.
To meet the high spatial data requirements of fine mapping, systematic quality control is implemented throughout data collection. Ground control points (GCPs) are reasonably arranged according to terrain features and flight lines, and both control points and check points are measured using high-precision GNSS equipment. The accuracy of POS data directly affects image spatial positioning; therefore, equipment must be calibrated in a test field and integrated with camera interior and exterior orientation parameters during adjustment. Key control indicators include image overlap effect, flight attitude stability, and exposure time synchronization. An automatic warning mechanism is established in the flight control system to detect abnormal parameters, allowing timely adjustments or mission termination. After field acquisition, preliminary inspection is performed to verify image clarity, overlap compliance, and GNSS data integrity, eliminating invalid data to ensure a reliable foundation for subsequent aerial triangulation and product generation.
Data Processing and Generation of Fine Mapping Products
Aerial triangulation (AT) is the core procedure of the UAV drone data processing chain, determining the spatial accuracy and structural integrity of final products. Due to low flight altitude, high image resolution, large number of images, and complex overlap relationships, traditional AT algorithms are not fully suitable for fine mapping. In our approach, high-precision position and attitude data collected by the POS are embedded into image files, generating images with initial geographic parameters. Feature extraction algorithms such as SIFT or SURF are employed to establish matching relationships between adjacent images. Based on the collinearity equation, optimization is performed to minimize image matching errors and jointly solve for interior and exterior orientation elements.
The collinearity equation is expressed as:
$$
x – x_0 = -f \frac{a_1 (X – X_S) + b_1 (Y – Y_S) + c_1 (Z – Z_S)}{a_3 (X – X_S) + b_3 (Y – Y_S) + c_3 (Z – Z_S)}
$$
$$
y – y_0 = -f \frac{a_2 (X – X_S) + b_2 (Y – Y_S) + c_2 (Z – Z_S)}{a_3 (X – X_S) + b_3 (Y – Y_S) + c_3 (Z – Z_S)}
$$
where $(x, y)$ are image coordinates, $(x_0, y_0, f)$ are interior orientation parameters, $(X, Y, Z)$ are ground coordinates, $(X_S, Y_S, Z_S)$ are perspective center coordinates, and $a_i, b_i, c_i$ are rotation matrix elements. To avoid error accumulation, a bundle block adjustment with control points is applied to weight-optimize the solution. A sliding window dynamically adjusts the weight of matching points, effectively suppressing the influence of image distortion on overall accuracy.
The dense point cloud generated after AT is often affected by illumination differences, image blur, and homogeneous texture, leading to holes, noise, and discontinuities. To improve point cloud accuracy and geometric continuity, we adopt a spatial weight filtering method combined with multi-view stereo reconstruction algorithms, such as PMVS (Patch-based Multi-View Stereo) pixel consistency matching and MVS multi-scale depth map fusion. During local reconstruction, a point density weight function is introduced:
$$
w_{ij} = \frac{\exp\left(-\frac{\| \mathbf{x}_i – \mathbf{x}_j \|^2}{2\sigma^2}\right)}{\sum_{k=1}^{n} \exp\left(-\frac{\| \mathbf{x}_i – \mathbf{x}_k \|^2}{2\sigma^2}\right)}
$$
Here $w_{ij}$ represents the spatial weight of point $\mathbf{x}_j$ to point $\mathbf{x}_i$ during reconstruction, and $\sigma$ is a density control parameter. This weighting mechanism dynamically adjusts the contribution of each region in reconstruction, automatically assigning low weight to noise points, thereby enhancing the clarity of object edge details. The optimized point cloud exhibits superior spatial coherence and surface consistency, providing a reliable geometric basis for orthophoto correction and DEM terrain modeling.
After point cloud optimization, image correction and terrain mapping are performed to output two-dimensional and three-dimensional fine mapping products. Orthophoto generation includes image dodging, distortion correction, geometric rectification, and terrain projection. The core step is to precisely map the image to the true ground surface position. In areas with significant terrain relief, elevation information from the dense point cloud is used for specialized correction to avoid issues such as floating objects or building edge stretching. The digital elevation model (DEM) is constructed by interpolating point cloud elevation values, combining TIN (Triangulated Irregular Network) and IDW (Inverse Distance Weighting) methods for rasterization, ensuring smooth slope transitions and clear object boundaries. The complete workflow of fine mapping product generation is summarized in the following table:
| Step | Description | Output |
|---|---|---|
| 1. Aerial Triangulation | Bundle adjustment with POS and GCPs | Refined orientation parameters |
| 2. Dense Point Cloud Generation | Multi-view stereo matching with weight filtering | High-density 3D point cloud |
| 3. Point Cloud Denoising | Spatial weight filtering and outlier removal | Cleaned point cloud |
| 4. Orthophoto Rectification | Terrain-based differential correction | True orthophoto |
| 5. DEM Interpolation | TIN + IDW rasterization | Digital elevation model |
| 6. Quality Check | Comparison with independent check points | Accuracy report |
Case Studies and Performance Evaluation
To validate the practical performance of UAV drone aerial survey in fine mapping, we conducted comprehensive experiments in three typical scenarios: a densely built-up urban area, a hilly terrain region, and an industrial park. All flights were executed using standard UAV drone systems with appropriate sensors and parameters.
High-Resolution Modeling in a Dense Urban Area
An old urban district covering approximately 1.2 km² was selected. A multi-rotor UAV drone equipped with a Sony Alpha 7R III camera was used. The flight altitude was set to 85 m, yielding a GSD of 2.3 cm. Forward overlap was 85% and side overlap 65%. Oblique photography combined with POS-assisted AT technology was employed. A total of 1,843 valid images were acquired, and 7 GNSS control points were deployed to unify spatial coordinates. The AT solution achieved plane X-error of ±0.013 m, Y-error of ±0.015 m, and elevation Z-error of ±0.021 m. Voxel filtering and normal vector optimization were applied to the surface model, finally producing a digital terrain model and a 3D realistic building model with accuracy better than 1:500 scale. Field verification showed that the deviations of building ridge lines and facade dimensions were all below 2 cm, satisfying the requirements for urban status modeling, underground pipeline integration, and old building renovation assessment.
Accuracy Verification in Hilly Terrain
A hilly region with a maximum elevation difference of 83 m and an area of 1.6 km² was selected to test elevation accuracy under complex terrain. A VTOL fixed-wing UAV drone was used, flying at 120 m altitude with GSD of 3.8 cm. Ten control points and six check points were deployed. A total of 1,984 valid images were captured. After bundle adjustment, a contour map with 1 m interval was generated. The comparison between measured elevations and model elevations at six check points is shown below:
| Check Point ID | Measured Elevation (m) | Model Elevation (m) | Difference (m) |
|---|---|---|---|
| CP01 | 467.82 | 468.03 | 0.21 |
| CP02 | 472.56 | 472.41 | -0.15 |
| CP03 | 459.31 | 459.46 | 0.15 |
| CP04 | 480.13 | 480.09 | -0.04 |
| CP05 | 469.27 | 469.36 | 0.09 |
| CP06 | 474.88 | 474.67 | -0.21 |
All elevation deviations were within ±0.21 m, and the DEM fitting effect was satisfactory, meeting the standard for 1:1,000 scale topographic mapping. In areas with slopes greater than 25°, the model remained continuous without visible gaps or double-image artifacts. The transitions between hilltops and valleys were smooth and clear, demonstrating the strong terrain adaptability of the point cloud reconstruction and elevation interpolation algorithm. Such capability makes UAV drone surveys suitable for landslide monitoring and ecological restoration mapping.
Adaptability Analysis Across Different Application Scenarios
We compared the performance of UAV drone aerial survey in three distinct environments: the dense urban area (GSD 2.3 cm, area 1.2 km²), the hilly region (GSD 3.8 cm, area 1.6 km²), and an industrial park (GSD 2.1 cm, area 0.7 km²). Key technical parameters including point cloud density, modeling error, processing time, and number of valid images are summarized in the following table:
| Scenario Type | Point Cloud Density (pts/m²) | Modeling Error (m) | Processing Time (h) | Valid Images |
|---|---|---|---|---|
| Dense Urban Area | 872 | 0.018 | 6.2 | 1,843 |
| Hilly Terrain | 636 | 0.21 | 5.8 | 1,984 |
| Industrial Park | 945 | 0.011 | 3.9 | 1,127 |
The urban area and industrial park exhibited higher point cloud densities and better modeling accuracy. The industrial park, with regular structures and fewer occlusions, achieved a point cloud density of 945 pts/m² and a modeling error of only 0.011 m. The hilly region suffered from vegetation cover and topographical undulations, resulting in a lower point cloud quality and an elevation error of 0.21 m, yet overall operational efficiency remained comparable. The industrial park required fewer control points and simpler scenes, leading to faster modeling, making it suitable for urban planning, as-built surveys, and routine high-frequency data collection. The hilly terrain model is more appropriate for macroscopic terrain analysis and disaster trend assessment, where fine geometric details are less critical.
Conclusion
Through extensive analysis and experimental validation, we demonstrate that UAV drone aerial survey technology offers significant advantages in fine mapping, including high data acquisition efficiency, superior spatial resolution, and accurate 3D modeling. The technology is well-adapted to diverse scenarios such as dense urban areas, complex mountainous regions, and industrial parks, with stable product quality and operational reliability.
Our work has established a complete technical framework covering platform selection, field flight operation, in-house data processing, and accuracy evaluation. The integration of POS-assisted aerial triangulation, weighted point cloud reconstruction, and DEM generation provides a robust solution for modern surveying needs. The results confirm that UAV drone surveys can meet the requirements of 1:500 to 1:1,000 scale mapping in various environments, contributing to the intelligent and refined transformation of the surveying and mapping industry.
Future research will focus on real-time data processing, multi-sensor fusion, and automated quality control to further enhance the efficiency and applicability of UAV drone aerial survey in precision engineering and geographic information system construction.