
As a researcher deeply involved in transportation infrastructure quality assurance, I have systematically explored the application of drone technology for precise detection of highway subgrade compaction. Traditional methods, such as the cutting ring method and the sand cone method, suffer from limited sampling points, low efficiency, and potential damage to the subgrade structure. These limitations are particularly acute for large-scale projects where timely and comprehensive quality assessment is critical. My work focuses on leveraging the high efficiency, non-destructive nature, and broad coverage of drone technology to develop a robust detection framework. This article presents my findings on the key factors influencing data accuracy, the core detection methodologies, and strategies for enhancing precision.
The core of my research revolves around the principle that spatial and spectral data captured by drone technology can be inversely correlated with compaction density. By establishing reliable mathematical models and processing pipelines, we can transform raw aerial data into actionable compaction maps.
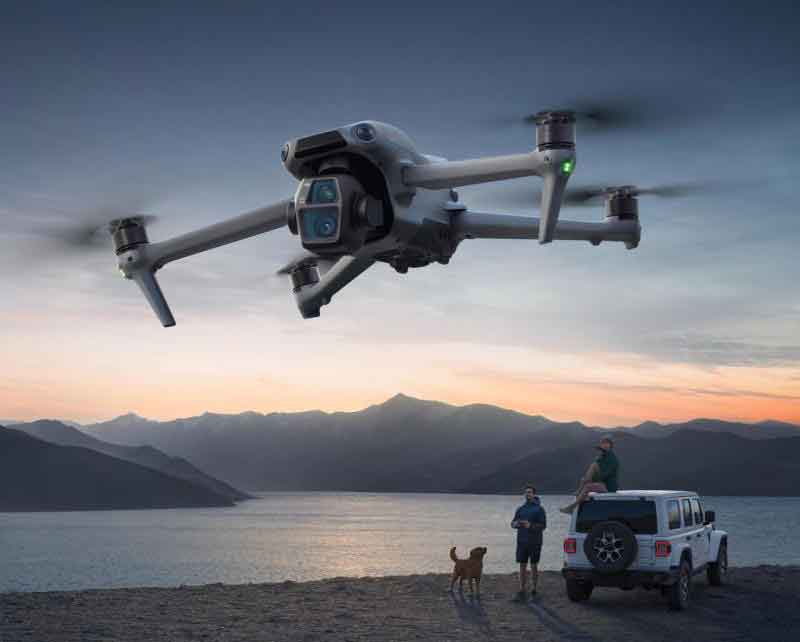
Factors Affecting the Precision of Drone Survey Data
The accuracy of compaction detection is fundamentally dependent on the quality of the aerial survey data. Through numerous experiments and field applications, I have identified three primary categories of influencing factors: equipment parameters, environmental conditions, and data processing algorithms.
1. Equipment Parameters of Drone Technology
The hardware configuration of the drone platform is the bedrock of data precision. A high-resolution sensor is paramount for capturing subtle textural details on the subgrade surface. Low-resolution sensors may fail to detect micro-cracks or variations in soil aggregation that indicate compaction inhomogeneity. The matching of lens focal length and field of view (FOV) is critical; a too-short focal length introduces edge distortion, while a too-long focal length reduces coverage, increasing flight time and errors in image stitching.
The quality of the Inertial Measurement Unit (IMU) directly determines the accuracy of flight attitude records. A high-grade IMU can precisely record pitch, roll, and yaw angles, which are essential for rigorous geometric correction of images. Drift in the IMU leads to misalignment and cumulative errors in the point cloud. Similarly, the stability of the data storage module is crucial; data loss or corruption due to transmission delays or storage failures can render an entire flight mission useless.
Table 1 summarizes the specifications I typically recommend for a dedicated subgrade compaction inspection system.
| Parameter | Recommended Specification | Impact on Compaction Detection |
|---|---|---|
| Sensor Resolution | > 20 MP (for visible) | Enables detection of micro-topography features |
| Focal Length | 25-35 mm equivalent | Balances coverage and geometric accuracy |
| IMU Grade | High-precision (e.g., tactical grade) | Minimizes attitude drift for accurate point cloud generation |
| Lidar Class | Solid-state, < 2 cm range accuracy | Critical for high-precision elevation models |
| Multispectral Bands | Red, Green, NIR, Red-edge | Sensitive to moisture content and soil density |
2. Environmental Conditions for Flight Operations
Adverse environmental conditions can significantly degrade data quality. Wind speed is a primary concern. If the wind exceeds the drone’s operational limits (often > 6 m/s for small platforms), the resulting vibration and irregular yaw will cause image blur and poor overlap consistency. This directly impacts the success rate of Structure-from-Motion (SfM) algorithms.
Illumination conditions are equally critical. Overexposure in strong sunlight can saturate pixels, masking the true soil texture. In low light or backlit scenarios, the image contrast drops, making feature matching difficult. For multispectral imaging, atmospheric conditions like haze or dust can scatter specific wavelengths, altering the apparent surface reflectance. Drone technology must therefore be deployed under optimal weather windows to ensure consistent, high-quality data.
| Condition | Ideal Range | Impact on Data |
|---|---|---|
| Wind Speed | < 4 m/s | Minimizes flight instability and image blur |
| Solar Altitude | 30° – 60° | Provides even illumination and reduces shadow effect |
| Cloud Cover | 0% – 10% | Ensures consistent lighting for photogrammetry |
| Visibility | > 10 km | Reduces atmospheric scattering in multispectral bands |
| Precipitation | None (48 hrs prior) | Ensures subgrade surface is dry and stable |
3. Data Processing Algorithms
The mathematical algorithms used for post-processing are the final, crucial link in the chain. Image-matching algorithms like SIFT or SURF struggle with repetitive soil textures. I have found that integrating deep learning-based matchers (e.g., SuperGlue) significantly reduces false-positive matches in these challenging environments, though at a higher computational cost.
During point cloud generation, the algorithms for dense reconstruction are key. Poisson surface reconstruction can oversmooth micro-relief, which is often a direct indicator of compaction status. In contrast, the Greedy Projection Triangulation method retains more detail but is sensitive to noise. The georeferencing process relies heavily on Ground Control Points (GCPs). If the distribution of GCPs is insufficient or uneven, the model will suffer from systematic warping, degrading absolute positioning accuracy.
The filtering parameters must be carefully tuned. Over-filtering can remove critical high-frequency information that correlates with compaction, while under-filtering leaves noise that obscures the real signal. Based on my calibrations, a standard deviation filter of 0.5 m is often a good starting point for subgrade point clouds.
Detection Methods and Applications Based on Drone Data
I have developed and validated four primary methods for extracting compaction information from drone survey data. Each method has unique strengths and is suited for specific scenarios.
1. 3D Modeling Analysis
Principle: The method generates a dense 3D point cloud from high-overlap aerial images using SfM. The principle of detection is based on the fact that compacted soil has lower compressibility. Consequently, a well-compacted area exhibits less surface deformation and appears smoother in the 3D model. By calculating topographic parameters such as elevation change rate, slope, and curvature from the model, we can spatially map compaction quality.
The relationship is established via a regression model:
$$ C = f(T) + \epsilon $$
where \(C\) is compaction degree, \(T\) is a vector of topographic features (e.g., standard deviation of elevation, roughness index), and \(\epsilon\) is the error term.
| Aspect | Advantages | Disadvantages | Application Scope |
|---|---|---|---|
| Principle | Direct spatial representation of surface | Requires high-resolution images | Flat, bare subgrade surfaces |
| Efficiency | Fast, wide area coverage | Affected by vegetation and debris | Fill sections during construction |
| Accuracy | High for surface deformation | Correlation with deep compaction is indirect | Roadways in arid or semi-arid regions |
2. Multispectral Image Analysis
Principle: By mounting a multispectral sensor on the drone, we can capture the reflectance of the subgrade surface across multiple narrow bands, particularly in the near-infrared (NIR) and red-edge regions. The key principle is that compaction alters the soil’s structural density and, consequently, its moisture retention capacity. A highly compacted area with lower porosity will retain moisture longer, leading to different spectral absorption characteristics compared to a loose, dry area.
The typical response can be modeled as:
$$ R_{\lambda} = a \cdot C + b \cdot M + c $$
where \(R_{\lambda}\) is the reflectance at a specific wavelength, \(C\) is compaction degree, \(M\) is moisture content, and \(a, b, c\) are system constants. Machine learning classifiers like Random Forest or SVM are then used to map the spectral features to compaction classes.
| Aspect | Advantages | Disadvantages | Application Scope |
|---|---|---|---|
| Principle | Sensitive to moisture and density changes | Strongly dependent on material homogeneity | Homogeneous soil (loess, silt) |
| Performance | Excellent for uniformity maps | Complex spectral response in mixed fills | Early- to mid-stage construction |
| Data Type | Non-contact, rich spectral info | Requires calibration for lighting conditions | Large-area uniformity assessments |
3. LiDAR Fusion Method
Principle: This method fuses high-precision LiDAR point cloud data with high-resolution optical imagery. LiDAR provides accurate 3D geometry regardless of lighting, penetrating sparse vegetation to measure the true subgrade surface. The fusion enhances both geometric and textural information. A critical index derived from LiDAR is the surface roughness, \(R_a\), which is defined as:
$$ R_a = \frac{1}{n} \sum_{i=1}^{n} |z_i – \bar{z}| $$
where \(z_i\) is the elevation of a point and \(\bar{z}\) is the mean elevation. A lower \(R_a\) generally indicates higher compaction. Furthermore, the LiDAR return intensity can be correlated with soil density at the surface layer (5-10 cm depth). Combining \(R_a\) and intensity data allows for a multi-dimensional evaluation.
| Aspect | Advantages | Disadvantages | Application Scope |
|---|---|---|---|
| Principle | High geom. accuracy, penetration ability | High equipment cost, heavy data processing | Critical road sections (bridge approaches) |
| Accuracy | Excellent for micro-topography | Intensity correlation needs local calibration | Slope subgrade in complex terrain |
| Reliability | Unaffected by light variations | Lower spectral fidelity compared to cameras | Post-construction verification |
4. Time-Series Data Comparison Method
Principle: This method leverages the temporal dimension of drone technology. By conducting repeated surveys over the same subgrade segment at different times (e.g., before and after each rolling pass, or monthly during a settlement observation period), the derived 3D models or elevation maps (i.e., Digital Elevation Models, DEMs) can be subtracted to isolate changes.
The settlement quantity \( \Delta S \) over a time period \( \Delta t \) is calculated as:
$$ \Delta S = S_{t2} – S_{t1} $$
where \(S_{t1}\) and \(S_{t2}\) are the surface elevations at time 1 and time 2. By analyzing the settlement velocity (\( \Delta S / \Delta t \)), we can identify areas with persistent settlement, which are indicative of poor initial or long-term compaction.
| Aspect | Advantages | Disadvantages | Application Scope |
|---|---|---|---|
| Principle | Direct measure of deformation over time | Requires fixed reference points | Dynamic monitoring during rolling |
| Insight | Provides compaction efficiency data | Correction for environmental errors is complex | Long-term stability assessment |
| Integration | Can be combined with construction logs | High temporal resolution required for quick changes | Performance evaluation of compaction process |
Strategies for Enhancing Detection Precision
To fully realize the potential of drone technology for compaction detection, I have formulated four key strategies to systematically improve accuracy.
1. Optimizing Data Acquisition Protocols
A well-designed flight plan is the first line of defense against poor data quality. Key to this is calculating the optimal Ground Sample Distance (GSD), which is given by:
$$ GSD = \frac{H \times p}{f} $$
where \(H\) is flight altitude, \(p\) is sensor pixel size, and \(f\) is focal length. For compaction work, I mandate a GSD of less than 2 cm. The overlap (forward and side) should be set to a standard of >75% and >65%, respectively, to ensure robust feature matching. Flight lines should be parallel to the road centerline to minimize distortions.
Additionally, the integration of a real-time kinematic (RTK) module for the drone is critical. This provides centimeter-level positioning for the drone’s trajectory, reducing the need for extensive GCPs and improving absolute accuracy significantly.
2. Standardizing Data Processing Workflows
Establishing a standardized, rigorous processing pipeline is essential to minimize user-induced errors. My standard workflow includes: (1) Pre-processing: Apply lens distortion correction and radiometric calibration using a camera model. (2) Image Matching: Use a multi-scale feature algorithm (e.g., RootSIFT) with a high-match threshold (e.g., Lowe’s ratio test < 0.8) to minimize false matches in repetitive soil textures. (3) Point Cloud Filtering: Implement a statistical outlier removal filter with a threshold of 1.0 standard deviations based on the point’s 50 nearest neighbors. This is followed by a radius filter. (4) Georeferencing: Use at least 5-7 GCPs spread across the survey area. The registration error (RMSE) must be less than 5 cm in the horizontal and 3 cm in the vertical.
3. Strengthening System Calibration
Regular calibration is not optional; it is mandatory for high-precision work. I recommend a monthly calibration of the IMU using a static ground station to nullify gyroscope bias. The camera sensor should undergo a radiometric calibration quarterly, using a 20% to 100% reflectance standard target to build a linear response model. LiDAR sensors require an annual geometric calibration against a known ground truth target.
Before any mission, a ‘pre-flight calibration’ check is performed using a small, known calibration field. This process validates all multi-sensor parameters and ensures the system is performing within its required specifications.
4. Enhancing Data Quality Validation
A robust validation mechanism is the final guarantee of reliability. My strategy involves a dual-tier approach: Internal Validation: Check the reprojection error from the SfM process. This should be under 1.0 pixels for high-quality data. Calculate the point cloud noise level; for LiDAR data, the standard deviation of planar surfaces should be less than 2 cm. External Validation: Set aside 10% of the GCPs as Check Points (CPs). Compare the absolute coordinates derived from the drone technology (model) with the high-precision RTK-GPS data for these CPs. The horizontal error should be < 10 cm, and the vertical error < 5 cm.
Furthermore, I conduct a random 2% spot-check of the compaction results using a traditional nuclear density gauge or sand cone test. A correlation analysis with a Pearson coefficient target of > 0.85 is the final acceptance criterion for the entire detection process.
Conclusion
My research and field practice demonstrate conclusively that drone technology offers a viable, efficient, and highly informative alternative to traditional subgrade compaction testing. The transition from point-based to map-based detection provides a holistic view of quality distribution, enabling targeted corrections by construction crews. The choice of detection methodology—be it 3D modeling, multispectral analysis, LiDAR fusion, or time-series comparison—must be tailored to the specific project’s material type, budget, and accuracy requirements.
Looking ahead, the future of this field lies in the integration of drone technology with real-time data analytics and artificial intelligence. We are moving towards an autonomous system where drones not only collect data but also perform on-board processing and trigger alerts if compaction values fall below thresholds specified in the design. This will shift the role of the engineer from manual interpretation to system oversight and decision-making. I am confident that drone technology will become the industry standard for quality assurance in the highway construction sector, providing a stronger foundation for the smart transportation infrastructure of the future. The convergence of aerial robotics and advanced sensing is not just improving how we build roads; it is redefining the very standards of quality and safety in modern civil engineering.