
Intelligent transportation systems are fundamentally shaped by the need for efficient, accurate, and flexible traffic monitoring. Among the most persistent challenges is the detection of speeding vehicles, a primary contributor to severe road traffic accidents. Traditional ground-based methods such as inductive loops, microwave radar, and fixed video surveillance, while mature, suffer from high deployment costs, maintenance difficulties, and blind spots that leave significant portions of the road network unmonitored. In recent years, the advent of drone technology has offered a paradigm shift. The inherent advantages of drone technology—namely its high maneuverability, wide field of view, rapid deployment flexibility, and independence from terrain constraints—have positioned it as a cornerstone for next-generation traffic parameter extraction and violation enforcement within the intelligent transportation ecosystem. This paper presents a novel method for vehicle speed detection from monocular UAV video, addressing the critical challenge of converting 2D image coordinates to 3D physical world measurements while mitigating the noise inherent in visual tracking.
Methodology: Monocular Vision Coordinate Mapping
The core of monocular speed estimation lies in establishing a precise geometric mapping between the 2D image plane and the 3D physical world. My approach begins with the pinhole camera model, which describes how a point in 3D space projects onto a 2D image sensor. The transformation from the world coordinate system to the pixel coordinate system can be expressed with the following equation, where both intrinsic and extrinsic camera parameters are involved:
$$
\begin{bmatrix} u \\ v \\ 1 \end{bmatrix} = \frac{1}{Z_c} \mathbf{M}_{int} \mathbf{M}_{ext} \begin{bmatrix} X_w \\ Y_w \\ Z_w \\ 1 \end{bmatrix}
$$
In this equation, Z_c represents the depth information, which is the primary source of ambiguity in monocular vision. To resolve this, I introduce the road plane assumption, a key constraint for traffic monitoring. Since a vehicle in motion is considered to be traveling on a flat road surface, the Z_w component of its world coordinates can be assumed to be zero. This crucial constraint allows the 3×4 projection matrix to be reduced to a 3×3 homography matrix (H). The homography matrix establishes a direct one-to-one mapping between the road plane and the image plane, bypassing the need for complex 3D reconstruction. The reduced transformation can be expressed as:
$$
\begin{bmatrix} u \\ v \\ 1 \end{bmatrix} = s \mathbf{H} \begin{bmatrix} X_w \\ Y_w \\ 1 \end{bmatrix}
$$
The homography matrix H has 8 degrees of freedom. To solve for H, it is necessary to identify at least four non-collinear point correspondences between the image and the physical world. For my method, I leverage the geometric priors provided by standard road markings. Known dimensions, such as lane widths (e.g., 3.5 m or 3.75 m) and the lengths and gaps of dashed lane lines, serve as readily available calibration references. By manually selecting four key feature points on lane markings in the UAV image that form a rectangle of known physical dimensions in the real world, I can construct a virtual calibration area. The four corner points of this rectangle provide the necessary point pairs to solve for the homography matrix H. The inverse of this matrix, H^{-1}, is then used to transform the pixel coordinates of a vehicle’s detection bounding box into precise physical coordinates (X_w, Y_w). This coordinate mapping method effectively eliminates perspective distortion from the UAV’s oblique angle, providing a robust metric foundation for distance calculation.
Vehicle Speed Calculation and Trajectory Smoothing Model
While the homographic mapping converts pixel coordinates to physical coordinates, directly computing instantaneous speed from the displacement between consecutive frames leads to significant noise. This noise originates from the inherent pixel-level jitter of the visual detection bounding box, which is amplified by the geometric transformation. To overcome this, I developed a vehicle speed calculation model that integrates a multi-frame differencing strategy with a moving average filter. This approach aims to extract the true physical motion trend while effectively suppressing high-frequency detection noise. The process begins by assigning a unique identity (ID) to each tracked vehicle. For a vehicle at frame t, its world coordinate is P_t = (X_t, Y_t). Instead of measuring displacement between adjacent frames, I employ a cross-frame differencing strategy. The physical displacement D_{t, t-k} over an interval of k frames is calculated as:
$$
D_{t, t-k} = \sqrt{(X_t – X_{t-k})^2 + (Y_t – Y_{t-k})^2}
$$
The instantaneous velocity V_inst is then derived by dividing this displacement by the corresponding time interval, which is given by the frame rate f of the video. The formula for velocity in meters per second is:
$$
V_{inst} = \frac{D_{t, t-k}}{\Delta T} = \frac{D_{t, t-k}}{k / f} = \frac{f \cdot D_{t, t-k}}{k}
$$
To convert this to the standard unit for traffic enforcement, km/h, the following formula is applied:
$$
V_{km/h} = V_{inst} \times 3.6
$$
This cross-frame differencing method provides an initial speed stream. However, to further smooth the signal and suppress random jitter, I implement a moving average filter. This is a time-domain post-processing step that calculates the average of raw speed observations (V_raw) over a sliding window of length N. This filter effectively attenuates high-frequency noise and provides a smoother, more representative speed curve, V_smooth. The smoothing operation is defined as:
$$
V_{smooth}(t) = \frac{1}{N} \sum_{j=0}^{N-1} V_{raw}(t – j)
$$
The selection of the window size N is a critical trade-off. A larger N provides stronger noise attenuation but introduces a greater response lag to actual speed changes. Additionally, I have incorporated a logical gating mechanism. This filter identifies and discards outlier speed values that exceed a plausible physical limit (e.g., vehicle acceleration exceeding a realistic threshold). For such cases, the calculation is replaced with a weighted combination of the previous smoothed value and the current measurement. The final corrected speed V*_smooth is given by:
$$
V^{*}_{smooth}(t) = \alpha \cdot V_{smooth}(t-1) + \beta \cdot V_{smooth}(t)
$$
where α + β = 1. This weighted approach prevents large, unrealistic jumps from corrupting the velocity data stream.
Field Validation and Overspeed Detection Logic
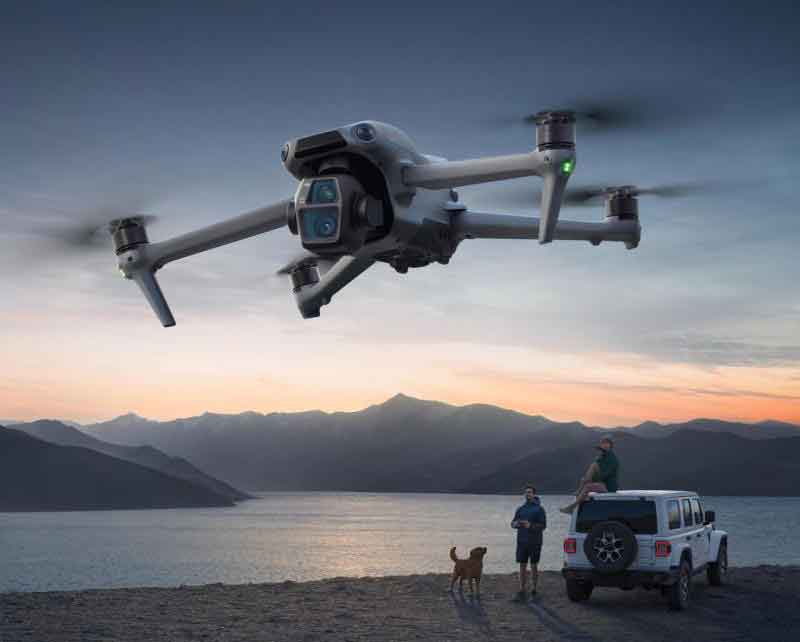
I conducted a comprehensive field test to validate the accuracy of my proposed method. The experiment was set up on a campus road with clear lane markings to satisfy the road plane assumption. The test platform consisted of a DJI Matrice 350 RTK quadcopter UAV, which hovered over the test section to capture video at 30 fps. For ground truth data, a test vehicle was equipped with a high-precision onboard GPS speed measurement device. The vehicle traversed the test route at various speeds, and data from both the UAV and the GPS were collected synchronously. The key hardware parameters are summarized in the table below.
| Hardware Component | Parameter | Value |
|---|---|---|
| UAV (DJI Matrice 350 RTK) | Dimensions (Unfolded, no propeller) | 810mm x 670mm x 430mm |
| Max Takeoff Mass | 9.2 kg | |
| Max Horizontal Flight Speed | 23 m/s | |
| Camera Resolution / Frame Rate | 1080p / 30 fps | |
| Ground Truth GPS | Sampling Rate | 1 Hz (with interpolation) |
| Purpose | Provide reference vehicle speed |
The raw GPS data exhibited a stepped, discretized output due to its 1 Hz sampling rate. To align this with the 30 fps video for a fair comparison, the GPS data was interpolated and smoothed to reconstruct a continuous ground truth curve. The performance of my speed detection algorithm was then evaluated against this refined ground truth. The results for three distinct test cases with different driving conditions are presented in the table below.
| Test Case | Average Speed (km/h) | Mean Absolute Error (MAE) (km/h) | Root Mean Square Error (RMSE) (km/h) | Mean Absolute Percentage Error (MAPE) (%) |
|---|---|---|---|---|
| 1 | 47.47 | 0.87 | 1.01 | 2.13 |
| 2 | 31.72 | 0.93 | 1.08 | 3.40 |
| 3 | 49.45 | 0.83 | 0.99 | 2.00 |
The evaluation metrics demonstrate the high precision of the proposed method. Across all test cases, the overall Mean Absolute Error (MAE) was approximately 0.89 km/h, and the Mean Absolute Percentage Error (MAPE) remained below 4%. This level of accuracy underscores the effectiveness of the homography-based coordinate mapping and the trajectory smoothing model in mitigating noise.
Building on this high-precision speed measurement, I designed an automated logic for detecting speeding violations. To minimize false alarms caused by transient measurement errors, I implemented a dual-layer decision strategy. The first layer is a multi-frame confirmation mechanism. A speeding event is only triggered when the smoothed speed (V_smooth) of a vehicle exceeds a trigger threshold for a continuous sequence of N frames (e.g., N=10, which corresponds to approximately 0.3 seconds). The second layer incorporates a fault-tolerant threshold for the speed limit. Given a posted speed limit (V_limit), the trigger speed is calculated as:
$$
V_{trigger} = V_{limit} \times (1 + \alpha)
$$
where α is a tolerance coefficient, typically set to 20%. This accounts for measurement error and legal leniency. The logic distinguishes between “critical speeding” (V_limit < V_smooth ≤ V_trigger) and “significant speeding” (V_smooth > V_trigger), allowing for a graduated enforcement response. Upon confirmation of a violation, the system automatically captures a frame from the video, overlays the vehicle’s bounding box, ID, and measured speed, and saves it as evidence. This entire workflow, from video input to evidence storage, demonstrates a practical application of drone technology for automated traffic law enforcement. The precision and robustness of the method highlight the powerful synergy between advanced image processing and drone technology, paving the way for more flexible and efficient traffic management systems. The capacity of modern drone technology to combine high mobility with sophisticated on-board computation is the key enabler for the system described in this work.
Conclusion
In this work, I have presented a robust and accurate method for vehicle speed detection using monocular video from a UAV. The approach overcomes the critical limitations of monocular vision by leveraging a road plane assumption and standard road markings for a direct homographic transformation, effectively bypassing the need for complex 3D calibration. I further developed a sophisticated trajectory smoothing model that fuses cross-frame differencing with moving average filtering to significantly suppress the detrimental effects of detection box jitter, producing a stable and reliable speed estimation. My field test results, validated against a high-fidelity GPS ground truth, demonstrate a Mean Absolute Error of 0.89 km/h and a relative error below 4%. Based on this high accuracy, I designed an automated speeding detection and evidence capture system with a multi-frame confirmation and fault-tolerant logic to minimize false alarms. The conclusion is that this method provides a highly accurate, low-cost, and flexible alternative to traditional fixed sensor systems. The integration of advanced computer vision algorithms with drone technology unlocks new potential for temporary traffic monitoring, incident response, and comprehensive traffic law enforcement, contributing significantly to the realization of smart and safe transportation systems.