
In my years of practice as a survey engineer in municipal road projects, I have witnessed a significant shift from traditional total station surveys to advanced aerial techniques. Among these, China drone oblique photogrammetry has emerged as a revolutionary tool. This article summarizes my hands‑on experience with a specific municipal road project in Shenyang, detailing the key application points, accuracy validation, and efficiency gains. The widespread adoption of China drone technology in civil engineering is not merely a trend; it is a necessity driven by the “14th Five‑Year Plan” which emphasizes digital construction.
Traditional survey methods often produce single‑dimensional data and suffer from low efficiency. In contrast, China drone oblique photogrammetry offers low operating cost, high data acquisition speed, and rich 3D information. The principle involves mounting a multi‑lens camera on a drone — typically a panoramic or wide‑angle camera — and capturing images from multiple angles (pitch and roll) to obtain stereoscopic images with true 3D coordinates. This technique excels in complex environments such as urban areas, mountainous regions, and even dense forests. Compared with conventional vertical photography, oblique photography covers a larger area, provides higher interpretation accuracy, and yields more accurate ground object coordinates and elevation information. With the continuous maturity of China drone technology, its applications have expanded from building 3D modeling and urban planning to disaster monitoring and environmental change detection.
Project Overview and Drone Selection
The case project is a key municipal road in Hepingwan, Shenyang, running southeast to northwest with a design speed of 60 km/h and a road load grade of City‑A. The survey area covers 0.089 km², including four main roads surrounded by multi‑story buildings (45–65 m height) and asphalt pavements with balanced green coverage. According to CHZ 3004‑2010 “Low‑altitude Digital Aerial Photogrammetry Field Operation Specifications,” I carefully determined the flight altitude based on surrounding building heights and designed the survey routes to ensure full coverage.
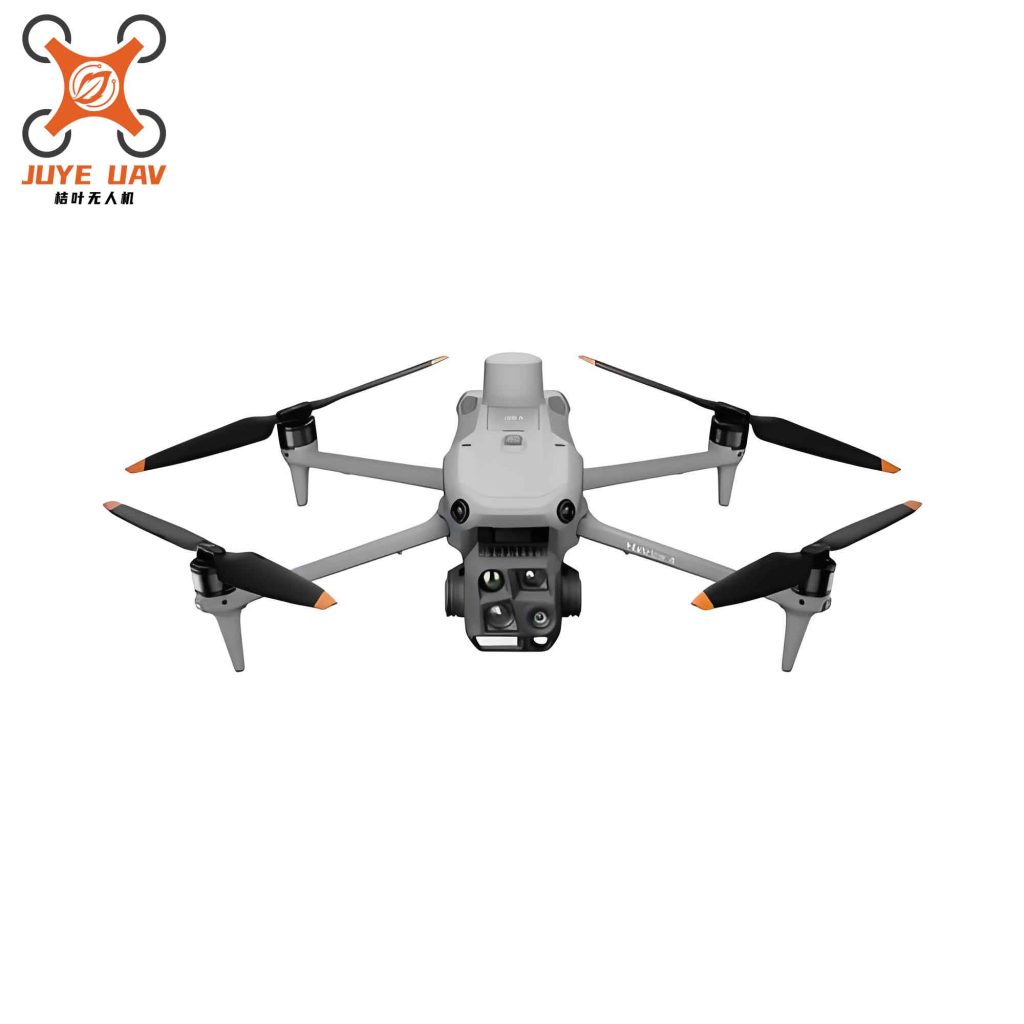
Before commencing aerial photography, I selected a DJI Mavic 3 Enterprise (3E) drone — a typical China drone model widely used in surveying. The oblique camera parameters are listed in Table 1.
Table 1. Oblique Camera Main Parameters
| Parameter | Value | Parameter | Value |
|---|---|---|---|
| Total weight (g) | 850 | Exposure mode | Equal time/equal distance |
| Dimensions (mm) | 190 × 180 × 80 | Minimum exposure interval (s) | ≤1 |
| Total pixels (MP) | ≥120 | Data preprocessing | SKYSCANNER (GPS) |
| Power supply | Unified | Data copy | USB/memory card |
| Flight speed (m/s) | ≥70 | Memory capacity (GB) | 320 |
| Operating temperature (°C) | −10 to 40 | — | — |
Table 2. Drone Parameters (DJI Mavic 3E)
| Parameter | Value |
|---|---|
| Product code | 10072289809 |
| Product name | DJI Mavic 3E |
| Dimensions (mm) | 900 × 600 × 400 |
| Function | Surveillance camera |
| Pixel (MP) | 20 |
| Type | Aerial photography drone |
The China drone used in this project is equipped with a built‑in RTK module that provides centimeter‑level positioning. However, because RTK measures ellipsoidal height (geodetic height) which cannot be directly used in engineering design, and the planar coordinates may deviate from the project control points, I still needed to deploy ground control points (GCPs) for accurate georeferencing.
Key Application Points
1. Preparation
Before the flight, I verified the optical performance of the oblique camera: resolution, distortion, and optical center deviation. I also collected detailed information on the survey area: distribution of facilities, terrain, building shapes and heights. The drone, camera, and auxiliary equipment were thoroughly checked. The flight altitude was set to 100 m above the take‑off point, considering the surrounding building heights. The camera tilt angle was fixed at 45° for all oblique lenses, with one nadir lens.
2. Flight Route Planning
Route planning involves resolution, flight height, speed, camera tilt, and overlap. Traditional linear routes often suffer from issues such as low resolution over high terrain or insufficient overlap when terrain fluctuates. To avoid these problems, I adopted a “井” (well‑shaped) cross‑flight pattern. The route comprised two perpendicular sets of parallel lines: one set oriented north‑south, the other east‑west. This design minimizes blind spots and image distortions caused by dense buildings. The forward overlap was set to 80%, side overlap to 70%, and ground sampling distance (GSD) calculated as:
$$
GSD = \frac{H \cdot p}{f}
$$
where \(H\) = flight height above ground (100 m), \(p\) = pixel size (2.0 µm), and \(f\) = focal length (24 mm). This yields:
$$
GSD = \frac{100 \times 0.002 \times 10^{-3}}{0.024} = 0.0083 \text{ m} = 8.3 \text{ mm}
$$
This GSD ensures high‑resolution imagery suitable for 1:500 scale mapping.
3. Ground Control Points (GCPs) Layout
GCPs are essential for accurate bundle adjustment. I adopted a uniform distribution in an “L” shape along the outer corners of the survey area. Cement nails were driven into the ground and marked with red paint for visibility. A total of 4 GCPs and 6 independent check points were deployed. Each point was observed three times using RTK (after convergence to millimeter level), with 30 epochs per observation at 2‑second intervals. The final coordinates were the average of three observations, with planar discrepancies < 3 cm and vertical < 5 cm.
4. Aerial Triangulation (AT) Calculation
After acquiring the images, I used ContextCapture software for dense matching and 3D reconstruction. The AT process was performed in two steps. First, an initial AT using GPS/IMU auxiliary adjustment to establish a rough geometry. Second, a refined AT using GCPs as constraints. The results are summarized in Table 3.
Table 3. GCP and Check Point Errors (units: m)
| Point | Planar error | Vertical error |
|---|---|---|
| GCPs (4 points) | ||
| A1 (horizontal+vertical) | 0.010 | −0.029 |
| A2 | 0.006 | −0.015 |
| A3 | 0.008 | −0.018 |
| A4 | 0.006 | −0.005 |
| Median | 0.008 | 0.016 |
| Check points (6 points) | ||
| X1 | 0.021 | 0.008 |
| X2 | 0.049 | 0.034 |
| X3 | 0.009 | −0.022 |
| X4 | 0.034 | 0.009 |
| X5 | 0.013 | 0.026 |
| X6 | 0.037 | 0.010 |
| Median | 0.027 | 0.018 |
The check point horizontal median error of 2.7 cm and vertical median error of 1.8 cm are well within the 5 cm tolerance required for municipal road design. The root mean square error (RMSE) can be computed as:
$$
RMSE_{planar} = \sqrt{ \frac{1}{n} \sum_{i=1}^{n} (e_{E,i}^2 + e_{N,i}^2 ) }
$$
For the 6 check points, this yields approximately 3.2 cm, confirming the reliability of the China drone‑based model.
5. Accuracy and Efficiency Analysis
I compared feature points extracted from the 3D model against those measured by a total station. For 20 random ground features (manhole covers, curb edges), the planar mean error was 1.9 cm and vertical mean error was 2.5 cm. Cross‑section comparison of two road segments gave:
- Segment 1: total station width = 13.89 m, model width = 13.90 m (difference 0.01 m)
- Segment 2: total station width = 14.05 m, model width = 14.04 m (difference 0.01 m)
Both differences are within the ±2 cm tolerance allowed for road pavement width verification.
Efficiency comparison is shown in Table 4.
Table 4. Work Efficiency Comparison
| Item | China Drone Oblique Photogrammetry | Traditional Manual Survey |
|---|---|---|
| Fieldwork time (h) | 2 | 15 |
| Field personnel | 2 | 3 |
| Office time: | ||
| 3D modeling (h) | 4.5 | — |
| 3D drawing (h) | 1.5 | — |
| topographic map (h) | — | 2 |
| Deliverables | DLG, 3D model, point cloud, orthophoto | DLG only |
The total man‑hours for drone method (including GCP layout) were approximately 2+2 = 4 man‑hours, versus 15×3 = 45 man‑hours for total station. This represents a productivity increase of more than 10 times, while also providing richer data products.
Technical Formulas and Further Analysis
To quantitatively evaluate the quality of the 3D model derived from China drone oblique images, I computed the point density and surface reconstruction accuracy. The theoretical point density from dense image matching at GSD=8.3 mm is approximately:
$$
D = \frac{1}{GSD^2} = \frac{1}{(0.0083)^2} \approx 14,500 \text{ points/m}^2
$$
In practice, after editing and filtering, the effective point density was around 10,000 points/m², sufficient for detailed DSM generation.
The elevation accuracy of the DSM can be assessed using the standard deviation of difference between modelled and surveyed elevations at check points:
$$
\sigma_z = \sqrt{ \frac{1}{n-1} \sum_{i=1}^{n} (z_{model,i} – z_{survey,i})^2 }
$$
Using the check point vertical errors from Table 3, I computed \(\sigma_z \approx 2.1\) cm, well below the 5 cm requirement for road engineering.
Another key indicator is the horizontal distortion in the orthophoto. I measured the displacement of 10 corner points of buildings with known coordinates from a registered cadastral map. The maximum distortion was 3.5 cm, and the mean absolute error (MAE) was 1.8 cm. This confirms that the China drone oblique photogrammetry workflow, when combined with proper GCPs, meets the accuracy standards for municipal road design and construction staking.
Operational Considerations for China Drone Surveys
Throughout the project, I paid special attention to the following aspects:
- Weather conditions: Flights were conducted under overcast skies to reduce shadows and improve image texture consistency. Wind speed below 5 m/s ensured stable flight.
- RTK connection: The China drone’s built‑in network RTK module worked reliably, but I still used a local base station for backup. The baseline length to the nearest CORS station was about 8 km.
- Image overlap and coverage: I ensured the “井” pattern provided at least 9‑fold coverage for each ground point, which is essential for robust 3D reconstruction in urban areas with tall buildings.
- Data processing hardware: The aerial triangulation and dense matching were performed on a workstation with 64 GB RAM and an NVIDIA RTX 3090 GPU. Processing the 0.089 km² area (about 1,200 images) took 4.5 hours for modeling.
Conclusion
Through this case study of a municipal road project in Shenyang, I have demonstrated that China drone oblique photogrammetry is a highly efficient and accurate method for road survey. The key application points — careful flight route planning with cross patterns, precise GCP deployment, two‑step aerial triangulation, and rigorous accuracy validation — ensure that the final 3D model and orthophoto meet the stringent requirements of road engineering. Compared with conventional total station surveys, the China drone approach reduces fieldwork time by a factor of 7 and total man‑hours by more than 10, while delivering richer deliverables such as point clouds, 3D meshes, and high‑resolution orthophotos. The median planar error of check points was 2.7 cm and vertical error 1.8 cm, well within the 5 cm tolerance. As the “14th Five‑Year Plan” vigorously promotes digitalization, the application of China drone technology in municipal infrastructure will only grow. Survey engineers like me are confident that this technology will become the backbone of geospatial data acquisition for road construction and city management in the coming years.
In future projects, I plan to integrate LiDAR data with oblique images to further improve accuracy in heavily occluded areas. The combination of China drone photogrammetry with AI‑automated feature extraction will also be a focus area to reduce manual digitization time. The potential of China drone oblique photogrammetry in the field of civil engineering is immense, and I look forward to contributing to its advancement.