
The rapid invasion of Spartina alterniflora into coastal wetlands represents a significant ecological shift, fundamentally altering vegetation structure and consequently disrupting the delicate input-output balance of soil organic carbon (SOC). This disruption directly impacts the carbon sequestration potential of these critical ecosystems. Accurate assessment and spatial prediction of Soil Organic Carbon Density (SOCD) are therefore paramount for understanding carbon cycle dynamics and informing management strategies. Traditional soil surveys, reliant on point sampling and laboratory analysis, are precise but labor-intensive, time-consuming, and often impractical in inaccessible or environmentally sensitive areas like marshes and mudflats. In this context, remote sensing technologies offer a powerful alternative, enabling large-scale, repeatable, and non-invasive monitoring.
My research explores the potential of unmanned drone (UAV) remote sensing, distinguished by its high spatial resolution, operational flexibility, and rapid data acquisition capabilities, to predict SOCD in a S. alterniflora-invaded coastal wetland. I hypothesize that a hybrid modeling framework combining advanced machine learning (ML) algorithms with geostatistical interpolation can significantly enhance prediction accuracy by leveraging both the spectral-environmental correlations captured by ML and the spatial autocorrelation inherent in soil properties.
1. Materials and Methodological Framework
1.1 Study Area and Soil Sampling
The study was conducted in a coastal wetland area where S. alterniflora has become the dominant species, displacing native vegetation. A total of 161 georeferenced soil samples were collected from the 0-30 cm layer. In the laboratory, SOC content was determined, and soil bulk density (BD) was measured. SOCD, expressed in kg m-2, was calculated using the foundational formula:
$$SOCD = SOC \times BD \times H \times 10^{-1}$$
where \(SOC\) is the soil organic carbon content (g kg-1), \(BD\) is the soil bulk density (g cm-3), and \(H\) is the soil layer thickness (m).
1.2 Unmanned Drone Data Acquisition and Processing
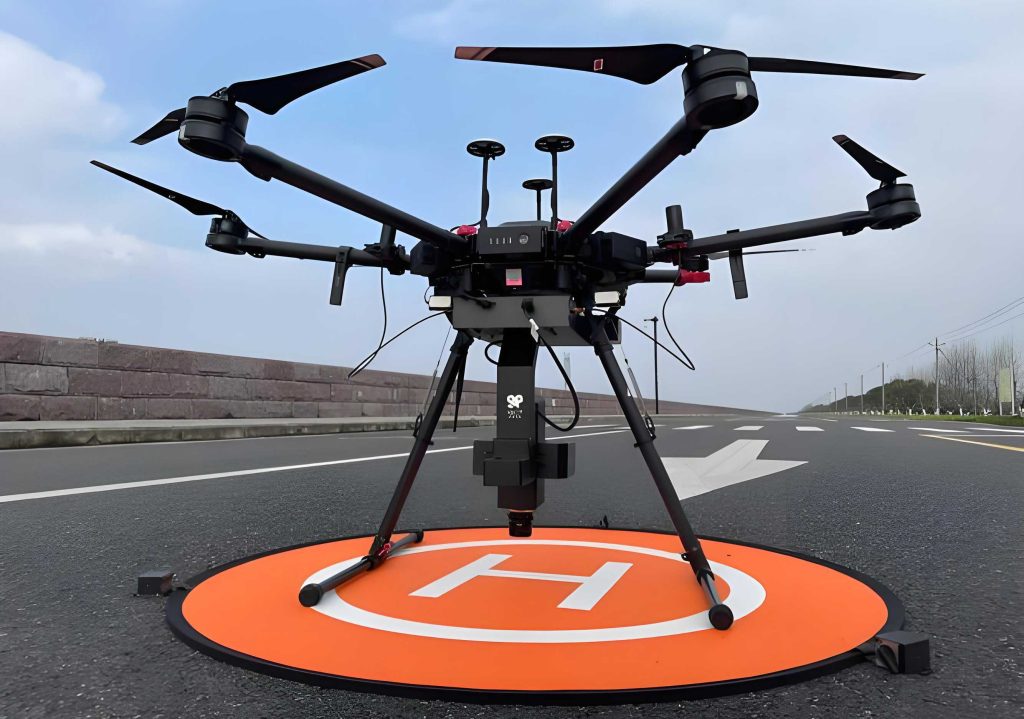
A multirotor unmanned drone equipped with a multispectral sensor was deployed to capture image data. The sensor collected reflectance data across five key spectral bands, as detailed in Table 1.
| Spectral Band | Center Wavelength (nm) | Bandwidth (nm) |
|---|---|---|
| Blue (B) | 450 | 16 |
| Green (G) | 560 | 16 |
| Red (R) | 650 | 16 |
| Red Edge (RE) | 730 | 16 |
| Near-Infrared (NIR) | 840 | 26 |
Multiple flight missions were executed under optimal conditions. The collected imagery was processed through structure-from-motion photogrammetry software to generate a high-resolution orthomosaic and digital surface model, providing the base data for feature extraction.
1.3 Feature Engineering and Optimization
To fully exploit the information from the unmanned drone imagery, I constructed a comprehensive suite of spectral features. This included the five raw band reflectances and 36 spectral indices, which are mathematical combinations of bands designed to highlight specific biophysical properties (e.g., vegetation vigor, soil brightness). A partial list of constructed indices is shown in Table 2.
| Index Name | Abbreviation | Formula |
|---|---|---|
| Normalized Difference Vegetation Index | NDVI | $$(NIR – Red) / (NIR + Red)$$ |
| Enhanced Vegetation Index | EVI | $$2.5 \times \frac{(NIR – Red)}{(NIR + 6 \times Red – 7.5 \times Blue + 1)}$$ |
| Normalized Difference Red Edge Index | NDRE | $$(NIR – RE) / (NIR + RE)$$ |
| Brightness Index | BI | $$\sqrt{(Red^2 + Green^2 + NIR^2)}$$ |
| Green Normalized Difference Vegetation Index | GNDVI | $$(NIR – Green) / (NIR + Green)$$ |
| Normalized Green-Red Difference Index | NGRDI | $$(Green – Red) / (Green + Red)$$ |
To mitigate the curse of dimensionality and identify the most predictive features, I employed the Boruta algorithm—a robust wrapper method built around the Random Forest algorithm. Boruta creates “shadow” features by shuffling original features and iteratively compares the importance of real features against these random shadows, retaining only those that consistently show higher importance.
1.4 Predictive Modeling Approach
The core of my analysis involved building and comparing several predictive models. The dataset was split into 70% for training and 30% for independent validation.
1.4.1 Machine Learning Models
Three powerful tree-based ML algorithms were implemented and tuned via grid search with 10-fold cross-validation:
- Random Forest (RF): An ensemble of decorrelated decision trees, offering high robustness and resistance to overfitting.
- Extreme Gradient Boosting (XGBoost): A scalable, regularized gradient boosting framework that optimizes a differentiable loss function, known for its speed and performance.
- Boosted Regression Trees (BRT): A gradient boosting method that combines many simple trees to improve predictive performance by sequentially modeling residuals.
1.4.2 Hybrid Residual Kriging (RK) Models
To incorporate spatial dependency, I enhanced the best-performing ML models using Residual Kriging. This hybrid approach decomposes the spatial prediction into a deterministic trend and a stochastic residual:
$$Z_{RK}(s_0) = m_{ML}(s_0) + \delta_{OK}(s_0)$$
where \(Z_{RK}(s_0)\) is the final hybrid prediction at location \(s_0\), \(m_{ML}(s_0)\) is the prediction from the ML model (the deterministic trend), and \(\delta_{OK}(s_0)\) is the interpolated residual obtained by applying Ordinary Kriging (OK) to the ML model’s prediction errors. This yielded three hybrid models: RF-RK, XGBoost-RK, and BRT-RK.
1.4.3 Model Evaluation Metrics
Model performance was assessed using three key metrics on the validation set:
- Coefficient of Determination (R²): Measures the proportion of variance explained.
$$R^2 = 1 – \frac{\sum_{i=1}^{n}(y_i – \hat{y}_i)^2}{\sum_{i=1}^{n}(y_i – \bar{y})^2}$$ - Normalized Root Mean Square Error (nRMSE): A scale-independent measure of prediction error.
$$nRMSE = \frac{\sqrt{\frac{1}{n}\sum_{i=1}^{n}(y_i – \hat{y}_i)^2}}{(\bar{y}_{max} – \bar{y}_{min})}$$ - Ratio of Performance to Interquartile Range (RPIQ): Useful for non-normally distributed data, with higher values indicating better performance.
$$RPIQ = \frac{IQR}{RMSE} = \frac{Q_3 – Q_1}{\sqrt{\frac{1}{n}\sum_{i=1}^{n}(y_i – \hat{y}_i)^2}}$$
where \(y_i\) is the measured value, \(\hat{y}_i\) is the predicted value, \(\bar{y}\) is the mean of measured values, and \(IQR\) is the interquartile range (\(Q_3 – Q_1\)).
2. Results and Analysis
2.1 Optimal Feature Set
The Boruta feature selection process successfully identified a subset of 30 features as important for SOCD prediction. This optimal set included all five raw spectral bands from the unmanned drone (Blue, Green, Red, Red Edge, NIR) and a diverse selection of 25 spectral indices, such as BI, NDVI, EVI, NDRE, and NGRDI. This outcome underscores the value of both direct spectral reflectance and derived composite indices captured by the high-resolution unmanned drone sensor.
2.2 Model Performance Comparison
The predictive performance of the standalone ML models and their RK-enhanced hybrids is comprehensively summarized in Table 3.
| Model Type | Model | Validation R² | Validation nRMSE | Validation RPIQ |
|---|---|---|---|---|
| Standalone ML | Random Forest (RF) | 0.540 | 0.196 | 1.659 |
| XGBoost | 0.530 | 0.197 | 1.657 | |
| Boosted Regression Trees (BRT) | 0.520 | 0.203 | 1.610 | |
| Hybrid (ML+RK) | RF-RK | 0.814 | 0.164 | 1.987 |
| XGBoost-RK | 0.757 | 0.176 | 1.857 | |
| BRT-RK | 0.720 | 0.199 | 1.636 |
The results clearly demonstrate two key findings. First, among the standalone ML models, RF achieved the highest performance (R² = 0.540), slightly outperforming XGBoost and BRT. Second, and more significantly, integrating Residual Kriging led to a dramatic improvement in predictive accuracy for all algorithms. The RF-RK hybrid model was the top performer, explaining 81.4% of the SOCD variance (R² = 0.814), which represents an approximate 50.7% relative increase in explanatory power over the standalone RF model. The nRMSE decreased and the RPIQ increased correspondingly, confirming the superior and more robust performance of the hybrid approach. The ability of the unmanned drone-derived features to feed into such high-accuracy models is notable.
2.3 Feature Importance Analysis
Analyzing the relative importance of features within each ML model revealed both shared and algorithm-specific patterns, as illustrated in Table 4. While the ranking differed, certain features consistently emerged as critical across all models, including the Brightness Index (BI), Blue band reflectance, NIR band reflectance, Red band reflectance, and the Enhanced Vegetation Index (EVI). This consistency underscores their fundamental role in SOCD prediction within this ecosystem.
| Rank | Random Forest (RF) | XGBoost | Boosted Regression Trees (BRT) |
|---|---|---|---|
| 1 | NGRDI | Blue Band | NGRDI |
| 2 | NDRE Index | NIR Band | RDVI Index |
| 3 | Brightness Index (BI) | Green Band | DVI Index |
| 4 | Blue Band | EVI Index | NIR Band |
| 5 | EVI Index | Brightness Index (BI) | Red Band |
Interestingly, the models differed in their reliance on feature types. The RF model heavily weighted derived indices like NGRDI and NDRE. XGBoost placed the highest importance on raw spectral bands, particularly Blue and NIR. BRT demonstrated a more balanced utilization of both indices and raw bands. This analysis confirms that both the direct spectral information and the synthesized information from indices obtained by the unmanned drone are valuable, offering complementary signals for the prediction task.
2.4 Spatial Distribution of Predicted SOCD
Using the optimal RF-RK model, a high-resolution spatial map of SOCD was generated. The predicted SOCD values ranged from 0.250 to 7.715 kg m-2. The map revealed a distinct spatial gradient, with higher SOCD values generally found in landward areas and lower values extending towards the sea. Crucially, the model identified localized depressions in SOCD associated with tidal creeks and drainage channels. These areas are subject to stronger hydrological forces, longer inundation periods, and higher salinity, which inhibit the establishment and growth of S. alterniflora. Consequently, the input of organic matter from vegetation is reduced, leading to lower carbon accumulation. This detailed spatial pattern, resolvable only through the high-resolution data from the unmanned drone, provides clear evidence of how micro-topography and hydrology mediate the impact of invasive vegetation on soil carbon stocks.
3. Conclusions
This study successfully demonstrates a robust framework for predicting Soil Organic Carbon Density in a complex coastal wetland environment. The integration of high-resolution multispectral data from an unmanned drone with a hybrid machine learning-geostatistical modeling strategy proved highly effective. The key conclusions are as follows:
- The choice of Machine Learning algorithm significantly influences baseline prediction performance, with Random Forest showing a slight advantage in this specific case. However, the integration of Residual Kriging (RK) to account for spatial autocorrelation in model residuals resulted in a profound improvement in accuracy. The hybrid RF-RK model achieved superior performance (R² = 0.814), validating the strength of combining deterministic and stochastic modeling approaches.
- Feature importance analysis, enabled by the rich data from the unmanned drone, revealed that while different algorithms prioritize different features, a core set—including the Brightness Index (BI), Blue, NIR, and Red band reflectances, and the EVI—were consistently identified as critical predictors of SOCD. This indicates that both soil brightness/background signals and vegetation vigor/cover information are essential for accurate prediction.
- The generated high-resolution SOCD map provides actionable ecological insights. It clearly shows that SOCD is not uniformly distributed but is strongly influenced by local environmental factors such as tidal action and hydrology. Areas like tidal creeks, with conditions less favorable for S. alterniflora growth, exhibit significantly lower carbon density, highlighting the tight coupling between invasive plant dynamics and soil carbon sequestration patterns at fine spatial scales.
In summary, the synergy of unmanned drone remote sensing, feature selection, and hybrid RK modeling offers a powerful, scalable, and precise method for digital soil mapping in coastal wetlands. This approach provides a new, efficient pathway for monitoring carbon stocks under vegetation change, delivering critical data to support the scientific management and conservation of these vital blue carbon ecosystems.