
The contemporary battlespace is increasingly characterized by sophisticated sensor networks designed for persistent surveillance and threat detection. Among these, netted radar systems, which integrate multiple radar nodes to form a cohesive and resilient surveillance picture, present a significant challenge for conventional airborne platforms seeking to operate undetected. In parallel, the technology underpinning large-scale formation drone light show displays—where hundreds of unmanned aerial vehicles (UAVs) execute precise, coordinated flight paths to create complex aerial imagery—has matured considerably. This convergence of technologies suggests a novel paradigm for electronic warfare: utilizing coordinated UAV swarms, or formation drone light show tactics, not for entertainment, but to generate deliberate, dynamic interference patterns against integrated air defense networks. This article delves into the mathematical modeling, simulation, and quantitative analysis of using such UAV formations to degrade the detection performance of netted radar systems, focusing on establishing and maintaining a protected air corridor.
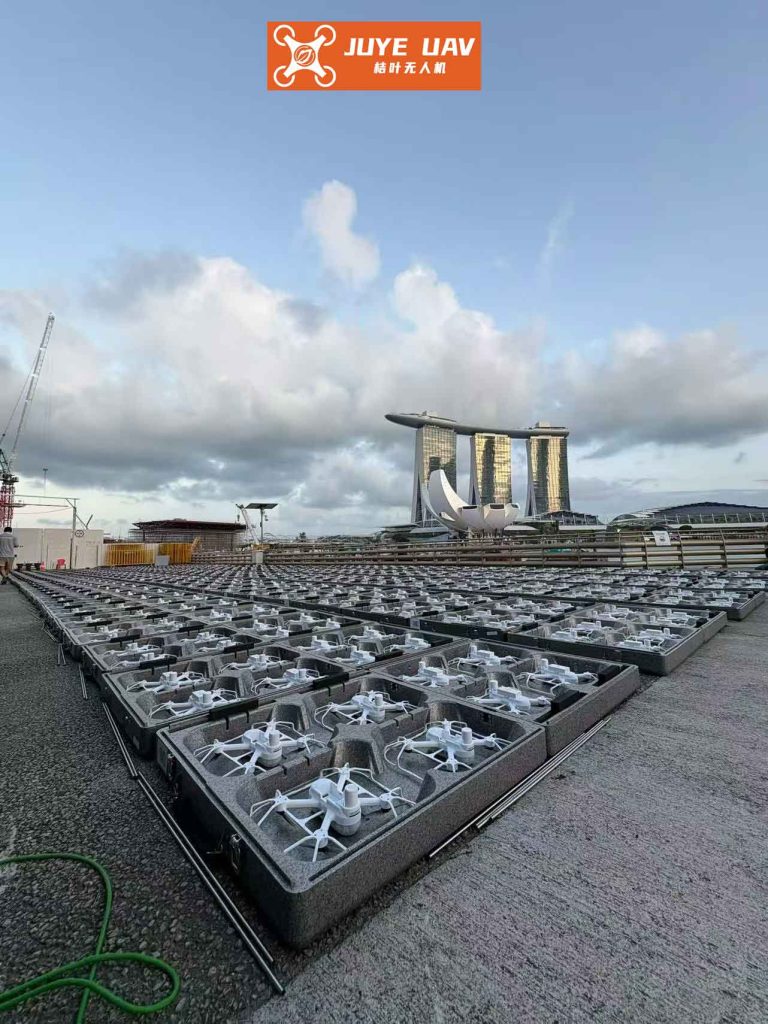
The core principle of a formation drone light show is distributed, coordinated control. When applied to electronic attack, each drone in the formation acts as a node in a distributed jammer network. Unlike a single high-power jammer, a drone swarm can distribute jamming power spatially, engage multiple radar nodes simultaneously from different angles, and adapt its formation in real-time. This approach complicates the netted radar’s anti-jamming strategies, such as sidelobe cancellation and spatial filtering. The objective shifts from completely blinding a single radar to tactically degrading the fused track quality and coverage continuity of the entire network over a specific geographic area, thereby creating a “safe passage” or “protected zone” for friendly assets.
Mathematical Foundation of Drone-Radar Engagement
To analyze the effectiveness of a formation drone light show for radar jamming, we begin with the fundamental radar and jamming power equations, incorporating the dynamics of moving drone positions. Let time be denoted by \( t \). For a target (or friendly aircraft) within the protected zone, the received signal power at a netted radar node is given by the radar range equation:
$$
P_{r}^{t}(t) = \frac{P_t G_t^2(\theta, \phi) \sigma \lambda^2}{(4\pi)^3 R_t^4(t) L_t}
$$
where:
\( P_t \) = Radar transmitter peak power,
\( G_t(\theta, \phi) \) = Radar antenna gain pattern (a function of azimuth \( \theta \) and elevation \( \phi \)),
\( \sigma \) = Target’s Radar Cross Section (RCS),
\( \lambda \) = Radar wavelength,
\( R_t(t) \) = Distance from radar to target at time \( t \),
\( L_t \) = Radar system losses.
A formation drone light show comprising \( N \) jamming UAVs will contribute a combined noise jamming power at the same radar receiver. Assuming non-coherent power addition of jamming signals, the total received jamming power is:
$$
P_{r}^{j}(t) = \sum_{i=1}^{N} \frac{P_{ji} G_{ji} G_t(\theta – \theta_{ji}(t), \phi – \phi_{ji}(t)) \lambda^2 \gamma_j \Delta f_r}{(4\pi R_{ji}(t))^2 L_{ji} \Delta f_{ji}}
$$
where for the \( i^{th} \) jammer drone:
\( P_{ji} \) = Jammer transmit power,
\( G_{ji} \) = Jammer antenna gain towards the radar,
\( \theta_{ji}(t), \phi_{ji}(t) \) = Angular position of the jammer relative to the radar’s boresight at time \( t \),
\( R_{ji}(t) \) = Distance from radar to the \( i^{th} \) jammer at time \( t \),
\( \gamma_j \) = Polarization mismatch loss,
\( \Delta f_r \) = Radar receiver bandwidth,
\( \Delta f_{ji} \) = Jammer noise bandwidth,
\( L_{ji} \) = Jammer system losses.
The critical metric for successful noise suppression is the jammer-to-signal ratio (JSR) or the inverse of the suppression coefficient \( K \). For effective blanket jamming, the received jamming power must exceed the target signal power by a factor \( K \), which is typically in the range of 0.1 to 10 (or -10 dB to +10 dB) depending on the radar’s processing gain and the desired detection probability degradation.
$$
K \leq \frac{P_{r}^{j}(t)}{P_{r}^{t}(t)}
$$
Substituting the power equations and solving for the maximum range \( R_{max}(t, \theta, \phi) \) at which the radar can detect a target in the direction \( (\theta, \phi) \) under jamming from the formation drone light show, we get the fundamental equation for the radar’s burn-through range or reduced detection contour:
$$
R_{max}(t, \theta, \phi) = \sqrt[4]{\frac{P_t G_t^2(\theta, \phi) \sigma}{K (4\pi) L_t \sum_{i=1}^{N} \frac{P_{ji} G_{ji} G_t(\theta – \theta_{ji}(t), \phi – \phi_{ji}(t)) \Delta f_r}{(4\pi R_{ji}(t))^2 L_{ji} \Delta f_{ji}}}}
$$
This equation reveals the leverage points for the drone formation: reducing \( R_{ji}(t) \) (getting closer), maximizing the product \( P_{ji}G_{ji} \), and most importantly, positioning drones so that their jamming signal enters the radar’s main lobe (where \( G_t \) is highest). A well-coordinated formation drone light show strategy actively manages these parameters over time.
System Modeling and Scenario Definition
We model a representative scenario involving a netted radar system protecting a critical area and a UAV swarm tasked with establishing a protected corridor. The following parameters are defined for simulation.
| System Component | Parameter | Value / Description |
|---|---|---|
| Netted Radar Nodes | Configuration | Three radars (A, B, C) in a triangular layout. |
| Radar A (S-band) | \( f=2.8 \text{GHz}, P_t=500 \text{kW}, G_{t,max}=38 \text{dB} \), Main Beamwidth=3° | |
| Radar B (S-band) | \( f=3.2 \text{GHz}, P_t=500 \text{kW}, G_{t,max}=37 \text{dB} \), Main Beamwidth=4° | |
| Radar C (L-band) | \( f=1.5 \text{GHz}, P_t=800 \text{kW}, G_{t,max}=35 \text{dB} \), Main Beamwidth=5° | |
| Fusion Logic | Union of individual detection volumes (\( \Omega_{\Sigma} = \Omega_A \cup \Omega_B \cup \Omega_C \)). | |
| Baseline Un-jammed Range | ~350-400 km for a 1 m² RCS target. | |
| Formation Drone Light Show (Jammer Swarm) | Number of UAVs (N) | 8 |
| Jammer Power (\(P_{ji}\)) | 15 W per drone | |
| Jammer Antenna Gain (\(G_{ji}\)) | 3 dBi (Omni-directional or wide-beam) | |
| Jammer Bandwidth (\( \Delta f_{ji} \)) | 200 MHz (Barrage noise) | |
| Platform Dynamics | Constant velocity, coordinated waypoint following. | |
| Engagement Scenario | Protected Area | Rectangular corridor: 90 km (width) × 160 km (length). |
| Primary Metric | Area Protection Ratio (APR): \( \eta(t) = \frac{A_{protected}(t)}{A_{total}} \times 100\% \) |
The Area Protection Ratio \( \eta(t) \) is computed via Monte Carlo integration. At each time step \( t \), thousands of test points are randomly sampled within the designated corridor. For each point, the JSR condition is checked against all netted radars. If the point is within the reduced detection contour (where JSR > 1/K) of any radar, it is considered “exposed.” Otherwise, it is “protected.” The ratio of protected points to total points defines \( \eta(t) \). This metric directly quantifies the operational effectiveness of the formation drone light show.
Analysis of Formation Strategies and Interference Effects
The effectiveness of the jamming swarm is highly dependent on its geometric formation and flight path relative to the radar net. We analyze two distinct radar deployments and corresponding drone formation strategies.
Scenario 1: Frontal Engagement with Split Frequency Focus
In this setup, Radars A & B (S-band) are on the forward edge, while Radar C (L-band) is on the rear flank. The 8-drone formation drone light show is split: Drones 1-6 engage the forward S-band pair, while Drones 7-8 specifically target the rear L-band radar. We simulate different sub-formations for the forward group.
| Forward Formation Pattern | Description | Key Spatial Parameter (Drone Spacing) | Observed Effect on Protected Corridor |
|---|---|---|---|
| Tight Line-Abreast | Drones spaced 30 km apart, flying parallel to corridor axis. | \( \Delta d = 30 \text{ km} \) | Creates a deep but narrow protected “wedge” on the engaged side. The rear corridor remains partially exposed to Radar C and the sidelobes of A/B. |
| Wide Line-Abreast | Drones spaced 70 km apart, flying parallel to corridor axis. | \( \Delta d = 70 \text{ km} \) | Broadens the frontal interference footprint, pushing the detection edge back. However, creates significant spatial “gaps” or lobes within the corridor where JSR falls below the threshold, reducing interior protection. |
| Optimized Phased Array Emulation | Drones are spaced 40 km apart but with staggered altitudes and directed beams. A subset (e.g., 2 drones) focus precisely on the midpoint between A & B. | \( \Delta d = 40 \text{ km} \), \( \Delta h \approx 1 \text{ km} \) | Maximizes main-lobe injection into both forward radars simultaneously. The staggered pattern fills the gaps. This formation drone light show strategy achieves an APR \( \eta > 96\% \) throughout the transit. |
The mathematical rationale for optimization can be seen by analyzing the denominator in the \( R_{max} \) equation. For two closely spaced radars A and B, an optimal drone position \( \vec{X}_{drone} \) seeks to minimize the combined effective distance metric:
$$
\mathcal{J} = w_A \frac{G_t(\theta_A(\vec{X}_{drone}))}{R_{drone,A}^2} + w_B \frac{G_t(\theta_B(\vec{X}_{drone}))}{R_{drone,B}^2}
$$
where \( w_A, w_B \) are weighting factors based on radar threat priority, and \( \theta_A, \theta_B \) are the angular offsets from each radar’s boresight. An intelligent formation drone light show control algorithm solves for waypoints that minimize such a cost function for multiple drones simultaneously.
Scenario 2: Flanking Engagement with Frequency-Based Division
Here, the radar net is mixed on the forward edge (A: S-band, C: L-band) with B (S-band) on the rear flank. The drone formation is divided by threat frequency: Drones 1-4 (S-band jammers) focus on the forward S-band radar (A) and rear S-band radar (B), while Drones 5-8 (L-band jammers) focus on the forward L-band radar (C).
| Formation Tactic | Drone Group Allocation | Average APR \( \eta \) | Vulnerability Analysis |
|---|---|---|---|
| Uniform Screen | Both groups fly in simple, spaced lines aligned with the corridor center. | ~65-75% | Poor spatial matching to radar locations. L-band group is often too far from Radar C for effective main-lobe jamming, leaving large sections of the corridor exposed to this node. |
| Frequency-Dedicated Clusters | S-band group (1-4) clusters towards the anticipated bearing of S-band threats. L-band group (5-8) maneuvers aggressively to close range with Radar C. | ~85-90% | Significant improvement. Creates localized zones of high JSR. However, the transition region between clusters can be weakly protected. |
| Integrated Adaptive Formation | The formation drone light show is treated as a single entity. Drones dynamically reassign “virtual” frequency roles based on real-time geometry. Flight paths are optimized for combined coverage against all three radars. | ~98%+ | Superior coverage. The formation self-adjusts, ensuring at least one drone is in an optimal position to jam each radar’s main lobe as the swarm transits. This represents the pinnacle of coordinated electronic attack using swarm principles. |
The performance leap in the adaptive formation highlights the importance of cross-platform coordination. The effectiveness \( \mathcal{E} \) of the entire swarm against the netted system can be modeled as:
$$
\mathcal{E}(t) = 1 – \prod_{k=1}^{M} \left( 1 – \xi_k(t) \right)
$$
where \( M \) is the number of radars, and \( \xi_k(t) \) is the fractional degradation in the detection probability of the \( k^{th} \) radar caused by the swarm at time \( t \). An adaptive formation drone light show explicitly maximizes \( \xi_k(t) \) for the most threatening radar at any given moment, while maintaining baseline suppression on others.
Optimization of Formation Flight Paths and Jamming Parameters
To achieve consistently high Area Protection Ratios, the formation drone light show must execute an optimized flight plan. This involves solving a multi-objective optimization problem with constraints.
Optimization Variables:
– Drone waypoint sequences \( \mathbf{W}_i = [\vec{X}_i(t_1), \vec{X}_i(t_2), …] \) for \( i = 1…N \).
– Transmit power allocation \( P_{ji}(t) \) (if variable).
– Jammer beam pointing angles \( \vec{\alpha}_{ji}(t) \).
Objective Function (to maximize):
$$
\Phi = \int_{t_{start}}^{t_{end}} \eta(t) \, dt – \lambda_1 \sum_{i=1}^{N} \text{FuelCost}(\mathbf{W}_i) – \lambda_2 \sum_{i=1}^{N} \int P_{ji}(t) \, dt
$$
Constraints:
– Minimum safe separation between drones: \( ||\vec{X}_i(t) – \vec{X}_j(t)|| > d_{min} \).
– Maximum drone velocity and acceleration.
– Stay within operational airspace.
– Maintain communication links for coordination.
Solving this problem in real-time requires efficient algorithms. A practical approach uses a two-layer hierarchical strategy:
1. Global Path Planner: Uses pre-computed simulations or machine learning models to generate a coarse, optimal corridor and initial formation shape that maximizes the expected minimum APR.
2. Local Reactive Controller: Each drone uses model predictive control (MPC) to adjust its position relative to neighbors and in response to simulated or measured radar signal strength, ensuring the local JSR contributions remain high.
A comparison of optimization methods is shown below:
| Optimization Method | Application to Formation Drone Light Show | Advantages | Disadvantages |
|---|---|---|---|
| Genetic Algorithm (GA) | Evolves waypoint sequences for the entire formation to maximize \( \Phi \). | Good for global, off-line planning of complex scenarios. Can handle non-linear constraints. | Computationally expensive. Not suitable for real-time replanning. |
| Particle Swarm Optimization (PSO) | Each “particle” represents a full formation state. The swarm converges on an optimal path. | Inspired by swarm behavior itself. Efficient for continuous variable optimization. | May get stuck in local optima for very complex landscapes. |
| Model Predictive Control (MPC) | Each drone solves a local optimization over a short time horizon, considering predicted radar geometry and neighbor positions. | Excellent for real-time, adaptive control. Robust to disturbances. | Requires accurate short-term prediction models. Inter-drone negotiation adds complexity. |
Conclusion and Implications
The application of formation drone light show coordination principles to electronic warfare presents a potent and adaptable capability against netted radar systems. Through mathematical modeling and simulation, we have demonstrated that a swarm of low-power jamming UAVs, when intelligently orchestrated, can effectively suppress the composite detection volume of a radar network, carving out a sizeable protected corridor. The key insights are:
1. Spatial Distribution Overwhelms Network Fusion: A netted radar’s strength is data fusion from multiple nodes. A distributed formation drone light show counters this by presenting multiple, spatially diverse interference sources that are difficult to nullify simultaneously, degrading the input to the fusion center.
2. Geometry is Crucial: Simple, static formations yield suboptimal and inconsistent protection. Dynamic formations that actively optimize drone positions relative to the main lobes of the highest-priority threats are essential for achieving high (\(>95\%\)) Area Protection Ratios.
3. The Synergy of Coordination: The whole is greater than the sum of its parts. An adaptive, communicating swarm that can redistribute “jamming tasks” based on real-time geometry performs vastly better than pre-assigned, static roles.
The underlying mathematics, centered on the burn-through range equation and the optimization of spatial parameters, provides a framework for designing and evaluating such swarm tactics. Future work lies in integrating more sophisticated electronic attack techniques (like coherent or digital radio frequency memory jamming) into the swarm model, testing resilience against radar countermeasures like frequency hopping and sidelobe blanking, and developing ultra-fast decentralized control algorithms for truly autonomous, resilient formation drone light show electronic attack missions. This paradigm shift from single-platform to swarm-based jamming will likely define the next generation of aerial electronic warfare.