
In recent years, the proliferation of unmanned aerial vehicles (UAVs), particularly small drones and drone swarms, has posed a significant threat to urban security, critical infrastructure, and military operations. As an anti-drone systems designer, I have focused on addressing the challenges of system-of-systems combat modeling, overall process design, and operational effectiveness evaluation in anti-drone systems. This article explores the organizational architecture and operational processes of both drone and anti-drone systems, proposing an anti-drone Observe-Orient-Decide-Act (OODA) system-of-systems combat model based on the multi-agent modeling platform NetLogo. By leveraging the emergent properties of agents in the simulation model, I investigate the influence and patterns of the OODA loop on anti-drone operations, validating that the OODA model is a key factor affecting anti-drone combat effectiveness, which holds important guiding significance for anti-drone combat command and system construction.
The OODA loop, a classic model in military command and control, consists of four cyclical steps: Observe, Orient, Decide, and Act. In the context of anti-drone operations, this model underpins both drone and anti-drone system functionalities. For drones, the process involves observing the environment through sensors, orienting by processing data in the mission planning control station, deciding on actions by operators, and acting via the drone’s movements or payloads. Similarly, anti-drone systems observe through multi-sensor detection, orient by fusing data for threat assessment, decide on countermeasures via command and control, and act by deploying interception or disruption measures. The core of anti-drone system-of-systems combat lies in the temporal competition between opposing OODA loops: shortening one’s own OODA cycle while prolonging the adversary’s cycle to gain battlefield dominance. The OODA cycle time $T_{\text{OODA}}$ can be expressed as:
$$T_{\text{OODA}} = \Delta t_1 + \Delta t_2 + \Delta t_3 + \Delta t_4$$
where $\Delta t_1$ is the observation-to-orientation time, $\Delta t_2$ the orientation-to-decision time, $\Delta t_3$ the decision-to-act time, and $\Delta t_4$ the action-to-next-observation time. These components relate to network information exchange rates $\lambda_T$, decision rates $\lambda_{C2}$, deployment rates $\lambda_E$, and engagement rates $\lambda_F$, yielding:
$$T_{\text{OODA}} = \frac{1}{\lambda_T} + \frac{1}{\lambda_{C2}} + \frac{1}{\lambda_E} + \frac{1}{\lambda_F}$$
In system-of-systems combat, each platform operates within its own OODA loop, nested within higher-level loops, forming a complex network. For anti-drone operations, this model facilitates rapid response to dynamic drone threats, emphasizing the need for integrated detection, command, and interception systems.
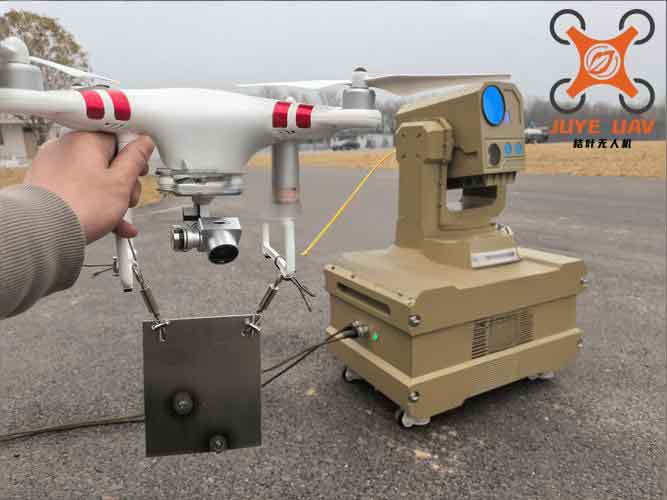
To model this anti-drone OODA system-of-systems combat, I developed a simulation using NetLogo, a multi-agent modeling platform ideal for simulating complex systems over time. The simulation involves drones (as attackers) and an anti-drone system (as defender) protecting a command center. Agents include the battlefield environment, drones (fixed-wing and rotary-wing), sensors (radar, radio frequency, electro-optical), command and control (C2) center, and countermeasure devices (radio jammers, navigation spoofers, high-power microwave, laser weapons). Key attributes and interactions are summarized in tables below, with parameters adjustable to study OODA effects.
The simulation rules define how agents interact: drones move toward the C2 center, sensors detect drones within range with probabilistic success, the C2 orients and decides on responses, and countermeasures engage drones. The OODA cycle times for both sides influence outcomes, with metrics such as number of drones detected, identified, and neutralized, along with average times for each OODA phase. The anti-drone system aims to complete its OODA loop faster than the drones to prevent attacks, while drones seek to shorten their own loop to breach defenses. Through iterative runs, the model reveals emergent behaviors highlighting the criticality of OODA dynamics in anti-drone scenarios.
For the anti-drone system, the OODA process is formalized as follows. The observation phase involves multi-sensor detection, where the probability of detecting a drone $P_d$ depends on sensor range and environmental factors. Assuming sensors operate independently, the combined detection probability for $n$ sensors is:
$$P_{\text{combined}} = 1 – \prod_{i=1}^{n} (1 – P_{d,i})$$
where $P_{d,i}$ is the detection probability of sensor $i$. The orientation phase includes data fusion and threat assessment, modeled as a time delay $\Delta t_2$ inversely proportional to the C2 processing rate $\lambda_{C2}$. Decision-making involves selecting countermeasures based on threat level, with a time $\Delta t_3$ related to the decision rate. Action execution entails deploying countermeasures, with engagement success probability $P_e$ and time $\Delta t_4$. Thus, the total anti-drone OODA time $T_{\text{anti-drone}}$ is:
$$T_{\text{anti-drone}} = \frac{1}{\lambda_T} + \frac{1}{\lambda_{C2}} + \frac{1}{\lambda_E} + \frac{1}{\lambda_F}$$
Similarly, for drones, the OODA time $T_{\text{drone}}$ is:
$$T_{\text{drone}} = \frac{1}{\lambda’_{T}} + \frac{1}{\lambda’_{C2}} + \frac{1}{\lambda’_{E}} + \frac{1}{\lambda’_{F}}$$
where primed rates correspond to drone capabilities. The system-of-systems combat outcome depends on the difference $\Delta T = T_{\text{drone}} – T_{\text{anti-drone}}$; if $\Delta T > 0$, the anti-drone system gains advantage.
In NetLogo, agents are implemented as turtles (dynamic) and patches (static). The battlefield is a 100×100 grid, where each patch represents 200 m x 200 m, simulating a 20 km x 20 km area. Drones are bred as separate agent types with attributes like speed, detection range, and OODA times. The C2 and sensors are stationed at the center. The simulation ticks every second, with agents following interaction rules coded in Logo. For example, drone movement uses the forward command with step size $v/200$, where $v$ is speed in m/s. Detection checks use distancexy to compute ranges, and probabilistic success is modeled via random number generation. Data collection tracks metrics such as $n_{\text{C2-Ob}}$ (number of drones observed by C2) and $t_{\text{C2-Ob}}$ (average observation time), enabling analysis of OODA performance.
Key parameters for the simulation are summarized in Table 1, showing reference values and ranges for agent attributes. These include detection capabilities, probabilities, response times, and engagement parameters for both drones and anti-drone systems. Adjusting these parameters allows experimentation on OODA effects.
| Agent | Fixed-Wing Drone | Rotary-Wing Drone | Radar | Radio Sensor | Electro-Optical | C2 Center | Radio Jammer | Navigation Spoofer | High-Power Microwave | Laser Weapon |
|---|---|---|---|---|---|---|---|---|---|---|
| Quantity | 25 [0-100] | 25 [0-100] | 1 | 1 | 1 | 1 | 1 | 1 | 1 | 1 |
| Speed (m/s) | 30 [0-100] | 15 [0-50] | 0 | 0 | 0 | 0 | 0 | 0 | 0 | 0 |
| Detection Capability (km) | 5 [0-10] | 2 [0-5] | 9/6 [0-10] | 8/5 [0-10] | 7/4 [0-10] | – | – | – | – | – |
| Detection Probability (%) | 50 [0-100] | 50 [0-100] | 90 [0-100] | 50 [0-100] | 50 [0-100] | – | – | – | – | – |
| Orientation Response (s) | 25 [0-120] | 25 [0-120] | – | – | – | 5 [0-120] | – | – | – | – |
| Decision Response (s) | 50 [0-120] | 50 [0-120] | – | – | – | 10 [0-120] | – | – | – | – |
| Engagement Capability (km) | 1 [0-10] | 0.4 [0-5] | – | – | – | – | 5/3 [0-10] | 5/3 [0-10] | 3/2 [0-5] | 1.5/1 [0-5] |
| Engagement Probability (%) | 30 [0-100] | 10 [0-100] | – | – | – | – | 50 [0-100] | 50 [0-100] | 80 [0-100] | 80 [0-100] |
Note: Slash (/) denotes parameters for fixed-wing (left) and rotary-wing (right) targets. Ranges in brackets indicate adjustable values.
The simulation interface includes sliders for parameter configuration, buttons for control, a world panel for visualization, and plots for real-time metrics. Evaluation metrics focus on OODA phase outcomes: for the anti-drone system, $n_{\text{C2-Ob}}$, $t_{\text{C2-Ob}}$ (observation), $n_{\text{C2-Or}}$, $t_{\text{C2-Or}}$ (orientation), $t_{\text{C2-De}}$ (decision), and $n_{\text{C2-A}}$, $t_{\text{C2-A}}$ (action); for drones, $n_{\text{U&D-Ob}}$, $t_{\text{U&D-Ob}}$, $n_{\text{U&D-Or}}$, $t_{\text{U&D-Or}}$, $t_{\text{U&D-De}}$, $n_{\text{U&D-A}}$, $t_{\text{U&D-A}}$. These metrics aggregate over multiple runs to assess system performance.
To study OODA impacts, I conducted three groups of experiments, each with 15 simulation runs, averaging results. Group I used default parameters as a reference. Group II varied anti-drone system capabilities to analyze OODA effects on anti-drone effectiveness, with parameters shown in Table 2. Group III varied drone capabilities to analyze OODA effects on drone effectiveness, with parameters in Table 3.
| Experiment | Radar Detection (km) Fixed/Rotary | Radio Detection (km) Fixed/Rotary | Electro-Optical Detection (km) Fixed/Rotary | C2 Orientation Response (s) | C2 Decision Response (s) | Jammer Range (km) Fixed/Rotary | Spoofer Range (km) Fixed/Rotary | Microwave Range (km) Fixed/Rotary | Laser Range (km) Fixed/Rotary |
|---|---|---|---|---|---|---|---|---|---|
| II-1 | 10/7 | 9/6 | 8/5 | 2 | 5 | 6/4 | 6/4 | 4/3 | 2/1.5 |
| II-2 | 8/5 | 7/4 | 6/3 | 8 | 15 | 4/2 | 4/2 | 2/1.5 | 1/0.5 |
| Experiment | Drone Detection Range (km) Fixed/Rotary | Drone Orientation Response (s) | Drone Decision Response (s) | Drone Engagement Range (km) Fixed/Rotary |
|---|---|---|---|---|
| III-1 | 6/2.5 | 15 | 40 | 1.5/0.7 |
| III-2 | 4/1.5 | 35 | 60 | 0.5/0.1 |
Results from Group I and Group II are compared in Table 4. Group II-1, with enhanced anti-drone capabilities (shorter response times, larger ranges), showed improvements: drones observed increased by 0.1, identified by 0.5, and neutralized by 1.6 on average, while observation time decreased by 27.1 s, orientation time by 33.5 s, and action time by 30.0 s, boosting anti-drone success rate by 13.3%. Conversely, Group II-2, with degraded capabilities, saw reductions in drones observed (-0.7), identified (-3.0), and neutralized (-3.6), with time delays of 30.1 s, 18.9 s, and 13.3 s, respectively, lowering success rate by 20%. This underscores that optimizing the anti-drone OODA loop—through faster sensors, quicker decision-making, and effective countermeasures—significantly enhances anti-drone performance.
| Experiment | $n_{\text{C2-Ob}}$ | $n_{\text{C2-Or}}$ | $n_{\text{C2-A}}$ | $t_{\text{C2-Ob}}$ (s) | $t_{\text{C2-Or}}$ (s) | $t_{\text{C2-A}}$ (s) | Anti-Drone Success Rate (%) |
|---|---|---|---|---|---|---|---|
| I (Reference) | 49.8 | 49.0 | 47.4 | 105.4 | 206.3 | 278.6 | 66.7 |
| II-1 | 49.9 | 49.5 | 49.0 | 78.3 | 172.8 | 248.6 | 80.0 |
| Difference from I | +0.1 | +0.5 | +1.6 | -27.1 | -33.5 | -30.0 | +13.3 |
| II-2 | 49.1 | 46.0 | 43.8 | 135.5 | 225.2 | 291.9 | 46.7 |
| Difference from I | -0.7 | -3.0 | -3.6 | +30.1 | +18.9 | +13.3 | -20.0 |
Results from Group I and Group III are compared in Table 5. Group III-1, with enhanced drone capabilities, showed drones observing C2 increased by 23.6, identifying by 23.5, and attacking by 0.2 on average, with time reductions of 22.1 s, 39.5 s, and 69.0 s, raising drone success rate by 20%. Group III-2, with degraded drone capabilities, saw decreases in observations (-2.2), identifications (-4.5), and attacks (-0.1), with time increases of 27.1 s, 81.1 s, and 142.7 s, lowering drone success rate by 6.6%. This highlights that drone OODA efficiency directly impacts their threat level, but even with disadvantages, swarm attacks can pose risks, emphasizing the asymmetric nature of anti-drone challenges.
| Experiment | $n_{\text{U&D-Ob}}$ | $n_{\text{U&D-Or}}$ | $n_{\text{U&D-A}}$ | $t_{\text{U&D-Ob}}$ (s) | $t_{\text{U&D-Or}}$ (s) | $t_{\text{U&D-A}}$ (s) | Drone Success Rate (%) |
|---|---|---|---|---|---|---|---|
| I (Reference) | 6.5 | 6.4 | 0.4 | 206.5 | 235.5 | 455.6 | 33.3 |
| III-1 | 30.1 | 29.9 | 0.6 | 184.4 | 196.0 | 386.6 | 53.3 |
| Difference from I | +23.6 | +23.5 | +0.2 | -22.1 | -39.5 | -69.0 | +20.0 |
| III-2 | 4.3 | 1.9 | 0.3 | 233.6 | 316.6 | 529.3 | 26.7 |
| Difference from I | -2.2 | -4.5 | -0.1 | +27.1 | +81.1 | +142.7 | -6.6 |
The simulation experiments validate that the OODA loop is a key factor in anti-drone system-of-systems combat. Shorter OODA cycles for the anti-drone system correlate with higher success rates, while prolonged cycles diminish effectiveness. This aligns with the theoretical premise that temporal dominance in OODA loops confers battlefield advantage. Moreover, the model reveals the emergent behavior of drone swarms: even with individual OODA disadvantages, collective attacks can overwhelm defenses, underscoring the need for robust, networked anti-drone systems. These insights guide anti-drone system design, emphasizing integration of rapid detection, agile decision-making, and multi-layered countermeasures to compress the OODA cycle.
However, the model incorporates idealizations, such as constant detection probabilities and simplified agent interactions. Future work could enhance realism by incorporating distance-dependent detection probabilities, where $P_d$ increases as range decreases, modeled as:
$$P_d(r) = P_{d,\max} \cdot e^{-k r}$$
where $r$ is distance, $P_{d,\max}$ is maximum probability, and $k$ is a decay constant. Additionally, swarm intelligence behaviors, such as information sharing among drones upon target detection, could be added to simulate coordinated attacks. Distributed sensor networks could also be modeled to study decentralized anti-drone systems against swarms. These extensions would deepen the understanding of anti-drone dynamics in complex environments.
Further research directions include: analyzing the relative impact of each OODA phase on anti-drone outcomes; determining the maximum drone swarm size manageable by a given anti-drone system; and optimizing anti-drone deployment and performance metrics based on known drone capabilities. Such studies would leverage the NetLogo platform for iterative simulation, providing quantitative foundations for anti-drone strategy and technology development.
In conclusion, this article presents an anti-drone OODA system-of-systems combat model implemented in NetLogo, demonstrating through multi-agent simulation that the OODA loop critically influences anti-drone effectiveness. By shortening observation, orientation, decision, and action times, anti-drone systems can gain superiority over drone threats. The model offers a framework for evaluating anti-drone systems, with implications for command control and operational planning. As drone threats evolve, continued refinement of such models will be essential for advancing anti-drone capabilities and ensuring security in an increasingly contested airspace.