The rapid growth of e-commerce and urbanization has intensified challenges in urban logistics, including traffic congestion, environmental pollution, and inefficient last-mile delivery. Delivery drones offer transformative potential with their speed, flexibility, and cost-effectiveness. However, establishing urban delivery UAV networks requires solving the complex vertiport location problem, particularly in high-density areas with airspace restrictions and infrastructure constraints. Our research addresses this by integrating clustering algorithms with multi-objective optimization to determine optimal takeoff/landing sites for delivery drones.
Factors Influencing Delivery Drone Vertiport Location
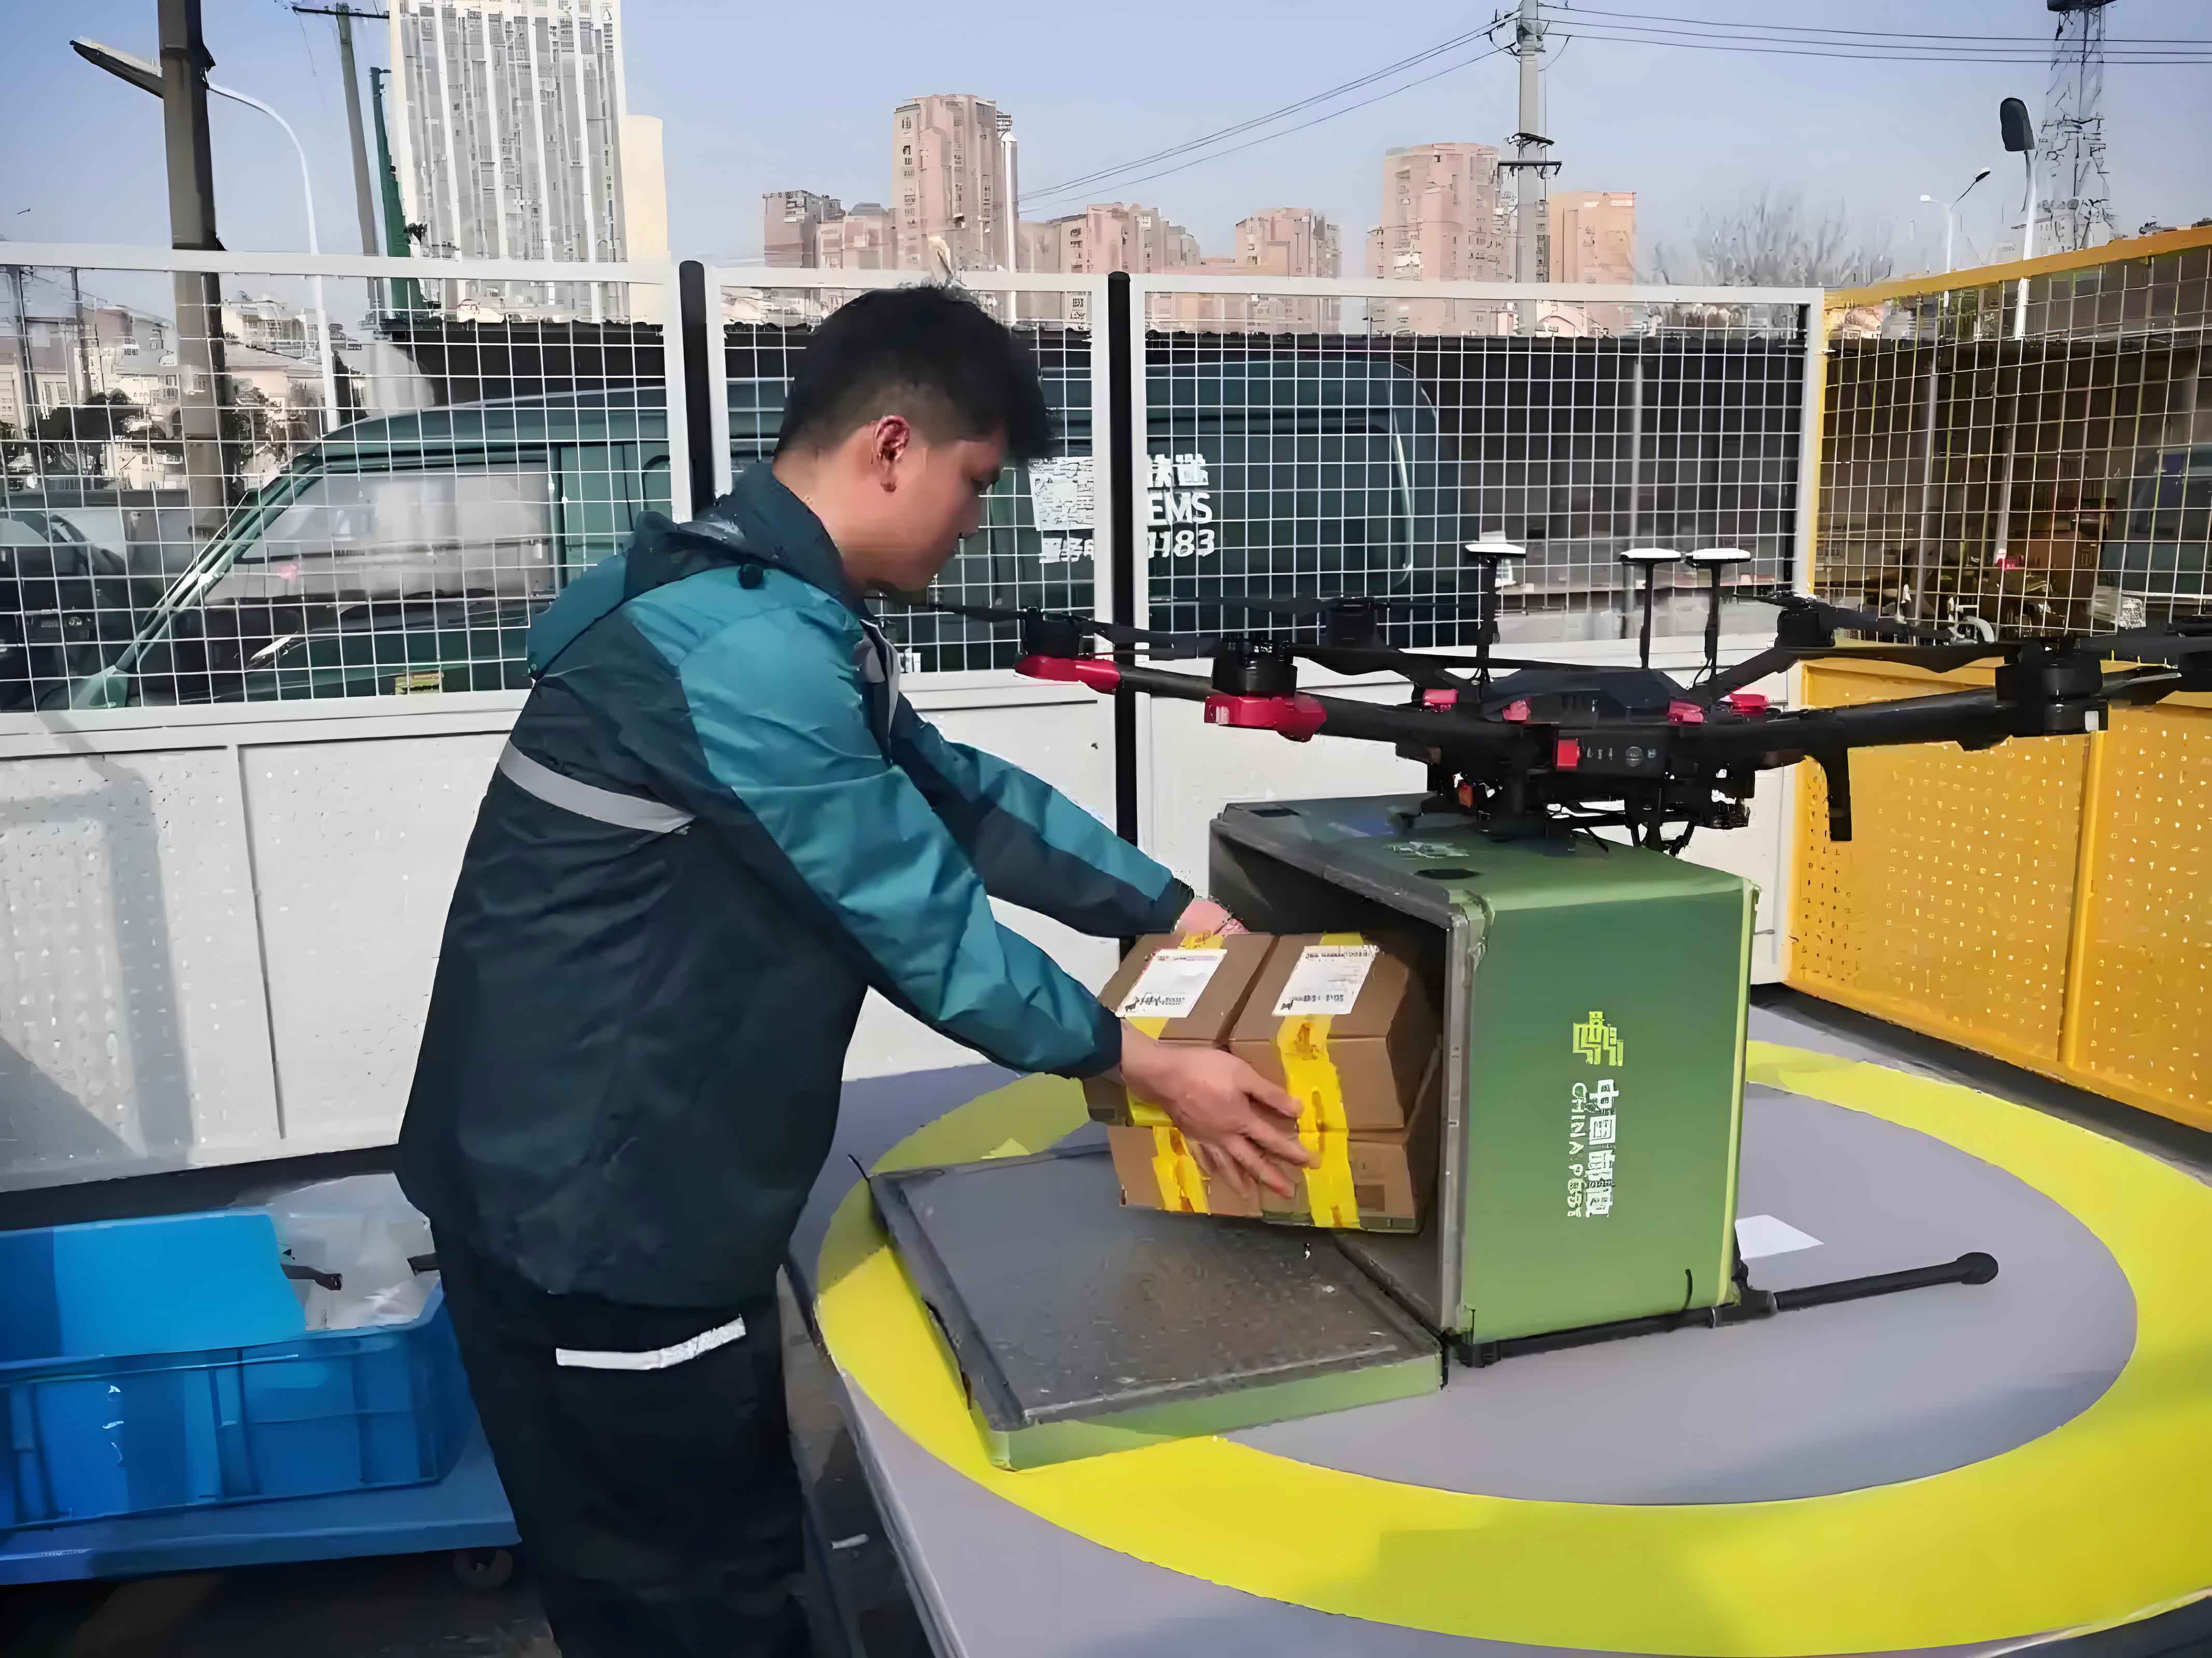
Vertiports for delivery UAVs function similarly to self-pickup stations in last-mile logistics networks. Drones transport parcels from distribution centers to vertiports, where customers collect their goods. We identify four critical factor categories with nine evaluation metrics:
| Objective Layer | Factor Layer | Indicator Layer | Description |
|---|---|---|---|
| Airspace Conditions | Flight Restrictions | a₁ | Presence of no-fly zones in the airspace |
| Altitude Limitations | a₂ | Maximum permitted flight altitude | |
| High-rise Density | a₃ | Number of obstacles >75m within 160m radius | |
| Construction Conditions | Terrain Adaptability | b₁ | Site suitability based on topography (expert scoring) |
| Infrastructure | b₂ | Existing infrastructure support (expert scoring) | |
| Accessibility | Ground Transport | c₁ | Road connectivity level and quantity |
| Aerial Connectivity | c₂ | Number of accessible distribution centers | |
| Demand Factors | Available Area | d₁ | Land area suitable for vertiport construction |
| Demand Density | d₂ | Number of demand points within 2km radius |
Two-Phase Methodology
Phase 1: Candidate Site Selection
Demand Point Clustering: We apply k-means clustering based on Euclidean distance to group demand points. For k clusters, the centroid locations become preliminary delivery drone vertiport candidates:
$$ \text{Minimize} \sum_{i=1}^{k} \sum_{\mathbf{x} \in S_i} \|\mathbf{x} – \mathbf{\mu}_i\|^2 $$
where $S_i$ represents clusters, $\mathbf{\mu}_i$ are centroids, and $\mathbf{x}$ denotes demand point coordinates.
AHP-TOPSIS Evaluation: We evaluate candidates against Table 1 metrics using Analytical Hierarchy Process (AHP) for weighting and TOPSIS for ranking. Pairwise comparison matrices determine weights $\mathbf{W} = (w_1, w_2, \dots, w_n)$ through eigenvalue calculation:
$$ \mathbf{B} \mathbf{W} = \lambda_{\text{max}} \mathbf{W} $$
where $\mathbf{B}$ is the comparison matrix. Consistency Ratio (CR) validation ensures reliability:
$$ CR = \frac{CI}{RI} < 0.1, \quad CI = \frac{\lambda_{\text{max}} – n}{n – 1} $$
TOPSIS normalizes the decision matrix $\mathbf{A} = [a_{ij}]$, identifies positive/negative ideal solutions ($A^+$, $A^-$), and calculates relative closeness $C_i$:
$$ D_i^+ = \sqrt{\sum_{j=1}^{n} w_j (a_{ij} – a_j^+)^2}, \quad D_i^- = \sqrt{\sum_{j=1}^{n} w_j (a_{ij} – a_j^-)^2} $$
$$ C_i = \frac{D_i^-}{D_i^+ + D_i^-} $$
Top-ranked sites proceed to Phase 2.
Phase 2: Multi-objective Optimization Model
Assumptions: Delivery UAV transport costs scale linearly with distance and parcel weight. Weather impacts are excluded.
Parameters:
- $I$: Demand point set, $i \in I$
- $J$: Candidate site set, $j \in J$
- $w_i$: Demand weight at point $i$
- $s_j$: Distance from candidate $j$ to distribution center
- $d_{ij}$: Distance between demand point $i$ and candidate $j$
- $b_j$: Construction cost at candidate $j$
- $Q$: Vertiport capacity
- $a$: Unit delivery UAV transport cost
- $c$: Unit parcel processing cost
Customer Satisfaction Function: For self-pickup operations, satisfaction decreases with walking distance:
$$ f(d_{ij}) =
\begin{cases}
1 & d_{ij} \leq d_1 \\
\frac{d_2 – d_{ij}}{d_2 – d_1} & d_1 < d_{ij} \leq d_2 \\
0 & d_{ij} > d_2
\end{cases} $$
where $d_1$ and $d_2$ denote threshold distances (e.g., 500m and 1000m).
Multi-objective Model:
Maximize service coverage:
$$ \text{Max} \sum_{i \in I} \sum_{j \in J} w_i x_{ij} $$
Maximize satisfaction:
$$ \text{Max} \sum_{i \in I} \sum_{j \in J} f(d_{ij}) x_{ij} $$
Subject to:
$$ \sum_{j \in J} x_{ij} \leq 1 \quad \forall i \in I \quad \text{(Single assignment)} $$
$$ \sum_{j \in J} y_j \leq p \quad \text{(Site limit)} $$
$$ \sum_{i \in I} w_i x_{ij} \leq Q y_j \quad \forall j \in J \quad \text{(Capacity)} $$
$$ x_{ij} \leq y_j \quad \forall i \in I, j \in J \quad \text{(Service constraint)} $$
$$ \sum_{j \in J} \left( s_j \sum_{i \in I} w_i x_{ij} + a \sum_{i \in I} w_i x_{ij} y_j + c \sum_{i \in I} w_i x_{ij} \right) + \sum_{j \in J} b_j y_j \leq \theta \quad \text{(Budget)} $$
$$ x_{ij}, y_j \in \{0,1\} \quad \forall i,j \quad \text{(Binary decisions)} $$
Case Study Implementation
We validated our methodology in a high-density central urban district. Data collection included:
- 282 demand points identified via geospatial API
- No-fly zones mapped from aviation authority databases
- Indicator data sourced from geographic information systems
Phase 1 Results: K-means clustering generated 35 preliminary sites. AHP determined these weights for delivery UAV suitability:
| Indicator | a₂ | a₃ | b₁ | b₂ | c₁ | c₂ | d₁ | d₂ |
|---|---|---|---|---|---|---|---|---|
| Weight | 0.0395 | 0.2329 | 0.1989 | 0.0702 | 0.0811 | 0.1495 | 0.0541 | 0.1737 |
TOPSIS analysis selected 18 optimal candidates for Phase 2.
Phase 2 Results: Using NSGA-II optimization (population=60, generations=100) with parameters:
- $w_i \sim \mathcal{N}(40, 5^2)$ within [10,80]
- $Q$ = 500 parcels/day
- $a$ = $0.2/km/kg, c$ = $0.1/parcel
- $\theta$ = $150,000
The Pareto frontier (Figure) revealed the tradeoff between coverage and satisfaction:
| Sites | Coverage (kg) | Satisfaction | Sites | Coverage (kg) | Satisfaction |
|---|---|---|---|---|---|
| 15 | 8,551.73 | 166.61 | 16 | 9,349.37 | 132.90 |
| 17 | 10,529.08 | 71.38 | 17 | 10,195.69 | 91.47 |
| 17 | 9,837.79 | 110.10 | 16 | 9,627.89 | 122.02 |
| 16 | 8,821.85 | 155.61 | 17 | 10,470.23 | 74.38 |
| 16 | 8,659.26 | 160.61 | 17 | 9,971.53 | 101.07 |
The solution with 15 delivery drone vertiports achieved 74.82% coverage (211 demand points) and high satisfaction, demonstrating balanced performance for urban delivery UAV deployment.
Conclusion
Our two-phase framework effectively addresses urban delivery drone vertiport location challenges. Phase 1 combines clustering with AHP-TOPSIS to identify suitable candidates considering airspace constraints, infrastructure, and demand patterns critical for delivery UAV operations. Phase 2’s multi-objective model optimizes coverage and customer satisfaction under real-world constraints. The case study confirms the method’s viability for designing efficient urban delivery UAV networks, providing a foundation for scalable last-mile logistics solutions using delivery drones. Future work will incorporate dynamic air traffic management and energy consumption models for delivery UAV fleets.