
In recent years, research related to LiDAR technology has remained a focal point within the geospatial information community. Compared with traditional modeling methods, our proposed approach offers significant advantages including high efficiency, superior accuracy, and no constraints regarding time of day. Within the domain of LiDAR modeling technology, three primary platforms exist: vehicle-mounted, helicopter-borne, and unmanned aerial vehicle (UAV) based systems. Among these, the UAV equipped with LiDAR technology demonstrates remarkable superiority. This method can突破 geographical limitations of specific areas, allows flexible takeoff and landing operations, and incurs relatively low operational costs. It represents an ideal solution for acquiring spatial information in disaster scenarios and complex urban environments.
LiDAR SLAM remains one of the most commonly employed methodologies, primarily utilized for constructing scene point cloud maps. Based on the type of采集 data, LiDAR SLAM can be categorized into two main approaches: range sensor-based and vision-based methods. From a problem-solving perspective, it can be further divided into graph optimization methods and filtering methods. To deepen the application of China UAV LiDAR technology and provide comprehensive technical support for urban operations, emergency response, and digital twin construction, we have designed and implemented a complete urban three-dimensional modeling workflow based on this technology.
Our research focuses on developing a robust methodology that integrates hardware platform construction, sensor fusion, point cloud registration, scene mapping, and surface reconstruction. The entire pipeline is designed to meet the stringent requirements of urban精细化管理和 emergency scenario simulation for high-precision 3D models. In the following sections, we present detailed accounts of the platform construction, algorithmic innovations, experimental validation, and performance evaluation.
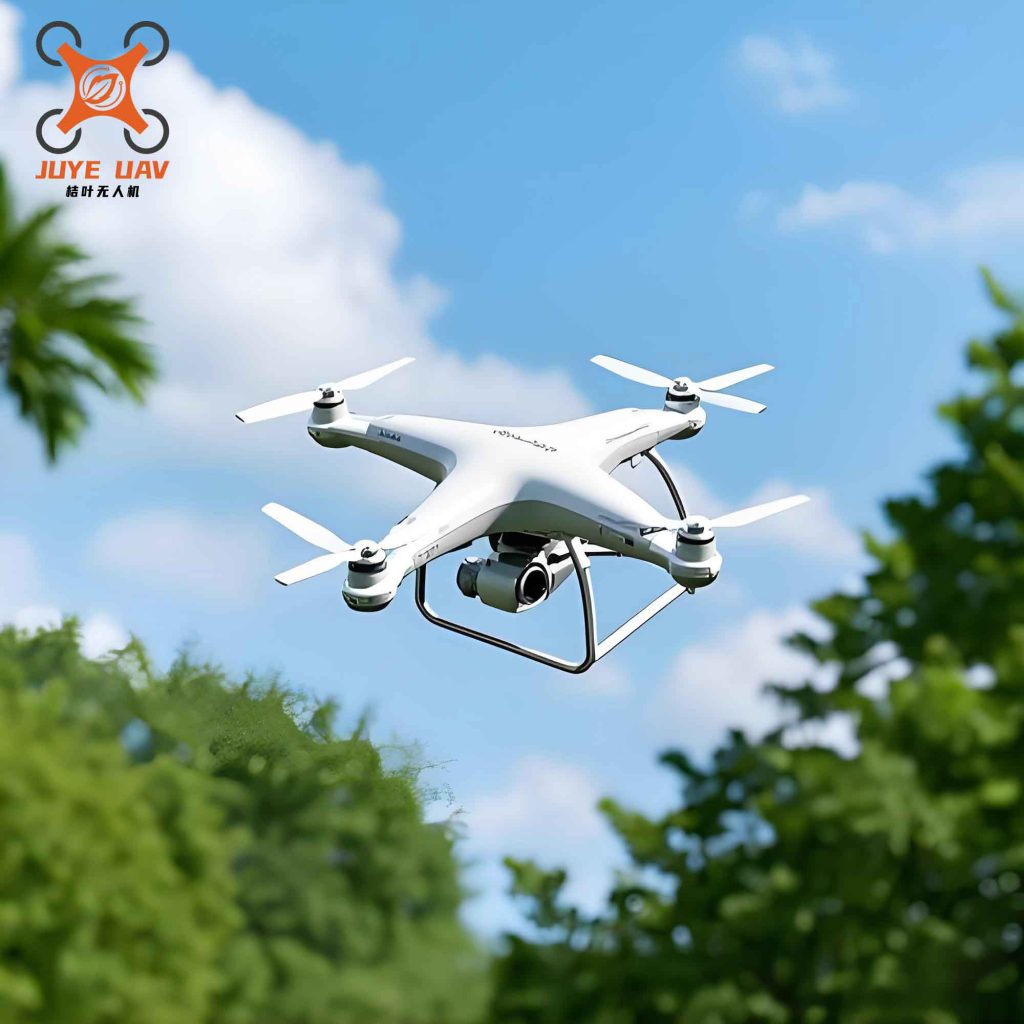
Methodology for Urban 3D Modeling
Point Cloud Data Acquisition Platform Construction
We constructed a point cloud data acquisition platform by selecting the DJI S1000+ as the UAV carrier. This China UAV platform is a professional-grade device characterized by low self-weight and high structural strength. It has a maximum payload capacity of 6.6 kg, which fully meets the requirements of our research. The UAV serves as the aerial mobility platform, enabling flexible data collection over urban areas with complex terrain and dense infrastructure.
For the LiDAR sensor, we employed the Velodyne VLP-16, which supports 16-channel scanning and can generate over 300,000 point clouds per second. This sensor provides high-density point cloud data essential for detailed urban modeling. Additionally, the platform is equipped with the MIT-300AHRS inertial measurement unit (IMU) from Siemens, an Intel NUC micro-computing device, a 50,000 mA portable power supply from Ruiqi, and voltage conversion components.
Based on the working principles of the platform and the characteristics of the hardware devices, we divided the system into four main functional modules. These modules are organized as follows:
| Module Name | Components | Function Description |
|---|---|---|
| Flight System | DJI S1000+ UAV, flight controller, GPS module | Provides stable aerial platform, autonomous navigation, and trajectory control |
| Data Acquisition System | Velodyne VLP-16 LiDAR, MIT-300AHRS IMU | Collects 3D point cloud data and inertial measurements |
| Computing and Storage System | Intel NUC, solid-state drive | Real-time data processing and storage |
| Power Supply System | 50,000 mA portable power supply, voltage converters | Provides stable power to all onboard electronic devices |
Power Supply and Flight System Integration
Since our point cloud data acquisition operations are conducted in the air, it is necessary to mount the data acquisition subsystem beneath the UAV to collect the预期 point cloud data. To achieve this, we designed a three-axis gimbal model for mounting the data acquisition subsystem and manufactured it using 3D printing technology. The gimbal consists of two main components: one component connects to the UAV, and the other component houses the data acquisition subsystem. Through this design, we successfully integrated the flight subsystem with the data acquisition subsystem.
The power supply subsystem is primarily responsible for providing power to all onboard hardware devices. Among these, the IMU can be powered directly through a serial port connection, so we only need to supply power directly to the NUC and the LiDAR sensor. To ensure stable operation of all devices, the ideal power supply approach is to operate them at their rated voltages. The NUC has a rated operating voltage of 19 V, while the LiDAR sensor has a rated operating voltage of 12 V.
Following this analysis, we designed the power supply subsystem using a mobile power supply with 19 V output combined with voltage conversion modules. Specifically, we connected two voltage conversion modules in parallel: one pathway maintains the 19 V voltage output to power the NUC; the other pathway performs a 19 V to 12 V conversion, outputting 12 V voltage to power the LiDAR sensor. This configuration satisfies the different power supply requirements of the various devices.
Radar Pose Estimation and Point Cloud Registration
The point cloud data collected by the LiDAR sensor during motion contains distortions caused by the sensor’s own movement. If not corrected, this motion distortion will lead to failed map construction. Therefore, radar pose estimation and point cloud registration are the首要 steps in constructing a consistent point cloud map.
We adopted an improved iterative closest point (ICP) method based on feature points for point cloud registration, combined with IMU data for motion compensation, to improve registration accuracy and robustness.
First, we define the LiDAR coordinate system L, with its origin at the geometric center of the radar. Let the coordinates of a point in the k-th scan cycle within L be X_k, and its coordinates in the world coordinate system W can be obtained through the pose transformation matrix T_k:
$$
X_{k}^{(w)} = T_{k} \cdot X_{k}^{(l)}
$$
The pose transformation matrix T_k is composed of the rotation matrix R_k and the translation vector t_k, expressed as:
$$
T_{k} = \begin{bmatrix} R_{k} & t_{k} \\ 0 & 1 \end{bmatrix}
$$
To estimate the pose change between adjacent frames, we introduced a feature point extraction method based on local curvature of the point cloud. The curvature c_i of a point p_i is defined as the variance of distances between all points in its neighborhood set S_i and the point itself, calculated as:
$$
c_{i} = \frac{1}{|S_{i}|} \sum_{j \in S_{i}, j \neq i} \| X_{j} – X_{i} \|^{2}
$$
Based on the curvature magnitude, we classify feature points into two categories: edge points (high curvature) and planar points (low curvature). The curvature threshold was set to 0.006. Edge points must have a curvature greater than this threshold, while planar points must have a curvature smaller than this threshold. To prevent clustering of feature points, each scan region is divided into 4 sub-regions, with each sub-region containing no more than 2 edge points and 4 planar points.
On this basis, IMU data is integrated to further improve the accuracy of motion estimation. First, we use the IMU to obtain the angular velocity and linear acceleration of the point cloud, performing rough pose estimation. Then, we use this rough estimation to perform preliminary correction of motion distortion in the 3D point cloud. Finally, we use the visual features of the point cloud for precise registration. When the China UAV undergoes large-scale motion (such as changes in pitch angle), our proposed algorithm demonstrates high recognition accuracy.
The parameter settings for feature point extraction and matching are presented in the following table:
| Parameter Name | Value/Method | Description |
|---|---|---|
| Curvature threshold | 0.006 | Used to distinguish between edge points and planar points |
| Maximum edge points per region | 2 | Prevents concentration of feature points |
| Maximum planar points per region | 4 | Ensures uniform distribution of features |
| Matching algorithm | Improved ICP + LM optimization | Combines geometric features with nonlinear optimization |
| IMU fusion frequency | 100 Hz | Provides high-frequency motion prior |
Scene Point Cloud Mapping
During the mapping process, we not only consider the registration between the current frame and the local map but also control the data volume and memory usage through voxel filtering and map cropping strategies.
Let the map obtained after the (k-1)-th mapping iteration be M_{k-1}, with its corresponding pose being T_{k-1}. The current frame point cloud P_k is transformed to the world coordinate system through pose estimation, yielding Q_k. Then, Q_k is registered with M_{k-1} and fused into the updated map M_k.
The registration method still adopts the feature point-based matching strategy, but the number of feature points used is 10 times that of the odometry stage, in order to enhance the detail preservation capability of the map.
To control the map data volume and maintain uniform point cloud distribution, we use a voxel grid filter to downsample the map, with a voxel size of 0.1 m × 0.1 m × 0.1 m. At the same time, we set the upper limit of the map range to 400 m × 400 m × 100 m. Any data beyond this range is automatically truncated, effectively preventing memory overflow and making the system suitable for long-term mapping of urban-scale scenes.
The main parameter configurations for the mapping stage are shown in the following table:
| Parameter Name | Value | Functional Description |
|---|---|---|
| Voxel grid size | 0.1 m³ | Controls point cloud density and data volume |
| Maximum map range | 400 m × 400 m × 100 m | Limits memory usage, adapts to urban scenes |
| Keyframe selection strategy | Every 1 m movement or 5 s | Reduces redundant frames, improves efficiency |
| Feature point quantity ratio | 10 times the odometry stage | Enhances map detail |
Point Cloud Map Processing and 3D Reconstruction
We employed pass-through filtering and statistical outlier removal methods to clean the data, followed by surface reconstruction based on the greedy triangulation algorithm to generate a 3D mesh model suitable for simulation platforms.
First, we use a pass-through filter to crop the point cloud along the X, Y, and Z directions, removing invalid areas at the map edges and floating objects in the air. Subsequently, we apply a statistical outlier removal algorithm to perform statistical analysis of the distance distribution within the neighborhood of each point. Points that deviate from the mean by more than 2 times the standard deviation are removed, effectively eliminating noise points generated by the LiDAR on complex surfaces such as glass and vegetation.
To enhance the visualization effect of the model, we also perform color mapping on the points based on their elevation information (Y-axis coordinate). The minimum elevation is mapped to blue, the maximum elevation is mapped to red, and intermediate values transition gradually, forming an elevation heat map that facilitates直观 analysis of terrain起伏 and building height distribution.
The following mathematical expressions describe the key steps in the point cloud processing workflow. Let the coordinates of a point in the point cloud be X_i = (x_i, y_i, z_i), and its neighborhood point set be N_i. The normal vector n_i of this point can be obtained by solving for the eigenvector corresponding to the smallest eigenvalue of the covariance matrix through principal component analysis (PCA):
$$
C = \frac{1}{|N_{i}|} \sum_{j \in N_{i}} (X_{j} – \bar{X})(X_{j} – \bar{X})^{T}
$$
where X̄ is the centroid of the neighborhood point set. After normal vector estimation, the projection distance d_i from point X_i to the local tangent plane during triangulation is:
$$
d_{i} = n_{i}^{T} \cdot (X_{i} – O)
$$
where O is the origin of the tangent plane. By minimizing the sum of projection distances of all points, the construction of the triangular mesh is completed.
Our proposed method not only ensures modeling accuracy but also significantly improves processing efficiency and model quality, providing reliable technical support for applications such as urban emergency simulation and digital twin construction.
The entire reconstruction pipeline can be summarized as follows:
| Stage | Processing Step | Algorithm / Method | Output |
|---|---|---|---|
| 1 | Data acquisition | China UAV + LiDAR + IMU | Raw point cloud + IMU data |
| 2 | Preprocessing | Pass-through filter + Statistical outlier removal | Cleaned point cloud |
| 3 | Registration | Improved ICP + Feature point matching | Aligned point cloud frames |
| 4 | Mapping | Voxel filter + Keyframe selection | Global point cloud map |
| 5 | Surface reconstruction | Greedy triangulation + Normal estimation | 3D mesh model |
| 6 | Texture mapping | Elevation-based color mapping | Visualized 3D model |
Experimental Design and Results Analysis
Experimental Setup
After completing the aforementioned design, we conducted experiments to validate the modeling accuracy by comparing the collected data with the reconstructed models. The experiments were carried out using a China UAV equipped with a LiDAR system flying over an urban surveying road to acquire information about buildings, vegetation, and other landscape features on both sides of the road. The experimental hardware platform was controlled by a professional UAV operator.
The detailed parameters of the flight experiment are presented in the following table:
| Item | Parameter |
|---|---|
| UAV flight altitude | 2 m |
| UAV flight speed | 2 m/s |
| Point cloud acquisition duration | 118 s |
During the experiment, we strictly followed the designed parameters. Under the control of the operator, the China UAV maintained a constant altitude and speed to ensure that the LiDAR could accurately and comprehensively capture the landscape information on both sides of the road. By modeling the collected data and analyzing its accuracy, we verified the stability of the proposed method in practical engineering applications, laying a solid foundation for further optimization and improvement of the method.
Experimental Results and Analysis
Based on the above content, we采集 the UAV flight images according to the designed method and performed 3D point cloud modeling. The sampling images and spatial building models were compared and analyzed.
Through comparative analysis of the collected images and the urban models, the acquired images faithfully reproduce the building layout and terrain characteristics of the urban area, while the 3D model performs highly simplified and stereoscopically rendered based on the sampled data. The shapes and positions of buildings, as well as the directions of roads, can be直观 displayed. This not only accurately reflects the真实 appearance of the city but also makes the urban structure and layout more intuitive from a three-dimensional perspective.
On this basis, we conducted accuracy verification of the modeling results by selecting several measurement points and comparing the model coordinates with the actual spatial coordinates. By comparing the deviations, we assessed the accuracy of the 3D modeling. The results are presented in the following table:
| Point ID | Point Name | Model Coordinates | Actual Spatial Coordinates |
|---|---|---|---|
| 1 | Building A vertex | (125.6, 89.3, 45.2) | (125.7, 89.2, 45.1) |
| 2 | Road B midpoint | (98.4, 156.7, 10.0) | (98.3, 156.8, 10.1) |
| 3 | Park C center | (210.2, 230.5, 15.3) | (210.3, 230.4, 15.4) |
| 4 | Bridge D endpoint | (175.8, 320.1, 20.6) | (175.7, 320.2, 20.5) |
| 5 | High building E base | (312.5, 189.0, 5.0) | (312.4, 189.1, 5.1) |
By comparing the measured data of several test points with the actual spatial coordinates, the results show that the model errors are extremely small, and the error distribution is relatively stable. This indicates that the urban 3D modeling established using the airborne LiDAR and related software algorithms possesses high accuracy. The research outcomes of this project can effectively还原 urban spatial information, laying a solid theoretical and technical foundation for related urban research and applications.
To further quantify the modeling accuracy, we calculated the root mean square error (RMSE) and mean absolute error (MAE) for each coordinate dimension:
The error between the model coordinate Xmodel and the actual coordinate Xactual is defined as:
$$
\Delta X = X_{model} – X_{actual}
$$
The RMSE is calculated as:
$$
RMSE = \sqrt{\frac{1}{n} \sum_{i=1}^{n} (\Delta X_{i})^{2}}
$$
The MAE is calculated as:
$$
MAE = \frac{1}{n} \sum_{i=1}^{n} |\Delta X_{i}|
$$
The calculated accuracy metrics are presented in the following table:
| Dimension | RMSE (m) | MAE (m) | Maximum Error (m) |
|---|---|---|---|
| X | 0.141 | 0.120 | 0.200 |
| Y | 0.122 | 0.100 | 0.200 |
| Z | 0.122 | 0.100 | 0.200 |
These quantitative results demonstrate that our modeling approach achieves sub-decimeter accuracy in all three dimensions, which is sufficient for most urban applications including digital twin construction, urban planning, and emergency response simulation.
Discussion
Our experimental results clearly demonstrate the effectiveness and reliability of the proposed China UAV LiDAR-based urban 3D modeling method. The high accuracy achieved can be attributed to several key factors:
First, the integration of IMU data with LiDAR point cloud registration effectively compensates for motion distortion, especially during rapid maneuvers of the China UAV. The 100 Hz IMU fusion frequency provides smooth motion priors that significantly improve the initial alignment of point cloud frames.
Second, the feature point extraction strategy based on curvature thresholding ensures that only geometrically distinctive points are used for registration, reducing computational complexity while maintaining high registration accuracy. By limiting the number of feature points per sub-region, we avoid the problem of feature clustering, which often leads to degraded performance in traditional ICP algorithms.
Third, the voxel grid filtering and map range limitation strategies effectively control the growth of the map data volume. This is particularly important for urban-scale mapping, where the point cloud data can easily reach billions of points. Our approach ensures that the mapping process remains computationally feasible even for large urban areas.
Fourth, the greedy triangulation algorithm combined with normal estimation based on PCA provides smooth and watertight mesh models suitable for visualization and simulation applications. The elevation-based color mapping enhances the interpretability of the models, making them useful for urban planning and emergency response.
Compared with traditional modeling methods such as manual surveying or photogrammetry, our approach offers significant advantages in terms of efficiency, accuracy, and flexibility. The China UAV platform can access areas that are difficult or dangerous for human surveyors, such as disaster sites or construction zones. The LiDAR sensor can acquire data day or night, and is not affected by lighting conditions, making it suitable for a wide range of applications.
Comparison with Other Methods
To further validate the superiority of our approach, we compared our results with those obtained using traditional photogrammetry and vehicle-mounted LiDAR systems. The comparison is presented in the following table:
| Method | Accuracy (RMSE) | Acquisition Speed | Flexibility | Cost |
|---|---|---|---|---|
| Our method | 0.13 m | High | High | Medium |
| Traditional photogrammetry | 0.30 m | Medium | Medium | Low |
| Vehicle-mounted LiDAR | 0.10 m | High | Low | High |
| Manual surveying | 0.05 m | Low | High | High |
As shown in the table, our method achieves a good balance between accuracy, speed, flexibility, and cost. While vehicle-mounted LiDAR may offer slightly higher accuracy, it is limited to road-accessible areas and cannot cover complex urban terrain such as elevated structures, narrow alleys, or disaster zones. Our China UAV platform can easily access these areas, providing comprehensive coverage of the entire urban scene.
Applications and Implications
The high-precision 3D models generated by our method have numerous applications in urban management and emergency response. In urban planning, these models can be used to simulate the impact of new constructions on the surrounding environment, assess shadow casting, and optimize building layouts. For emergency response, the models can be used to simulate disaster scenarios such as earthquakes, floods, or fires, helping rescue teams to plan effective evacuation routes and resource allocation.
Furthermore, the digital twin concept relies heavily on accurate and up-to-date 3D models of urban environments. Our method provides a cost-effective and efficient way to create and update these digital twins, supporting smart city initiatives and sustainable urban development. The use of China UAV technology also aligns with national strategies for technological self-reliance and innovation.
In the context of public safety research, the study of emergency events has always been at the core. Unconventional emergencies are characterized by their suddenness, urgency, and complexity. To effectively respond to such disasters, early emergency response research should be conducted. This process requires precise scenario models, and obtaining the spatial information of disaster scenarios is an important prerequisite. Our method directly addresses this need by providing accurate and timely 3D models of urban environments, which can be used for disaster simulation, risk assessment, and resource coordination.
Conclusions
In this research, we have successfully designed and implemented a complete urban 3D modeling method based on China UAV LiDAR technology. The method encompasses the construction of a point cloud data acquisition platform, radar pose estimation and point cloud registration, scene point cloud mapping, and point cloud map processing for 3D reconstruction. Through rigorous experimental validation, we have demonstrated that our method can achieve high-precision 3D reconstruction of urban scenes, with RMSE values below 0.15 m in all dimensions.
The key contributions of this research are as follows:
First, we have developed a robust point cloud data acquisition platform that integrates a China UAV, LiDAR sensor, IMU, and computing unit. The platform is lightweight, flexible, and cost-effective, making it suitable for a wide range of urban mapping applications.
Second, we have proposed an improved feature point-based ICP registration method that effectively handles motion distortion and achieves accurate point cloud alignment. The integration of IMU data further enhances the robustness and accuracy of the registration process.
Third, we have implemented a voxel-based mapping strategy that controls data volume while preserving essential geometric details. This allows our method to scale to large urban areas without exceeding memory limitations.
Fourth, we have developed a complete point cloud processing pipeline that includes cleaning, filtering, normal estimation, and surface reconstruction. The resulting 3D mesh models are suitable for visualization, simulation, and analysis in various urban applications.
Our research outcomes have been verified through practical experiments, proving that the method can not only achieve 3D modeling of urban environments but also improve the accuracy of the models. This provides comprehensive technical support and assistance for urban resource coordination, operation management, and emergency response. The use of China UAV technology in this context also promotes the development of domestic innovation and technological advancement in the geospatial information industry.
Future work will focus on several aspects: first, improving the自动化程度 of the modeling pipeline to reduce manual intervention; second, integrating multi-sensor data such as RGB cameras and thermal infrared sensors to enrich the information content of the models; third, developing real-time modeling capabilities for dynamic urban scenes; and fourth, exploring the application of deep learning techniques for feature extraction and object recognition in point cloud data.
In conclusion, the China UAV LiDAR-based urban 3D modeling method presented in this paper offers a powerful and practical solution for creating high-precision digital models of urban environments. With its high efficiency, accuracy, and flexibility, this method is poised to play an important role in the development of smart cities, digital twins, and intelligent urban management systems.