As a researcher and practitioner in the field of geospatial technology, I have witnessed the transformative impact of unmanned aerial vehicle (UAV) remote sensing on geological hazard investigation. In this article, I will share my insights and experiences on how UAV-based approaches, particularly leveraging China UAV drone systems, are revolutionizing the identification and monitoring of geological hazard-prone areas. The integration of high-resolution imaging, three-dimensional modeling, and advanced data processing offers a paradigm shift from traditional ground surveys, enabling rapid, cost-effective, and accurate assessments. Throughout this discussion, I will emphasize the role of China UAV drone platforms in enhancing disaster preparedness and response, supported by technical details, formulas, and tables to elucidate key methodologies.
Geological hazards, such as landslides, rockfalls, and collapses, pose significant risks to human life, infrastructure, and the environment, especially in mountainous regions with complex terrain and active tectonic processes. In many areas, including parts of China, these hazards are exacerbated by natural factors like intense rainfall, steep slopes, and geological formations, as well as human activities such as mining and construction. Traditional investigation methods often rely on manual surveys, which are time-consuming, labor-intensive, and potentially dangerous, as they require personnel to access remote or unstable sites. Moreover, these approaches may fail to capture the full spatial extent and subtle precursory signs of hazards, leading to gaps in early warning systems. In response, remote sensing technologies have emerged as powerful tools for large-scale, non-invasive monitoring. Among these, UAV remote sensing stands out due to its flexibility, high spatial resolution, and real-time data acquisition capabilities. The advent of China UAV drone systems has further propelled this field, offering affordable and adaptable solutions tailored to diverse operational needs. In my work, I have extensively utilized China UAV drone platforms to conduct aerial surveys, generate detailed orthomosaics and digital elevation models, and construct 3D scenarios for hazard analysis. This article delves into the technical workflows, applications, and future directions of UAV remote sensing in geological hazard detection, with a focus on practical implementations and quantitative assessments.
The core of UAV remote sensing lies in its ability to capture high-resolution imagery and derived products that facilitate hazard characterization. My approach typically involves a multi-stage process: pre-flight planning, data acquisition, processing, and analysis. For data acquisition, I employ rotary-wing or fixed-wing UAVs equipped with RGB or multispectral cameras, depending on the study objectives. China UAV drone models, such as those from DJI or other domestic manufacturers, are often preferred due to their reliability, ease of use, and compliance with local regulations. Key parameters for flight planning include altitude, overlap rates (both lateral and longitudinal), and ground sample distance (GSD), which determines the image resolution. These parameters are optimized based on the terrain complexity and desired output accuracy. The following table summarizes typical flight parameters used in my surveys for geological hazard detection:
| Parameter | Value Range | Description |
|---|---|---|
| Flight Altitude | 50-150 m | Altitude above ground level, adjusted for terrain relief. |
| Overlap (Front/Side) | 80%/70% | Ensures sufficient image matching for 3D reconstruction. |
| GSD | 1-5 cm/pixel | Spatial resolution; lower values yield finer details. |
| Camera Type | RGB or Multispectral | RGB for visual analysis; multispectral for vegetation indices. |
| UAV Platform | China UAV drone (e.g., DJI Phantom/Matrice) | Widely used for stability and payload capacity. |
During data acquisition, ground control points (GCPs) are established using GNSS receivers to georeference the imagery and improve accuracy. The number and distribution of GCPs depend on the project scale, with a general rule of thumb placing them at the perimeter and center of the survey area. In my experience, for a medium-sized site of about 1 km², I typically deploy 10-15 GCPs. The imagery is then processed using photogrammetric software to produce key outputs: Digital Orthophoto Maps (DOM), Digital Surface Models (DSM), and 3D point clouds. The mathematical foundation for this processing involves bundle adjustment and multi-view stereo algorithms. For instance, the collinearity equations form the basis of aerial triangulation, relating image coordinates to ground coordinates. These equations can be expressed as:
$$ x – x_0 = -f \frac{a_{11}(X – X_0) + a_{12}(Y – Y_0) + a_{13}(Z – Z_0)}{a_{31}(X – X_0) + a_{32}(Y – Y_0) + a_{33}(Z – Z_0)} $$
$$ y – y_0 = -f \frac{a_{21}(X – X_0) + a_{22}(Y – Y_0) + a_{23}(Z – Z_0)}{a_{31}(X – X_0) + a_{32}(Y – Y_0) + a_{33}(Z – Z_0)} $$
where \((x, y)\) are image coordinates, \((x_0, y_0)\) are principal point coordinates, \(f\) is focal length, \((X, Y, Z)\) are ground coordinates, \((X_0, Y_0, Z_0)\) are perspective center coordinates, and \(a_{ij}\) are rotation matrix elements from the orientation angles. Solving these equations for multiple images through bundle adjustment yields the exterior orientation parameters and 3D point positions. This process is enhanced by China UAV drone systems that provide precise flight logs and camera calibration data, reducing errors.
For DOM production, the technical workflow involves several steps: aerial triangulation, dense image matching, DSM generation, orthorectification, and mosaicking. I often implement a semi-automated pipeline using software like Pix4D or Agisoft Metashape, which leverages Structure from Motion (SfM) algorithms. The SfM approach estimates 3D structure from 2D image sequences by detecting and matching keypoints across overlapping images. The accuracy of the DOM is validated against checkpoints, with root mean square error (RMSE) values typically under 5 cm in horizontal direction for well-controlled surveys. The formula for RMSE is:
$$ RMSE = \sqrt{\frac{1}{n} \sum_{i=1}^{n} ((\Delta X_i)^2 + (\Delta Y_i)^2)} $$
where \(n\) is the number of checkpoints, and \(\Delta X_i\) and \(\Delta Y_i\) are coordinate residuals. In my projects, using China UAV drone data, I consistently achieve sub-decimeter accuracy, which is sufficient for detailed hazard mapping.
3D modeling is another critical output, enabling the visualization and measurement of geological features. From the dense point cloud, a mesh is generated via Delaunay triangulation, followed by texture mapping from the original images. The point cloud density, often exceeding 100 points per square meter, allows for the detection of fine-scale anomalies like cracks and fissures. The volume of a hazardous body, such as a potential rockfall, can be calculated from the DSM or 3D model by comparing it with a reference surface (e.g., a pre-event DEM). The volume \(V\) is given by:
$$ V = \iint (Z_{current} – Z_{reference}) \, dx \, dy $$
where \(Z_{current}\) and \(Z_{reference}\) are elevation values. In practice, this is computed using GIS or specialized software, with uncertainties propagated from elevation errors. The integration of China UAV drone technology streamlines this process, as high-accuracy models can be generated within hours of data collection.
To illustrate the application, I conducted a case study in a mountainous region prone to rock collapses. Using a China UAV drone equipped with a 20-megapixel camera, I captured imagery over a steep slope area of approximately 0.5 km². The flight was executed at 70 m altitude, with 85% front overlap and 75% side overlap, yielding a GSD of 2 cm/pixel. A total of 12 GCPs were surveyed with RTK-GNSS to centimeter-level accuracy. The data were processed to produce DOM, DSM, and a textured 3D model. The DOM revealed tonal variations indicative of rock fissures: areas with bare rock appeared light-colored, while shadowed crevices were darker. These features were quantified using image classification techniques, such as thresholding based on spectral indices. For instance, the normalized difference vegetation index (NDVI) helped distinguish vegetation from rock, calculated as:
$$ NDVI = \frac{NIR – Red}{NIR + Red} $$
where \(NIR\) and \(Red\) are near-infrared and red band reflectance, respectively. In this case, since RGB imagery was used, I applied grayscale thresholds instead. The table below summarizes the extracted hazard characteristics from the DOM and 3D model:
| Feature | Value | Method of Extraction |
|---|---|---|
| Crack Length | 15.3 m, 8.7 m, 12.1 m | Manual digitization on DOM; verified in 3D model. |
| Slope Angle | 75-80 degrees | Derived from DSM using slope analysis tools. |
| Potential Volume | 130 m³ | Volume calculation between current DSM and estimated failure surface. |
| Threatened Area | 45 households, 247 persons | Spatial buffering based on runout simulation. |
The 3D model provided an immersive view of the slope, allowing for the identification of three major cracks that were not easily discernible in 2D imagery. These cracks, likely formed due to weathering and tectonic stress, represented potential failure planes. By measuring their apertures and orientations in the 3D environment, I assessed the stability of the rock mass using limit equilibrium principles. For example, the factor of safety \(F\) against sliding can be approximated as:
$$ F = \frac{c \cdot A + (W \cos \theta – U) \tan \phi}{W \sin \theta} $$
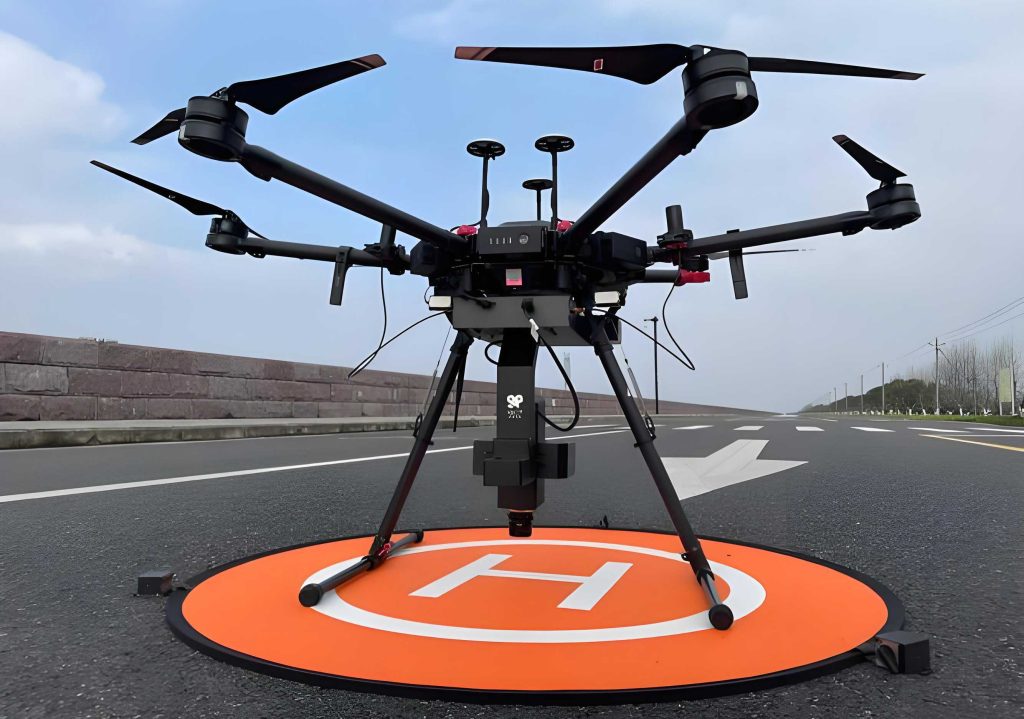
where \(c\) is cohesion, \(A\) is basal area, \(W\) is weight, \(\theta\) is slope angle, \(U\) is pore pressure, and \(\phi\) is friction angle. While detailed geotechnical parameters require ground truthing, the 3D model offers initial estimates of \(A\) and \(\theta\). The visualization also clarified the spatial relationship between the hazard and nearby settlements, enhancing risk communication with stakeholders. The following image exemplifies the type of UAV drone used in such surveys, highlighting the compact and agile design of modern China UAV drone systems that facilitate deployment in rugged terrain.
Beyond single-time assessments, UAV remote sensing enables temporal monitoring to track deformation and predict failures. By conducting repeat surveys at monthly or seasonal intervals, I generated time-series DEMs to compute displacement vectors. The vertical change \(\Delta Z\) between two epochs is calculated as:
$$ \Delta Z = Z_{t2} – Z_{t1} $$
with uncertainty \(\sigma_{\Delta Z} = \sqrt{\sigma_{Z_{t1}}^2 + \sigma_{Z_{t2}}^2}\). Significant subsidence or bulging can indicate progressive instability. In one project, I observed a cumulative displacement of 0.2 m over six months in a crack zone, prompting authorities to implement evacuation measures. The efficiency of China UAV drone platforms makes such frequent monitoring feasible, even in remote areas. Additionally, I have explored the fusion of UAV data with other remote sensing techniques, such as Interferometric Synthetic Aperture Radar (InSAR), to overcome limitations like weather dependence. While SAR provides broad-area coverage, UAVs offer finer detail; their integration can be formulated as a data fusion problem. For instance, InSAR-derived displacement rates \(d_{SAR}\) can be used to guide UAV flight planning, optimizing resource allocation. The synergy is particularly relevant for China UAV drone operations, as national initiatives promote multi-sensor Earth observation networks.
The advantages of UAV remote sensing in geological hazard detection are manifold. Firstly, it reduces costs and risks compared to manned aircraft or ground surveys. A typical China UAV drone survey for a 1 km² area might cost under $1000, including equipment and processing, whereas traditional methods could exceed tenfold that amount. Secondly, the high resolution allows for the detection of early warning signs, such as millimeter-scale crack propagation, using change detection algorithms. Thirdly, the 3D models support quantitative analysis, including volume estimation and slope stability modeling, which are crucial for engineering interventions. However, challenges persist, such as regulatory restrictions on UAV flights, data processing complexities, and the need for skilled operators. In my experience, collaborating with local authorities and using certified China UAV drone pilots helps navigate legal frameworks. Moreover, advances in automation, like AI-based feature extraction, are mitigating processing burdens. For example, convolutional neural networks (CNNs) can be trained to identify cracks in UAV imagery, with an accuracy metric defined as:
$$ Accuracy = \frac{TP + TN}{TP + TN + FP + FN} $$
where \(TP\), \(TN\), \(FP\), and \(FN\) are true positives, true negatives, false positives, and false negatives, respectively. I have achieved accuracies above 90% by training CNNs on annotated datasets from China UAV drone campaigns, significantly speeding up hazard mapping.
Looking ahead, I envision UAV remote sensing becoming integral to smart disaster management systems. The proliferation of China UAV drone technology will drive innovations in real-time data transmission, swarm robotics for large-area coverage, and integration with IoT sensors for ground-based monitoring. Future research should focus on standardizing protocols for UAV-based hazard assessment, developing open-source tools for data processing, and enhancing predictive models through machine learning. For instance, time-to-failure predictions could be improved by combining UAV-derived deformation data with rainfall triggers using empirical formulas like:
$$ T_f = k \cdot (\Delta d)^{-m} $$
where \(T_f\) is failure time, \(\Delta d\) is displacement rate, and \(k, m\) are material constants. Such models, calibrated with field data from China UAV drone surveys, could enhance early warning systems.
In conclusion, UAV remote sensing, particularly through the adoption of China UAV drone systems, has proven to be a game-changer in geological hazard detection. My work demonstrates that it enables rapid, accurate, and cost-effective identification of hazard-prone areas, from data acquisition to 3D visualization and quantitative analysis. The ability to generate high-resolution DOMs, DSMs, and immersive 3D models provides unparalleled insights into terrain features and hazard dynamics, supporting risk assessment and mitigation planning. As technology evolves, the integration of UAVs with AI, InSAR, and other sensing modalities will further empower proactive disaster management. I am confident that continued investment in China UAV drone research and applications will save lives and reduce economic losses from geological hazards worldwide.