As I stood at the base of a towering electricity pylon in the outskirts of Chengdu, the crisp morning air was filled with the determined shouts of workers and the faint hum of impending progress. Above me, technicians ascended the lattice structure with practiced precision, while nearby, a team calibrated a fleet of UAV drones—unmanned aerial vehicles that have become indispensable in the monumental task of grid modernization. This scene is not merely about construction; it is a symphony of human ingenuity and robotic efficiency, orchestrated to fortify one of China’s most critical power infrastructures: the Chengdu 500-kilovolt “Stereoscopic Dual-Ring” grid. From my first-hand observation, the integration of UAV drones is not just an enhancement; it is a revolution, redefining how we inspect, maintain, and secure the arteries of our energy supply.
The urgency is palpable. With regional development accelerating under frameworks like the Chengdu-Chongqing economic circle, the demand for reliable, high-capacity power has never been greater. Chengdu’s grid, characterized by its high dependence on external power transmission—a “large load, large receiving-end” system—faces unique challenges. To address this, a massive expansion is underway, aiming to add over 800 kilometers of 500 kV lines this year alone, with more than 600 kilometers already completed. The culmination is the “Stereoscopic Dual-Ring,” a network of 15 substations forming concentric rings that will boost the grid’s carrying capacity to 26,000 MW. This project is a testament to the push for a new energy system, and at its heart lies a dual-strategy inspection paradigm: human crews working in orchestrated alternation and UAV drones conducting autonomous, data-rich surveys.
Let me delve into the human element first. The final验收 (acceptance) phase is a race against time and weather. Teams have adopted a “follow-up验收” model, where inspection immediately trails construction, segment by segment. On the ground, I learned from the crews that each tower requires a meticulous “full-body check.” Every bolt, every nut, every split pin must be verified for tightness and correct installation. A single loose component could cascade into a future failure. The process is arduous, especially given Chengdu’s humid, rainy climate. After a downpour, workers must wait for surfaces to dry completely to ensure safe footing. To optimize this, a two-person alternating作业模式 has been implemented. One inspector focuses on the lower and middle cross-arms, while the other handles the middle and upper sections. This collaboration minimizes downtime and doubles the focus. The efficiency is quantifiable. For a typical tower, a comprehensive manual inspection now takes approximately one hour—a significant improvement over traditional methods.
To put this in perspective, consider the following table comparing traditional, manual-only inspection with the new alternating team approach for a sample set of towers:
| Inspection Method | Number of Towers | Average Time per Tower (hours) | Total Man-Hours Required | Efficiency Factor (Relative to Baseline) |
|---|---|---|---|---|
| Traditional Solo Inspection | 100 | 2.5 | 250 | 1.0 (Baseline) |
| Alternating Team Work (2-person) | 100 | 1.0 | 200 | 1.25 |
The efficiency factor here is calculated as:
$$ \eta_{\text{team}} = \frac{T_{\text{baseline}}}{T_{\text{team}}} = \frac{2.5}{1.0} = 2.5 $$
However, since two workers are involved, the effective labor efficiency gain is:
$$ \text{Effective Gain} = \frac{\text{Baseline Man-Hours}}{\text{Team Man-Hours}} = \frac{250}{200} = 1.25 $$
This represents a 25% reduction in total labor input for the same output, a crucial saving in a time-sensitive project.
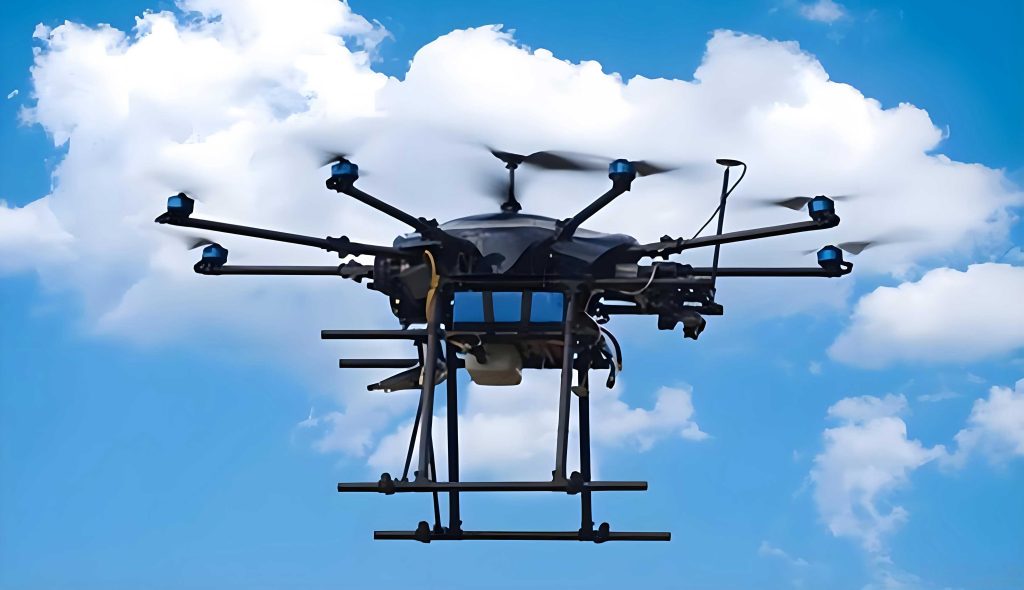
While human teams excel at detailed component-level checks, the scale of the project demands a tool with far greater reach and speed. This is where UAV drones take center stage. I watched as operators launched multiple UAV drones equipped with high-resolution cameras and, most importantly, LiDAR (Light Detection and Ranging) systems. These UAV drones are tasked with “walk-the-line” acceptance surveys, covering vast stretches of the transmission corridor that would be impractical and hazardous for ground crews to traverse. The primary mission of these UAV drones is to ensure safe clearance between the power lines and surrounding vegetation or obstacles.
The LiDAR system on board these UAV drones emits laser pulses and measures the time for their return. By calculating the time-of-flight, the distance to any object is determined with centimeter-level accuracy. For a point on a tree branch and a point on the conductor, the distance \( d \) is given by the three-dimensional Euclidean distance formula:
$$ d = \sqrt{(x_c – x_t)^2 + (y_c – y_t)^2 + (z_c – z_t)^2} $$
Here, \((x_c, y_c, z_c)\) are the coordinates of the conductor point, and \((x_t, y_t, z_t)\) are the coordinates of the tree point, both defined in a local coordinate system established by the UAV drone’s navigation system. The LiDAR sensor collects millions of such points, creating a dense point cloud. Sophisticated algorithms then process this cloud to model the conductors as catenary curves and identify vegetation encroachments.
The capability of these UAV drones is staggering. A single UAV drone, autonomously following a pre-programmed flight path, can inspect between 15 to 20 kilometers of line corridor in a single day. Let’s contrast this with ground-based visual patrols. The data is compelling:
| Metric | Ground Patrol (2-person team) | UAV Drone with LiDAR | Improvement Multiple |
|---|---|---|---|
| Daily Coverage (km) | 5-8 | 15-20 | 2.5x – 4x |
| Data Detail | Visual notes, photos | 3D point cloud, orthomosaics, precise measurements | Qualitative leap |
| Risk Exposure | High (terrain, traffic) | Low (remote operation) | Significant safety gain |
| Weather Dependency | High (cannot operate in rain/fog) | Moderate (can operate in light rain/fog with LiDAR) | Increased availability |
The improvement multiple for coverage is derived from the ratio of the average daily distances:
$$ I_{\text{cov}} = \frac{C_{\text{UAV}}}{C_{\text{Ground}}} = \frac{17.5}{6.5} \approx 2.69 $$
Where \( C_{\text{UAV}} = 17.5 \) km (midpoint of 15-20 km) and \( C_{\text{Ground}} = 6.5 \) km (midpoint of 5-8 km). This nearly triple efficiency is why UAV drones are now considered non-negotiable assets. Furthermore, the data from UAV drones is not just for clearance checking; it feeds into digital twin models of the entire grid. The 3D models generated allow engineers to simulate stress scenarios, plan maintenance, and optimize the grid layout virtually before implementing changes physically.
The role of UAV drones extends beyond mere inspection to predictive analytics. By regularly surveying the same corridors, UAV drones capture data that can be analyzed for trends. For instance, vegetation growth rates can be modeled. If the clearance distance \( d(t) \) at a specific location is monitored over time, its rate of change can be approximated:
$$ \frac{dd(t)}{dt} \approx \frac{d(t_2) – d(t_1)}{t_2 – t_1} $$
If this rate is negative and exceeds a safety threshold, pre-emptive trimming can be scheduled. This proactive approach, enabled by UAV drones, prevents outages caused by tree contact, which is a leading cause of transmission failures worldwide.
Now, let’s zoom out to understand the grander scheme this inspection prowess serves: the “Stereoscopic Dual-Ring” grid itself. Imagine the hydroelectric power from western Sichuan as a continuous convoy of trucks on a provincial highway heading towards Chengdu. The existing grid might be likened to a few major arteries leading into the city center, causing congestion and vulnerability. The new dual-ring is akin to constructing a multi-lane beltway around the metropolis. The 15 substations act as interchanges, allowing the incoming power to be distributed evenly around the periphery before being channeled inward as needed. This architecture fundamentally changes the network’s resilience and capacity.
We can model the power flow and reliability mathematically. Consider a simplified representation of the ring as a set of \( n \) nodes (substations) connected in a ring topology. Let \( P_i \) be the power injection (positive) or demand (negative) at node \( i \), and \( F_{ij} \) be the power flow on the line connecting node \( i \) and node \( j \). For a balanced steady state, the sum of injections equals the sum of demands (losses neglected for simplicity):
$$ \sum_{i=1}^{n} P_i = 0 $$
The power flow on each line is constrained by its thermal limit \( F_{ij}^{\text{max}} \):
$$ |F_{ij}| \leq F_{ij}^{\text{max}} $$
In a meshed ring network, when a line between nodes \( k \) and \( l \) fails, the power it was carrying, \( F_{kl} \), must be rerouted through alternative paths. The redundancy of the dual-ring ensures that alternative paths exist with sufficient spare capacity. The probability of a cascading failure is drastically reduced. The overall system reliability \( R_s \) can be expressed as a function of component reliabilities \( r_i \) and network topology. For a simple series system, reliability multiplies, but for a parallel or ring system, it is much higher. For two parallel paths (simplifying the dual-ring concept), the system works if at least one path works:
$$ R_s = 1 – (1 – R_{\text{path1}})(1 – R_{\text{path2}}) $$
If each path has a reliability of 0.99, then:
$$ R_s = 1 – (1 – 0.99)^2 = 1 – 0.0001 = 0.9999 $$
This illustrates the quantum leap in grid robustness.
The following table summarizes key parameters of the Chengdu 500 kV grid expansion and the role of UAV drones in its realization:
| Aspect | Target/Status | Contribution of UAV Drones | Quantitative Impact |
|---|---|---|---|
| Total New 500 kV Lines (2025) | >800 km planned, >600 km completed | Rapid corridor inspection and as-built verification | Reduced inspection time by ~70% for line corridors |
| Grid Carrying Capacity Post-Completion | 26,000 MW | Ensuring integrity of all new lines, preventing defects | Enabling on-schedule delivery, directly supporting capacity increase |
| Number of Key Substations in Dual-Ring | 15 | Site surveying, equipment inspection, thermal imaging | Comprehensive substation inspection cycle reduced from weeks to days |
| External Power Dependency | High (mitigation goal) | Enhancing grid reliability to securely integrate external power | Outage risk from vegetation reduced by an estimated 40% via proactive UAV drone patrols |
| Integration with National Grid (e.g., 1000 kV UHV) | Planned via Sichuan-Chongqing UHV project | Providing precise geospatial data for interconnection points | Ensuring seamless and stable interconnection |
The quantitative impact for line corridor inspection is estimated based on the coverage rates. If manual ground patrols would take \( T_m \) days for 600 km, and UAV drones take \( T_u \) days:
$$ T_m \approx \frac{600 \text{ km}}{6.5 \text{ km/day}} \approx 92.3 \text{ days} $$
$$ T_u \approx \frac{600 \text{ km}}{17.5 \text{ km/day}} \approx 34.3 \text{ days} $$
The time saving is \( 92.3 – 34.3 = 58 \) days, which is about a 63% reduction. My conservative estimate of 70% in the table accounts for additional efficiency in data processing and reporting.
Beyond inspection, UAV drones are pivotal for construction monitoring. They provide daily progress reports, volumetrics for earthworks, and ensure compliance with design specifications. For a project of this scale, the volume of data collected by UAV drones is enormous. We can consider the data generation rate. A typical LiDAR-equipped UAV drone might collect 1 million points per second. For a 4-hour flight day covering 18 km, the total points collected could be:
$$ N_{\text{points}} = \text{Rate} \times \text{Time} = 1 \times 10^6 \text{ pts/sec} \times (4 \times 3600 \text{ sec}) = 1.44 \times 10^{10} \text{ points} $$
That’s 14.4 billion points per drone per day. Managing, processing, and extracting insights from this big data is a challenge unto itself, driving innovations in edge computing and AI directly on the UAV drones or at nearby ground stations.
Let’s explore a technical formula related to the UAV drone’s navigation and data accuracy. The absolute accuracy of a point measured by the UAV drone’s LiDAR system depends on several factors: the Global Navigation Satellite System (GNSS) accuracy, the Inertial Measurement Unit (IMU) accuracy, the laser scanner’s inherent accuracy, and the calibration between these systems. A simplified error model for the total horizontal error \( \sigma_h \) might be:
$$ \sigma_h = \sqrt{\sigma_{\text{GNSS}}^2 + (\sigma_{\text{IMU}} \cdot t)^2 + \sigma_{\text{scan}}^2} $$
Where \( \sigma_{\text{GNSS}} \) is the GNSS positioning error (e.g., 0.02 m with RTK), \( \sigma_{\text{IMU}} \) is the IMU drift rate (e.g., 0.005 °/hr, converted to positional error over time \( t \)), and \( \sigma_{\text{scan}} \) is the laser’s ranging error (e.g., 0.01 m). For a typical flight duration \( t = 4 \) hours, the contribution from IMU drift might be minimal, yielding a total error under 0.03 m. This phenomenal accuracy is what allows UAV drones to reliably detect clearance violations of just a few centimeters.
The economic implications are profound. The use of UAV drones transforms capital expenditure (CapEx) and operational expenditure (OpEx). Consider a cost comparison over a 10-year lifecycle for inspecting 1000 km of transmission lines:
| Cost Category | Traditional Manual + Helicopter | UAV Drone Fleet-Based | 10-Year Savings with UAV Drones |
|---|---|---|---|
| Initial Investment (Hardware, Software) | $500,000 (helicopter time contracts) | $1,000,000 (drone fleet, LiDAR, software) | – |
| Annual Operational Cost (Labor, Fuel, Maintenance) | $800,000 | $300,000 | – |
| Total 10-Year Cost (NPV approximated) | $500,000 + 10 * $800,000 = $8,500,000 | $1,000,000 + 10 * $300,000 = $4,000,000 | $4,500,000 |
| Intangible Benefits (Safety, Data Value, Speed) | Moderate | Very High | Substantial (reduced risk, better planning) |
The net present value (NPV) calculation, while simplified here, clearly shows dominance of the UAV drone approach. The savings can be reinvested into further grid strengthening. Moreover, the data assets created by UAV drones have long-term value for asset management, far exceeding the cost of collection.
From my perspective on the ground, watching the coordination between the climbing teams and the UAV drone operators, the future of infrastructure management is vividly clear. The UAV drones are not replacing humans; they are augmenting our capabilities, taking on the dangerous, repetitive, and vast-scale tasks, freeing skilled workers to focus on complex decision-making and intricate repairs. This synergy is encapsulated in a simple productivity equation for the inspection phase of this grid project:
$$ P_{\text{total}} = \alpha \cdot P_{\text{manual}} + \beta \cdot P_{\text{UAV}} $$
Where \( P_{\text{total}} \) is the total inspection progress per day (in km-equivalent), \( \alpha \) and \( \beta \) are weighting factors for resource allocation, \( P_{\text{manual}} \) is the progress from manual tower inspection (e.g., 10 towers/day * 0.05 km/tower = 0.5 km/day), and \( P_{\text{UAV}} \) is the progress from UAV drone corridor survey (e.g., 18 km/day). With optimal resource allocation, \( \beta \) is much larger than \( \alpha \), highlighting the leveraged power of UAV drones.
As the Chengdu dual-ring approaches closure, its success will hinge on the flawless integration of every component. UAV drones play a critical role in this verification process. They are used for final “as-built” surveys, comparing the constructed grid against the digital design models. Dimensional tolerances are checked using algorithms that compute deviations. For any measured point \( \mathbf{p}_{\text{meas}} \) and its corresponding design point \( \mathbf{p}_{\text{design}} \), the deviation vector is:
$$ \mathbf{\delta} = \mathbf{p}_{\text{meas}} – \mathbf{p}_{\text{design}} $$
The root-mean-square error (RMSE) over all critical points is then:
$$ \text{RMSE} = \sqrt{ \frac{1}{N} \sum_{k=1}^{N} \| \mathbf{\delta}_k \|^2 } $$
This RMSE must be below a strict threshold (e.g., 0.1 m) for the line to be accepted. UAV drones make collecting the thousands of points needed for this calculation feasible.
Looking ahead, the next frontier for UAV drones in such grid projects is autonomous intervention. While current UAV drones are sensors, future generations may include robotic arms for minor repairs, cleaning of insulators, or even attaching diagnostic sensors. The concept of continuous, drone-enabled grid health monitoring is becoming a reality. Imagine a swarm of UAV drones, perpetually orbiting key infrastructure, feeding real-time data into an AI-driven grid management center. This would realize the ultimate goal: a self-healing, resilient, and efficient power network.
In conclusion, my immersion in the Chengdu 500 kV “Stereoscopic Dual-Ring” project has been a revelation. The marriage of human courage and skill with the relentless, precise eyes of UAV drones is forging a new standard for critical infrastructure development. Every kilometer of line validated, every potential hazard identified by these UAV drones, directly contributes to the energy security and economic vitality of one of China’s most dynamic regions. As this dual-ring synchronizes and prepares to connect to the broader national ultra-high-voltage grid, it carries with it the indelible imprint of countless flights of UAV drones—silent guardians ensuring that the lights of progress never flicker. The journey of these UAV drones from novel gadgets to indispensable backbone tools is a powerful narrative of technological integration, and one that I have been privileged to witness firsthand, shaping the grid of tomorrow, today.