
As a survey engineer deeply involved in railway infrastructure projects, I have witnessed firsthand the transformative impact of UAV drone LiDAR technology on the capacity expansion and reconstruction of existing lines. By the end of 2024, China’s railway network exceeded 162,000 km, with conventional railways accounting for about 70.4% (approximately 114,000 km). The era of massive new construction is shifting toward a balanced phase of both new builds and upgrades. In the context of railway rehabilitation, surveying tasks must simultaneously capture the current conditions of the existing alignment and the topographic data for the new sections. Traditional methods, such as manual ground surveying, expose severe limitations in rugged terrain—low efficiency, high safety risks, and incomplete data coverage. These challenges motivated me to adopt a UAV drone-based LiDAR system for the Baoji–Chengdu Railway expansion project.
The Baoji–Chengdu Railway single-track section from Baoji to Yangpingguan stretches 268.3 km through the mountainous regions of Shaanxi and Gansu provinces. The line climbs over the Qinling Mountains, follows the Jialing River valley, and passes through numerous tunnels and bridges built to low standards more than half a century ago. Key issues include short passing sidings (only 650 m usable length), extensive small-radius curves, severe geological hazards, and mismatched station capacities. The expansion project requires both re‑survey of the existing railway and geodetic acquisition for the new alignment. Traditional ground surveys in these steep, vegetated terrains would demand months of dangerous manual work. I therefore deployed a UAV drone integrated with a lightweight long‑range LiDAR scanner to achieve safe, rapid, and high‑precision data collection.
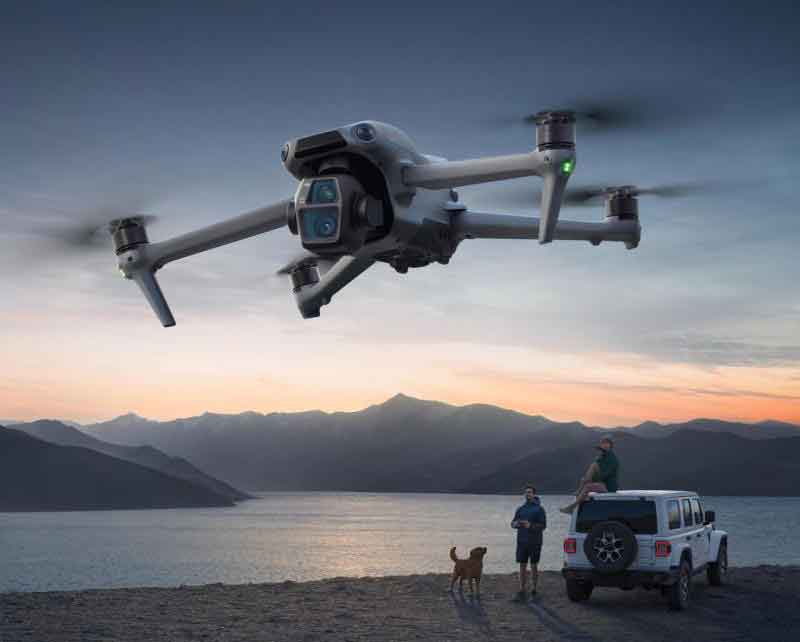
Technical Workflow of UAV Drone LiDAR Survey
I designed a systematic workflow that combines UAV drone flight planning, ground base station deployment, LiDAR data acquisition, and post‑processing. The following table summarises the key parameters of the UAV drone platform and the LiDAR sensor used in this project.
| Parameter | Specification |
|---|---|
| UAV Drone Model | Feima D20 (hexacopter) |
| LiDAR Scanner | DV‑LiDAR30 (multi‑direction scanning) |
| Laser wavelength | 905 nm (Class 1 eye‑safe) |
| Maximum range | 300 m (20% reflectivity) |
| Scanning frequency | 10–200 Hz |
| Field of view | 360° (multi‑plane) |
| Positioning | RTK/PPK GNSS (1 cm + 1 ppm) |
| Flight altitude (existing line) | 80 m |
| Flight altitude (new line) | 100 m |
| Flight speed | 8 m/s |
| Side overlap | 50% |
| Ground base station | Hi‑target GNSS receiver, 5 Hz sampling |
Before each mission, I set up a GNSS base station with known coordinates and synchronised it with the UAV drone’s onboard receiver. The flight paths were designed to follow both sides of the existing railway, ensuring complete coverage of the track area. For station yards, the flight zone was extended to cover the entire forecourt. With a side overlap of 50%, the point density over the rails exceeded 200 points/m², sufficient for extracting track centreline and rail features.
Data Preprocessing and Point Cloud Correction
The raw LiDAR data were processed using a dedicated pipeline. First, I combined the base station GNSS data with the UAV drone’s IMU and GNSS observations in InertialExplorer (tight‑coupling mode) to compute a precise trajectory. The trajectory accuracy was verified through quality reports—positional standard deviations remained below 0.02 m in all axes. After trajectory solution, the laser range data, calibration files, and camera exterior orientation elements were fused in the Feima UAV Manager “Smart LiDAR” module to generate an initial point cloud. The colourised point cloud was created by mapping the RGB values from the synchronised nadir images.
To meet the stringent requirements of railway re‑survey (typically ±2 cm in plan and ±3 cm in height), I deployed 16 ground targets (checkerboard markers) with known coordinates measured by total station. The initial point cloud was corrected using a 7‑parameter Helmert transformation computed from the target discrepancies. The transformation model is given by:
$$
\begin{bmatrix}
X \\ Y \\ Z
\end{bmatrix}_{\text{corrected}} =
\begin{bmatrix}
t_x \\ t_y \\ t_z
\end{bmatrix} +
(1+s) \cdot R(\omega, \phi, \kappa) \cdot
\begin{bmatrix}
X \\ Y \\ Z
\end{bmatrix}_{\text{raw}}
$$
where t represents the translation vector, s the uniform scale factor, and R the rotation matrix derived from three Euler angles. After correction, the point cloud achieved a root mean square error (RMSE) of 1.1 cm in northing, 1.2 cm in easting, and 1.5 cm in elevation, well within the project tolerance.
Point cloud classification was performed using TerraSolid’s “automatic + manual” strategy. The automatic macro used an iterative angle of 20° and an iterative distance of 1.4 m, achieving a classification success rate above 85%. I then manually reclassified mislabelled points (e.g., low vegetation mistakenly classified as ground) using orthophoto overlays and terrain profiles. This hybrid approach ensured that the ground surface model accurately represented the bare earth even under dense canopy cover.
Derived Products and Engineering Applications
From the classified point cloud, I produced a series of deliverables essential for the railway expansion design. The table below lists the main products and their respective specifications.
| Product | Scale / Purpose | Key Extraction Method |
|---|---|---|
| Topographic map | 1:2000 (entire route) and 1:500 (bridges, tunnel portals) | Automatic contour generation; manual editing of breaklines |
| Rail centreline | Existing track re‑survey | Interactive picking in HnAirLiDARManager ; automatic coordinate export every 5 m |
| Cross‑sections | Existing and new alignments | Batch generation from classified ground points; manual addition of rail, ballast, shoulder |
| Culvert & bridge dimensions | Structure renovation | Non‑contact measurement from dense point cloud (clearance, inlet/outlet elevations) |
| Station yard features | Yard re‑survey (turnouts, signals, catenary masts, platforms) | Direct extraction of coordinates, offsets, and mileages |
| Miscellaneous (road, hydrological) | Existing road levelling, longitudinal drainage, building survey | Point cloud extraction of spatial and attribute data |
For the existing railway centreline extraction, I used the HnAirLiDARManager software to interactively select left and right rail points in the 3D point cloud view. The software automatically calculated the centreline coordinates every 5 m. For new alignment sections, centreline points were generated at 10 m intervals, with manual insertion at critical terrain inflection points. The railway cross‑sections were produced by setting a base line and extracting ground points at a fixed offset interval. This process, which would have taken weeks of total station work in the field, was completed in a few hours in the office using the UAV drone LiDAR data.
One of the most significant advantages of the UAV drone LiDAR approach was the ability to measure bridge and culvert structures without any on‑track access. The high‑density point cloud (average 300 points/m² over structures) allowed me to accurately determine the span, clearance height, and inlet/outlet elevations of culverts. Similarly, station yard measurements—such as turnout positions, signal post locations, and platform edges—were extracted with sub‑centimetre precision from the colourised point cloud, eliminating the need for track possession and manual surveying.
Accuracy Verification of UAV Drone LiDAR Results
To quantitatively validate the accuracy of the UAV drone LiDAR point cloud, I compared the coordinates of 16 checkpoints (the same ground targets used for correction) measured independently by total station with those extracted from the final corrected point cloud. The differences in northing, easting, and elevation are summarised in the following table.
| Checkpoint ID | ΔN (cm) | ΔE (cm) | ΔH (cm) |
|---|---|---|---|
| 1 | 1.2 | 0.9 | -1.5 |
| 2 | -0.8 | 1.5 | 1.2 |
| 3 | 1.5 | -1.1 | -0.6 |
| 4 | -1.3 | 0.7 | 1.8 |
| 5 | 0.5 | -1.8 | -1.2 |
| 6 | -1.1 | 1.0 | 0.9 |
| 7 | 0.9 | -0.6 | -2.0 |
| 8 | 1.8 | 1.4 | 1.1 |
| 9 | -1.6 | -1.2 | -0.8 |
| 10 | 0.7 | 1.6 | 1.5 |
| 11 | -0.9 | -1.5 | -1.7 |
| 12 | 1.1 | 0.8 | 2.0 |
| 13 | -1.4 | 1.9 | 0.4 |
| 14 | 1.6 | -0.7 | -1.3 |
| 15 | -0.6 | -1.0 | 1.7 |
| 16 | 1.3 | 1.1 | -1.0 |
The root mean square error (RMSE) for each component is calculated as:
$$
RMSE_N = \sqrt{\frac{1}{16}\sum_{i=1}^{16} (\Delta N_i)^2} = 1.1\ \text{cm}
$$
$$
RMSE_E = \sqrt{\frac{1}{16}\sum_{i=1}^{16} (\Delta E_i)^2} = 1.2\ \text{cm}
$$
$$
RMSE_H = \sqrt{\frac{1}{16}\sum_{i=1}^{16} (\Delta H_i)^2} = 1.5\ \text{cm}
$$
These results confirm that the UAV drone LiDAR point cloud meets the strict accuracy requirements for both existing railway re‑survey and new alignment survey in mountainous terrain. In fact, the elevation RMSE of 1.5 cm is even better than the typical specification of ±3 cm for railway design. The dense vegetation and steep slopes that would have caused severe difficulties for ground‑based methods did not degrade the LiDAR accuracy because the multi‑direction scan pattern captured ground returns through canopy gaps.
Conclusions
Through the successful application of UAV drone LiDAR technology in the Baoji–Chengdu Railway expansion project, I have demonstrated that this approach offers transformative benefits over conventional surveying methods. The primary advantages can be summarised as follows:
- Efficiency gain: Fieldwork time was reduced by over 70% compared with traditional total station traverses. The bulk of the work shifted from hazardous outdoor operations to safe indoor data processing.
- Precision under complex conditions: The combination of RTK/PPK positioning and multi‑directional LiDAR scanning enabled centimetre‑level accuracy even in dense forests and on steep cliffs, areas where manual survey would be impossible or extremely risky.
- Expanded application scope: Beyond topographic mapping, the point cloud directly supported centreline extraction, cross‑section generation, bridge/culvert dimensional measurement, and station yard feature mapping. Many of these tasks were performed using the unclassified point cloud, demonstrating the versatility of the raw data.
The UAV drone LiDAR workflow has now become a standard practice in our organisation for railway expansion projects in complex mountainous regions. I believe that with continuous improvements in sensor range, point density, and automated classification algorithms, this technology will soon replace most ground‑based surveys for railway engineering. The Baoji–Chengdu experience provides a valuable technical reference for similar projects worldwide, especially where safety, speed, and accuracy are paramount.