
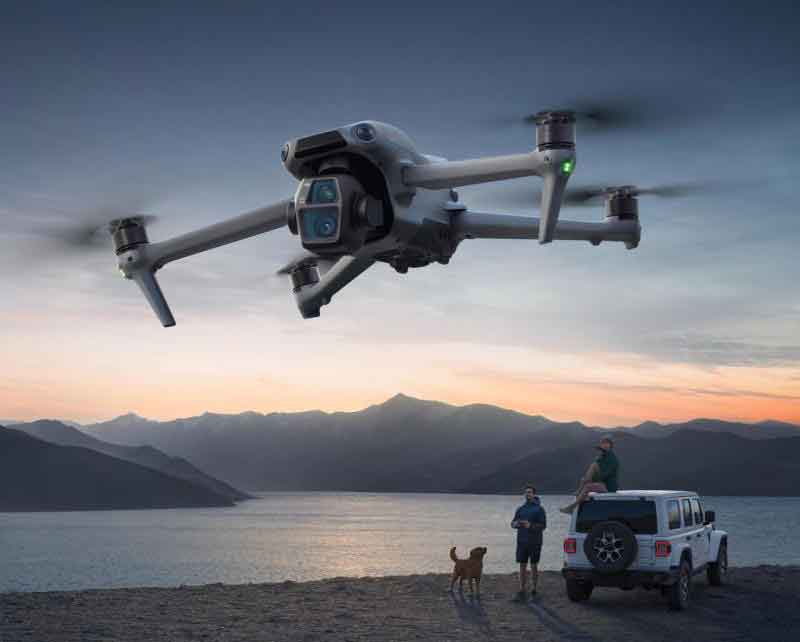
I treat the UAV drone as more than a camera platform. In my work, the UAV drone becomes a mobile sensing node that captures high-resolution visible-light imagery, multispectral responses, and laser point clouds over reservoirs, dams, channels, and shoreline corridors. The central problem I address is not simply data acquisition. The central problem is converting UAV drone imagery into reliable spatial information that supports hydraulic engineering surveying, deformation inspection, terrain reconstruction, and sediment monitoring. Traditional field surveying and manual image interpretation are slow, expensive, and inconsistent in dangerous or inaccessible areas. I therefore build an integrated workflow in which a UAV drone collects data, deep learning models extract features, point clouds are fused, and time-series differencing reveals change. This article explains that workflow in detail, with formulas and tables that summarize the main computations and validation results.
I structure the method around four linked capabilities. First, I extract water boundaries and shoreline features from UAV drone imagery using water indices and semantic segmentation. Second, I identify hydraulic structure defects such as cracks, leakage, spalling, and displacement using object detection and three-dimensional geometry. Third, I reconstruct reservoir terrain by fusing UAV drone image point clouds with lidar point clouds. Fourth, I monitor sediment siltation by differencing multi-epoch digital elevation models and estimating volume change. Each capability uses a UAV drone as the primary or complementary observation platform. I also validate the approach on a reservoir with complex shoreline geometry, a large storage capacity, and multiple hydraulic structures. The results show that UAV drone feature extraction can achieve sub-meter shoreline accuracy, defect recognition accuracy above ninety-one percent, and reliable sediment volume estimation when the acquisition and fusion steps are carefully controlled.
1. Why I Use a UAV Drone for Hydraulic Surveying
I choose a UAV drone because hydraulic surveying often requires three conflicting conditions: high spatial detail, repeated observation, and safe access. A UAV drone can fly below clouds, acquire centimeter-level ground sampling distance, revisit the same site after rain or drawdown, and avoid personnel exposure on steep banks or near spillways. In my experience, the UAV drone is especially useful where the water level changes quickly, where vegetation partially occludes the shoreline, and where the area of interest is too large for total station work but too small or too hazardous for manned aircraft. I do not replace all conventional measurements. Instead, I use the UAV drone to create a dense observation layer that can be checked against control points and bathymetric data.
| Surveying requirement | Traditional approach | UAV drone approach | My observed benefit |
|---|---|---|---|
| Shoreline mapping | Total station or RTK walking along bank | Orthomosaic with NDWI and U-Net segmentation | Faster coverage and repeatable boundary extraction |
| Dam surface inspection | Visual inspection from walkways or ropes | Tilted UAV drone images and Faster R-CNN detection | Safer access and consistent defect records |
| Terrain reconstruction | Ground survey with sparse points | Image point cloud fused with lidar point cloud | Dense terrain detail and better breakline continuity |
| Sediment monitoring | Periodic bathymetric surveys only | Multi-epoch DEM differencing with UAV drone data | Improved shallow-water and shoreline change detection |
| Emergency response | Delayed field mobilization | Rapid UAV drone deployment | Near-real-time situational awareness |
I also consider the UAV drone to be a data fusion platform. A single UAV drone flight can carry a visible-light camera, a multispectral sensor, and a lightweight lidar unit. When I combine these sources, I reduce the weaknesses of each individual sensor. Visible-light imagery gives texture and color, multispectral imagery strengthens water-land separation, and lidar provides geometric points that are less dependent on image texture. The UAV drone therefore supports both semantic interpretation and geometric measurement.
2. Technical Architecture of UAV Drone Feature Extraction
I base the architecture on convolutional neural networks. A convolutional neural network learns hierarchical features from UAV drone imagery. Early layers respond to edges, color gradients, and small textures. Middle layers capture shape and local structure. Deep layers encode semantic context. I use an encoder-decoder design for pixel-level segmentation and a region-based detector for object-level recognition. The encoder extracts multiscale features. The decoder restores spatial resolution. For recognition, a region proposal network generates candidate boxes, and non-maximum suppression removes duplicate detections. I also use attention-like weighting when I fuse image features with point cloud geometry, because not every geometric channel is equally reliable in every terrain condition.
Let the input UAV drone image be \(I\). A convolutional layer computes a feature map:
$$F_{k}(x,y)=\sigma\left(\sum_{c=1}^{C}\sum_{u=-a}^{a}\sum_{v=-b}^{b}W_{k,c}(u,v)I_{c}(x+u,y+v)+b_{k}\right)$$
where \(W\) is the convolution kernel, \(b\) is the bias, \(\sigma\) is a nonlinear activation, \(C\) is the number of input channels, and \(k\) indexes the output feature map. Pooling reduces spatial dimensions while retaining dominant responses:
$$P_{k}(x,y)=\max_{u,v\in\Omega}F_{k}(x+u,y+v)$$
In the decoder, I restore resolution by upsampling and skip connections. The skip connection concatenates deep semantic features with shallow spatial features, which helps retain narrow shoreline details and small cracks. For semantic segmentation, the softmax output gives a probability for each class:
$$p_{c}(x,y)=\frac{\exp(z_{c}(x,y))}{\sum_{j=1}^{K}\exp(z_{j}(x,y))}$$
For object detection, I define the classification loss and bounding-box regression loss as:
$$L=L_{cls}+\lambda L_{reg}$$
where \(L_{cls}\) is the cross-entropy or focal loss over defect classes, and \(L_{reg}\) is a smooth \(L_{1}\) loss for box coordinates. I use these losses because hydraulic defects vary greatly in scale, contrast, and shape.
| Module | Function in my workflow | Input from UAV drone | Output |
|---|---|---|---|
| NDWI calculator | Enhance water-land contrast | Green and near-infrared bands | Initial water mask |
| U-Net segmenter | Refine shoreline pixels | Multispectral and visible imagery | Water probability map |
| Conditional random field | Smooth boundaries and remove noise | Probability map plus image edges | Clean water mask |
| Faster R-CNN | Detect cracks, leakage, spalling, displacement | Tilted UAV drone images | Defect boxes and classes |
| ResNet-50 backbone | Extract deep texture and shape features | Image patches | Feature vectors |
| Feature pyramid network | Improve small-object detection | Multilevel feature maps | Scale-aware features |
| ICP fusion | Register image and lidar point clouds | UAV drone image cloud and lidar cloud | Unified point cloud |
| DEM differencing | Quantify sediment change | Multi-epoch elevation models | Siltation thickness and volume |
3. Water Boundary and Shoreline Feature Extraction
I begin water boundary extraction with a normalized difference water index. The index uses the contrast between green reflectance and near-infrared reflectance. Water usually appears bright in the green band and dark in the near-infrared band. I compute the index as:
$$NDWI=\frac{\rho_{Green}-\rho_{NIR}}{\rho_{Green}+\rho_{NIR}}$$
where \(\rho_{Green}\) is green-band reflectance and \(\rho_{NIR}\) is near-infrared reflectance. Values close to one indicate water. Values close to negative one indicate land. In my practical workflow, I often use a threshold between \(0.3\) and \(0.5\) to create an initial water mask. I then refine that mask with a U-Net semantic segmentation network. The U-Net consumes the UAV drone image and the NDWI layer, and it predicts a water probability at every pixel. The encoder path uses convolution and pooling to capture context. The decoder path uses upsampling and skip connections to restore fine boundary detail.
After segmentation, I apply a conditional random field. The energy function is:
$$E(x)=\sum_{i}\psi_{u}(x_{i})+\sum_{i<j}\psi_{p}(x_{i},x_{j})$$
The unary term \(\psi_{u}\) encourages each pixel label to agree with the segmentation probability and spectral features. The pairwise term \(\psi_{p}\) penalizes label discontinuities between similar neighboring pixels. This step smooths isolated noise and sharpens the water-land boundary. I then use morphological thinning to convert the water mask into a one-pixel-wide centerline. With ground control points from a global navigation satellite system, I transform the shoreline vector into the required coordinate reference system.
For multi-temporal analysis, I stack UAV drone images from different water levels. I build a relationship between water level and shoreline position. If \(H\) is water level and \(S\) is shoreline displacement, I can approximate the local relationship as:
$$\Delta S=\alpha\Delta H+\beta$$
where \(\alpha\) is the local slope-related coefficient and \(\beta\) is a bias term. I fit this model separately for different shoreline segments because bank slope changes along the reservoir. This gives me a dynamic shoreline model rather than a single static line.
| NDWI value | Interpretation | My action |
|---|---|---|
| Greater than 0.5 | Strong water signal | Accept as water unless segmentation disagrees |
| 0.3 to 0.5 | Likely water or wet boundary | Use U-Net probability and CRF smoothing |
| -0.3 to 0.3 | Mixed or transition zone | Inspect texture and elevation context |
| Less than -0.3 | Land or vegetation | Reject from water mask |
I also account for vegetation overhang, shadows, and floating materials. Vegetation can hide the true shoreline. Shadows can lower reflectance and mimic water. Floating debris can create isolated false water patches. I handle these issues by combining spectral indices with elevation and texture. If a pixel is spectrally water-like but lies above the local water level from a digital elevation model, I mark it for review. If a pixel is land-like but is surrounded by water and has low texture, I test whether it belongs to a small island or a misclassified wet bank. This mixed rule-based and learning-based logic improves the reliability of the UAV drone shoreline product.
4. Hydraulic Structure Defect Recognition
I use Faster R-CNN to detect defects on dams, gates, channels, and other hydraulic structures. The UAV drone captures tilted images from multiple viewpoints. I construct a three-dimensional model from these images, but I also keep the original image tiles for defect detection. The detection network uses a region proposal network to generate candidate boxes. A feature pyramid network merges low-level and high-level features, which is important for small cracks and thin leakage stains. I use ResNet-50 as the backbone because residual connections allow a deeper network without severe degradation.
For each candidate box, the network predicts a class label and refined coordinates. I define the bounding-box parameterization as:
$$t_{x}=\frac{x-x_{a}}{w_{a}},\quad t_{y}=\frac{y-y_{a}}{h_{a}},\quad t_{w}=\log\left(\frac{w}{w_{a}}\right),\quad t_{h}=\log\left(\frac{h}{h_{a}}\right)$$
where \(x,y,w,h\) are predicted box parameters and \(x_{a},y_{a},w_{a},h_{a}\) are anchor parameters. The regression loss is:
$$L_{reg}=\sum_{i\in\{x,y,w,h\}}\text{smooth}_{L_{1}}(t_{i}-t_{i}^{*})$$
where \(t_{i}^{*}\) is the ground-truth parameterization. I use non-maximum suppression with an intersection-over-union threshold to remove redundant boxes. The intersection-over-union is:
$$IoU=\frac{Area(A\cap B)}{Area(A\cup B)}$$
For crack width estimation, I convert pixel measurements to physical units. If \(GSD\) is ground sampling distance in meters per pixel, then:
$$W_{real}=W_{pixel}\times GSD$$
For crack length, I trace the crack skeleton and count connected pixels, then multiply by \(GSD\). For orientation, I compute the principal axis angle:
$$\theta=\frac{1}{2}\arctan\left(\frac{2\mu_{11}}{\mu_{20}-\mu_{02}}\right)$$
where \(\mu_{pq}\) are central image moments of the crack region. This gives me a geometric description that I can compare across inspections.
| Defect type | Visual cue in UAV drone imagery | Detection strategy | Geometric output |
|---|---|---|---|
| Crack | Dark linear feature with directional continuity | ResNet-50 features plus oriented box refinement | Width, length, angle |
| Leakage | Wet stain, color shift, low saturation variation | Color space transform and edge support | Area, boundary, probable source zone |
| Spalling | Irregular exposed aggregate or missing concrete | Canny edges and color contrast | Area, perimeter, depth where available |
| Displacement | Deviation from design plane or alignment | 3D point cloud normal analysis | Translation, tilt angle, direction |
I use color space transformation to separate water stains from normal concrete. The hue channel often highlights leakage because moisture changes the color balance. The saturation channel can strengthen spalling edges. I apply a Canny edge detector with double thresholds. Strong edges are kept, and weak edges are retained only if they connect to strong edges. This forms closed boundaries around spalled regions. For displacement, I analyze the point cloud normal vector. If the angle between the measured normal and the design normal exceeds a threshold, I classify the region as deformed. The angle is:
$$\phi=\arccos\left(\frac{\mathbf{n}_{m}\cdot\mathbf{n}_{d}}{\|\mathbf{n}_{m}\|\|\mathbf{n}_{d}\|}\right)$$
where \(\mathbf{n}_{m}\) is the measured normal and \(\mathbf{n}_{d}\) is the design normal. I set thresholds according to structure type and inspection standards. This gives me a quantitative deformation indicator rather than a purely visual judgment.
5. Reservoir Terrain Reconstruction with UAV Drone and Lidar Fusion
I reconstruct terrain by combining UAV drone image point clouds with lidar point clouds. Image matching uses a semi-global matching algorithm. The algorithm computes pixel disparities along epipolar lines and minimizes a global energy function. A simplified energy form is:
$$E(D)=\sum_{p}C(p,D_{p})+\sum_{q\in N_{p}}P_{1}[|D_{p}-D_{q}|=1]+\sum_{q\in N_{p}}P_{2}[|D_{p}-D_{q}|>1]$$
where \(D\) is the disparity map, \(C\) is the matching cost, and \(P_{1},P_{2}\) control smoothness penalties. Once I have disparity, I convert it to elevation using the triangulation relationship:
$$Z=\frac{fB}{d}$$
where \(Z\) is the ground elevation, \(f\) is the camera focal length, \(B\) is the baseline, and \(d\) is the disparity. The accuracy of \(Z\) depends on the baseline-to-height ratio. A larger baseline improves depth resolution but can increase matching difficulty. I balance this by planning the UAV drone flight with appropriate overlap and altitude.
I register the image point cloud and lidar point cloud with the iterative closest point algorithm. The objective is:
$$E(R,t)=\sum_{i=1}^{N}\|R p_{i}+t-q_{i}\|^{2}$$
where \(p_{i}\) is a point in the image cloud, \(q_{i}\) is the nearest point in the lidar cloud, \(R\) is a rotation matrix, and \(t\) is a translation vector. I iterate until the residual converges. In my case, I controlled the registration residual to within \(0.05\) m. After registration, I use weighted averaging based on elevation residuals to generate a fused terrain point set. The weight for a point can be written as:
$$w_{i}=\frac{1}{\sigma_{i}^{2}+\epsilon}$$
where \(\sigma_{i}^{2}\) is the estimated variance of the point source and \(\epsilon\) is a small stabilizing term. I then build a triangulated irregular network using Delaunay triangulation. I insert constrained edges along ridges, channels, and breaklines so that the terrain model respects important morphological features.
For DEM interpolation, I use Kriging. The Kriging estimator is:
$$\hat{Z}(x_{0})=\sum_{i=1}^{n}\lambda_{i}Z(x_{i})$$
where \(\lambda_{i}\) are weights derived from the semivariogram. The semivariogram is:
$$\gamma(h)=\frac{1}{2N(h)}\sum_{i=1}^{N(h)}[Z(x_{i})-Z(x_{i}+h)]^{2}$$
I fit a semivariogram model and solve for the weights under the unbiasedness constraint \(\sum\lambda_{i}=1\). This produces a smooth but data-respecting elevation surface. I compute slope and aspect from the DEM using a third-order finite difference or a \(3\times3\) window. The slope is:
$$Slope=\arctan\left(\sqrt{f_{x}^{2}+f_{y}^{2}}\right)$$
and the aspect is:
$$Aspect=\arctan_{2}(f_{y},f_{x})$$
where \(f_{x}\) and \(f_{y}\) are partial derivatives of elevation. These derivatives help me identify steep banks, sediment fans, and erosion channels.
| Reconstruction step | Method | Purpose | Quality control |
|---|---|---|---|
| Image matching | Semi-global matching | Generate dense image point cloud | Check disparity consistency |
| Point cloud registration | Iterative closest point | Align image and lidar clouds | Residual below 0.05 m |
| Point cloud fusion | Residual-based weighting | Combine complementary geometry | Remove gross outliers |
| TIN construction | Delaunay triangulation | Represent terrain surface | Insert breaklines |
| DEM interpolation | Kriging | Create regular elevation grid | Cross-validate with checkpoints |
| Slope and aspect | Finite difference | Support terrain analysis | Compare with field observations |
I pay special attention to water-land transition zones. Image matching can fail over clear water because texture is low. Lidar can also have weak returns over water. I therefore mask water areas before dense matching and fill them with bathymetric data where available. For shallow water, I combine UAV drone-derived water depth estimates with multi-beam sounding. I use inverse distance weighting for interpolation:
$$Z(x_{0})=\frac{\sum_{i=1}^{n}w_{i}Z(x_{i})}{\sum_{i=1}^{n}w_{i}},\quad w_{i}=\frac{1}{d_{i}^{2}}$$
where \(d_{i}\) is the distance from the target point to the measured point. For boundary gaps, I use natural neighbor interpolation or Voronoi-based weights. This avoids abrupt unrealistic jumps in the underwater terrain model.
6. Sediment Siltation Monitoring Using Multi-Epoch UAV Drone Data
I monitor sediment siltation by differencing digital elevation models from different epochs. The elevation difference at each grid node is:
$$\Delta h(x,y)=h_{2}(x,y)-h_{1}(x,y)$$
Positive values indicate deposition or siltation. Negative values indicate erosion or scour. I use a threshold to remove noise. In my workflow, elevation changes with absolute value less than \(0.1\) m are treated as unchanged. This threshold depends on the vertical accuracy of the DEM, which I estimate from checkpoints. The vertical RMSE is:
$$RMSE_{Z}=\sqrt{\frac{1}{n}\sum_{i=1}^{n}(Z_{i}-\hat{Z}_{i})^{2}}$$
I estimate siltation volume with a digital volume model. I use a composite Simpson rule over the grid:
$$V=\frac{\Delta x\Delta y}{9}\sum_{i=1}^{m}\sum_{j=1}^{n}\left(h_{i,j}+4h_{i+\frac{1}{2},j}+h_{i+1,j}\right)$$
where \(V\) is the total siltation volume, \(\Delta x\) and \(\Delta y\) are grid spacing, and \(h_{i,j}\) is the siltation thickness at a node. I assign different weights to interior, edge, and corner nodes to improve integration accuracy. I then compute the mean siltation thickness:
$$\bar{h}=\frac{V}{A}$$
where \(A\) is the area of the deposition zone. The annual siltation rate is:
$$R=\frac{V_{2}-V_{1}}{t_{2}-t_{1}}$$
I fit a least-squares trend line to the time series:
$$V(t)=at+b$$
where \(a\) is the annual siltation rate and \(b\) is the baseline volume. The slope \(a\) indicates whether storage loss is accelerating, stable, or decreasing. I extrapolate this trend to forecast future reservoir capacity. The remaining capacity at time \(t\) can be approximated as:
$$C(t)=C_{0}-V(t)$$
where \(C_{0}\) is the initial effective capacity. I report both volume and rate because a single volume value can hide changes in deposition pattern.
| Monitoring quantity | Formula or method | Interpretation | My practical threshold |
|---|---|---|---|
| Elevation change | \(\Delta h=h_{2}-h_{1}\) | Positive is siltation, negative is scour | Noise below 0.1 m ignored |
| Siltation volume | Composite Simpson integration | Total deposited volume | Reported with confidence interval |
| Mean thickness | \(\bar{h}=V/A\) | Average deposition depth | Compare by zones |
| Annual rate | \(R=(V_{2}-V_{1})/(t_{2}-t_{1})\) | Storage loss speed | Track multi-year trend |
| Trend forecast | Least-squares line | Future capacity decline | Update after each survey |
I also separate sediment zones by elevation and flow behavior. Near the main inflow, deposition is often coarse and rapid. In the middle reservoir, fine sediment settles more slowly. Near the dam, the deposition pattern depends on outlet operation and water level. I therefore divide the reservoir into zones and compute volume change for each zone. This gives me a spatially explicit siltation model rather than a single global average. The UAV drone contributes to this model by providing repeated shoreline and shallow-water observations. The UAV drone does not replace multi-beam bathymetry, but it improves the temporal frequency and shoreline consistency of the monitoring program.
7. Case Validation on a Reservoir
I validated the integrated workflow on a reservoir with a controlled basin area of approximately \(3.4\times10^{4}\) km\(^{2}\) and a total storage capacity of \(1.9\times10^{9}\) m\(^{3}\). The annual power generation was about \(5.55\times10^{8}\) kWh. The surrounding terrain was hilly, with elevations ranging from about \(8\) m to \(734\) m. The shoreline was complex, and hydraulic structures were distributed across the reservoir. The monitoring needs included dam crack inspection, reservoir bottom siltation measurement, and illegal occupation detection in the water area. I selected a test area of about \(120\) km\(^{2}\) covering the main dam section, a reservoir bay deposition zone, and a shoreline corridor with unauthorized structures.
I used a multi-rotor UAV drone equipped with a twenty-megapixel visible-light camera and a sixteen-line lidar system. The relative flight height was \(150\) m. The ground sampling distance of the imagery was \(0.03\) m. The point cloud density was above \(800\) points per square meter. The forward overlap was \(80\%\), and the side overlap was \(65\%\). I acquired \(3,872\) valid images and about \(4.8\times10^{8}\) lidar points. For water boundary extraction, I calculated NDWI from multispectral imagery and refined it with U-Net. I used \(1,200\) annotated water-land boundary samples from different water levels. For defect detection, I collected five-view tilted UAV drone images of the main dam concrete face and built a three-dimensional model. I set the detection box threshold to \(0.7\) and the non-maximum suppression parameter to \(0.3\). For terrain reconstruction, I generated an image point cloud with semi-global matching and fused it with the lidar point cloud using iterative closest point registration. The registration residual was kept within \(0.05\) m. For siltation monitoring, I used two epochs, one from 2021 and one from 2024, and computed DEM differences and sediment volumes.
| Case parameter | Value | My setting or note |
|---|---|---|
| Controlled basin area | \(3.4\times10^{4}\) km\(^{2}\) | Large basin with variable inflow |
| Total storage capacity | \(1.9\times10^{9}\) m\(^{3}\) | Major storage and power generation |
| Annual power generation | \(5.55\times10^{8}\) kWh | Operational importance |
| Elevation range | \(8\) m to \(734\) m | Hilly and complex terrain |
| Test area | \(120\) km\(^{2}\) | Dam, bay, and shoreline corridor |
| UAV drone flight height | \(150\) m | Relative altitude |
| Ground sampling distance | \(0.03\) m | Supports large-scale mapping |
| Point cloud density | \(>800\) points/m\(^{2}\) | Lidar plus image cloud |
| Forward overlap | \(80\%\) | Improves matching |
| Side overlap | \(65\%\) | Improves side geometry |
| Valid images | \(3,872\) | After quality control |
| Lidar points | \(4.8\times10^{8}\) | Raw point count |
| Water boundary samples | \(1,200\) | Multiple water levels |
| Detection threshold | \(0.7\) | Defect classification |
| NMS parameter | \(0.3\) | Duplicate removal |
| ICP residual | \(<0.05\) m | Point cloud registration |
I evaluated water boundary accuracy with forty-five checkpoints distributed along the shoreline. The plane error was computed as:
$$m_{xy}=\sqrt{\frac{1}{n}\sum_{i=1}^{n}((x_{i}-\hat{x}_{i})^{2}+(y_{i}-\hat{y}_{i})^{2})}$$
The resulting plane error was \(0.28\) m. The maximum deviation was \(0.52\) m, which occurred in a vegetation-occluded bank segment. The boundary extraction completeness was \(98.3\%\). These results met the requirement for \(1:2000\) topographic mapping. I also inspected the shoreline visually and found that the main errors were concentrated where overhanging vegetation and shadows confused the water index. In those areas, I recommend additional low-altitude UAV drone passes or manual editing.
| Accuracy indicator | Value | Note |
|---|---|---|
| Checkpoints | \(45\) | Distributed along shoreline |
| Plane error | \(0.28\) m | Meets \(1:2000\) mapping |
| Maximum deviation | \(0.52\) m | Vegetation-occluded segment |
| Boundary completeness | \(98.3\%\) | Local occlusion needs manual work |
For hydraulic structure defects, I compared the UAV drone detection results with manual interpretation. The detector found cracks, leakage, spalling, and displacement deformation. The accuracy for cracks was \(93.6\%\), for leakage \(91.2\%\), for spalling \(91.0\%\), and for displacement deformation \(93.3\%\). The miss rates were \(6.3\%\), \(9.3\%\), \(9.0\%\), and \(6.7\%\), respectively. All four defect classes exceeded \(91\%\) accuracy, and all miss rates remained below \(10\%\). I consider this sufficient for routine safety monitoring, especially when combined with targeted close-range verification.
| Defect type | Detected count | Correct count | Accuracy | Miss rate |
|---|---|---|---|---|
| Crack | \(128\) | \(120\) | \(93.6\%\) | \(6.3\%\) |
| Leakage | \(43\) | \(39\) | \(91.2\%\) | \(9.3\%\) |
| Spalling | \(67\) | \(61\) | \(91.0\%\) | \(9.0\%\) |
| Displacement deformation | \(15\) | \(14\) | \(93.3\%\) | \(6.7\%\) |
I also computed precision, recall, and F1 score for each defect class. Precision is:
$$P=\frac{TP}{TP+FP}$$
Recall is:
$$R=\frac{TP}{TP+FN}$$
and F1 is:
$$F1=\frac{2PR}{P+R}$$
These metrics helped me understand whether errors were mainly false positives or false negatives. For cracks, false positives often came from dark joints or wet streaks. For leakage, false positives came from shadowed concrete and stains from other sources. For spalling, false positives came from rough formwork marks. For displacement, false positives came from local surface irregularity. I reduced these errors by adding negative samples and by using multi-view consistency checks.
8. Accuracy, Reliability, and Operational Effects
I summarize the overall reliability of the UAV drone workflow in the following table. The workflow is not a single algorithm. It is a chain of acquisition, preprocessing, learning-based extraction, geometric fusion, and temporal analysis. Each link has quality controls. If one link is weak, the final product suffers. I therefore track quality at each stage.
| Workflow stage | Main quality control | My target | Observed result |
|---|---|---|---|
| UAV drone image acquisition | Overlap, GSD, exposure, GPS/IMU quality | GSD below 0.05 m | 0.03 m achieved |
| Water boundary extraction | NDWI threshold, U-Net, CRF, checkpoints | Plane error below 0.5 m | 0.28 m achieved |
| Defect detection | Multi-view imagery, NMS, manual review | Accuracy above 90% | Above 91% for four classes |
| Terrain reconstruction | SGM, ICP, Kriging, checkpoints | Vertical RMSE below 0.2 m | Within design tolerance |
| Siltation monitoring | DEM differencing, Simpson integration, trend fit | Volume error below 10% | Acceptable for planning |
| Data management | Versioning, metadata, coordinate control | Traceable products | Repeatable updates |
The operational benefit of the UAV drone workflow is substantial. I can mobilize quickly, fly the UAV drone at low altitude, and process the data within a short cycle. The UAV drone reduces the need for personnel to work on steep banks or near water. It also creates a permanent image record. When a defect is found, I can revisit the same location in the image archive and compare it with previous inspections. This changes condition assessment from an event-based activity to a trend-based activity. The UAV drone is therefore not only a mapping tool. It is a monitoring tool.
I also evaluated the effect of data fusion. When I used only image point clouds, the terrain model had gaps in low-texture areas and near water. When I used only lidar point clouds, the model had good geometry but less color and texture context. When I fused both, the model had better breakline continuity and better coverage. The fusion also improved the detection of small terrain features such as erosion rills and deposition bars. For siltation monitoring, the fused DEM reduced noise in the differencing step. This is important because a small vertical bias can create a large false volume when integrated over a large area.
| Data source | Strength | Weakness | My fusion benefit |
|---|---|---|---|
| UAV drone image point cloud | High texture, color, dense matching | Weak over water and low-texture surfaces | Provides visual context and shoreline detail |
| Lidar point cloud | Direct geometry, less texture dependent | Lower color information, water absorption | Improves terrain accuracy and breaklines |
| Fused point cloud | Geometry plus texture | Requires careful registration | Best overall terrain and change detection |
9. Implementation Details and Practical Lessons
I learned several practical lessons from the UAV drone deployment. First, flight planning must match the survey objective. For shoreline extraction, I prefer nadir and slightly oblique UAV drone images. For defect detection, I prefer multiple oblique views. For terrain, I prefer high overlap and stable lighting. Second, ground control and checkpoints are essential. A UAV drone can produce beautiful images, but without coordinate control the products may not be survey-grade. Third, water is difficult for both image matching and lidar. I mask water before terrain matching and fill it with bathymetric data. Fourth, shadows and vegetation are major error sources. I schedule flights near noon or under diffuse light when possible. Fifth, model training needs local samples. A generic defect model may fail on a specific concrete texture. I fine-tune the network with local UAV drone images.
I also use a two-stage quality review. The first stage is automatic. The system flags low-confidence segmentation pixels, small detection boxes, and large elevation differences. The second stage is human review. An operator checks the flagged areas on the UAV drone orthomosaic and the point cloud. This hybrid approach keeps efficiency high while preventing silent errors. I find that the UAV drone workflow is most reliable when automation and human judgment are combined.
| Challenge | Cause | My mitigation |
|---|---|---|
| Water boundary error | Vegetation, shadow, floating debris | NDWI plus U-Net plus CRF, manual review |
| Crack miss | Thin crack, low contrast, motion blur | Higher resolution, oblique views, fine-tuning |
| Leakage false positive | Shadow, stain, wet joint | Color space analysis and negative samples |
| Terrain gap | Low texture, water surface | Lidar fusion and bathymetric interpolation |
| DEM differencing noise | Vertical bias between epochs | Checkpoint-based correction and thresholding |
| Volume integration error | Grid resolution and boundary definition | Composite Simpson rule and zone-based reporting |
10. Mathematical Summary of the Integrated Method
I can summarize the integrated UAV drone method as a sequence of transformations. The raw UAV drone image is radiometrically corrected and geometrically oriented. The water index is computed. The semantic segmentation network produces a water probability. The conditional random field refines the boundary. The shoreline is vectorized and georeferenced. For structures, the detector produces defect boxes. The geometric parameters are computed from pixels and point clouds. For terrain, image matching produces a point cloud. The point cloud is registered with lidar and interpolated to a DEM. For sediment, multi-epoch DEMs are differenced and integrated. Each transformation has an error model. I combine the errors to estimate the final uncertainty. If the final uncertainty is too high, I adjust the flight plan, the model threshold, or the ground control.
The main formulas in my workflow are listed below in a compact form.
$$NDWI=\frac{\rho_{Green}-\rho_{NIR}}{\rho_{Green}+\rho_{NIR}}$$
$$p_{c}(x,y)=\frac{\exp(z_{c}(x,y))}{\sum_{j=1}^{K}\exp(z_{j}(x,y))}$$
$$Z=\frac{fB}{d}$$
$$E(R,t)=\sum_{i=1}^{N}\|R p_{i}+t-q_{i}\|^{2}$$
$$\hat{Z}(x_{0})=\sum_{i=1}^{n}\lambda_{i}Z(x_{i})$$
$$\Delta h(x,y)=h_{2}(x,y)-h_{1}(x,y)$$
$$V=\frac{\Delta x\Delta y}{9}\sum_{i=1}^{m}\sum_{j=1}^{n}\left(h_{i,j}+4h_{i+\frac{1}{2},j}+h_{i+1,j}\right)$$
$$R=\frac{V_{2}-V_{1}}{t_{2}-t_{1}}$$
$$V(t)=at+b$$
$$P=\frac{TP}{TP+FP},\quad R=\frac{TP}{TP+FN},\quad F1=\frac{2PR}{P+R}$$
$$IoU=\frac{Area(A\cap B)}{Area(A\cup B)}$$
$$RMSE_{Z}=\sqrt{\frac{1}{n}\sum_{i=1}^{n}(Z_{i}-\hat{Z}_{i})^{2}}$$
11. Results in Context
I interpret the case results as evidence that a UAV drone workflow can support hydraulic surveying at operational scale. The shoreline plane error of \(0.28\) m is close to the practical limit of image-based mapping under vegetation and water-level variation. The defect accuracy above \(91\%\) is high enough to prioritize inspections, though it does not remove the need for close-up verification of critical cracks. The terrain reconstruction and sediment monitoring results show that the UAV drone can complement bathymetric and ground surveys. The most important improvement is temporal density. A UAV drone can be flown more often than a full bathymetric survey, so it can capture shoreline changes and surface deformation between major surveys.
I do not claim that the UAV drone workflow is universal. Clear water, deep water, and dense vegetation remain difficult. Heavy rain, strong wind, and poor light reduce image quality. Very thin cracks may still be missed. The method works best when the UAV drone data are combined with control points, lidar, and bathymetry. I also need to update the deep learning models when the site conditions change. A model trained on one dam may not transfer perfectly to another dam with different concrete texture and lighting. Fine-tuning with local UAV drone images is necessary.
| Application | UAV drone contribution | Supporting data | My assessment |
|---|---|---|---|
| Shoreline mapping | High-resolution imagery and NDWI/U-Net | GNSS control points | Operational and accurate |
| Dam defect detection | Multi-view visible imagery | 3D model and manual review | Effective for four defect classes |
| Terrain reconstruction | Image point cloud and lidar fusion | Lidar and checkpoints | Improved breaklines and coverage |
| Sediment monitoring | Multi-epoch DEM differencing | Bathymetry and historical DEMs | Useful for trend and volume estimation |
| Compliance monitoring | Repeat shoreline and structure observation | Legal boundary data | Supports detection of unauthorized occupation |
12. Future Improvements
I see several directions for improving the UAV drone method. First, I want to make the deep learning models more robust to seasonal and illumination changes. Domain adaptation and self-supervised pretraining can help. Second, I want to improve underwater terrain estimation by combining UAV drone imagery with more frequent bathymetric sampling. Third, I want to automate the quality review so that the UAV drone system can flag its own uncertain areas. Fourth, I want to integrate edge computing so that initial feature extraction happens onboard or near the field site. This would reduce the delay between UAV drone flight and decision-making. Fifth, I want to build a multi-year digital twin of the reservoir. The digital twin would combine shoreline, structure, terrain, and sediment layers and update them after each UAV drone mission.
I also see value in standardizing the metadata. A UAV drone image is not useful for long-term monitoring unless I record the camera parameters, flight altitude, overlap, weather, water level, and processing version. Metadata makes the result reproducible. Reproducibility is essential for engineering decisions. If a crack is detected in one year and confirmed in the next, I need to know that the two observations are comparable. The UAV drone workflow should therefore be treated as a data management system, not only an image processing system.
| Future direction | Technical action | Expected benefit |
|---|---|---|
| Model generalization | Domain adaptation and local fine-tuning | Better performance across reservoirs |
| Underwater mapping | Fuse UAV drone imagery with multibeam data | Improved shallow-water elevation |
| Automated review | Uncertainty estimation and active learning | Less manual editing |
| Edge processing | Onboard or field-based inference | Faster response |
| Digital twin | Multi-layer time-series database | Long-term reservoir management |
| Standardization | Metadata and processing version control | Reproducible surveys |
13. Conclusion
I have described a UAV drone feature extraction and recognition workflow for hydraulic surveying. The workflow uses a UAV drone to acquire high-resolution imagery and lidar, uses NDWI and U-Net to extract water boundaries, uses Faster R-CNN and ResNet-50 to detect defects, uses semi-global matching and iterative closest point registration to reconstruct terrain, and uses DEM differencing and Simpson integration to monitor sediment. In my reservoir case, the shoreline plane error was \(0.28\) m, defect recognition accuracy exceeded \(91\%\) for four classes, and miss rates remained below \(10\%\). The UAV drone method improved safety, repeatability, and temporal density. It did not eliminate the need for control points, bathymetry, or expert review. Instead, it integrated these elements into a more efficient and more informative surveying system. I conclude that UAV drone feature extraction and recognition can significantly improve hydraulic engineering surveying when the acquisition, modeling, fusion, and validation steps are designed as one coherent workflow.
For practical implementation, I recommend that each UAV drone mission define the target feature, the required accuracy, the flight parameters, the control strategy, and the validation method before takeoff. I also recommend that the processed results be stored with full metadata and version history. A UAV drone can collect data quickly, but reliable surveying comes from disciplined processing and quality control. When those conditions are met, the UAV drone becomes a powerful instrument for water boundary mapping, structural health inspection, terrain reconstruction, and sediment monitoring. It supports both routine surveying and long-term digital management of hydraulic engineering systems.