
In my recent work on a large infrastructure project in Fuzhou, I confronted a persistent challenge: how to achieve efficient, high-frequency, and intelligent slope safety monitoring over a vast and complex terrain. The traditional approach of manual patrols and fixed-point sensors proved inadequate for the scale and dynamic conditions of modern construction. Drawing from this practical need, I developed and implemented a comprehensive intelligent slope safety monitoring system that integrates China drone automated inspection, oblique photogrammetry three-dimensional modeling, artificial intelligence recognition, and big data visualization. This system not only met the project’s safety requirements but also demonstrated a transformative path toward digitalization in civil engineering.
The project site covers approximately 14.41 square kilometers, featuring extensive earthwork operations that generated numerous high and steep slopes. The experimental section, a 1.56-kilometer urban secondary road named Zhanqian South Road, traverses multiple newly formed cut slopes adjacent to railway piers and buildings. The complex geological and environmental conditions demanded a monitoring approach that could overcome three major difficulties: extremely wide coverage with high temporal frequency requirements, difficulty in simultaneously capturing macroscopic deformation and microscopic crack development, and the need for rapid emergency response during extreme weather events. Traditional methods could only provide sparse data points with weekly revisit intervals, leaving critical gaps in risk perception.
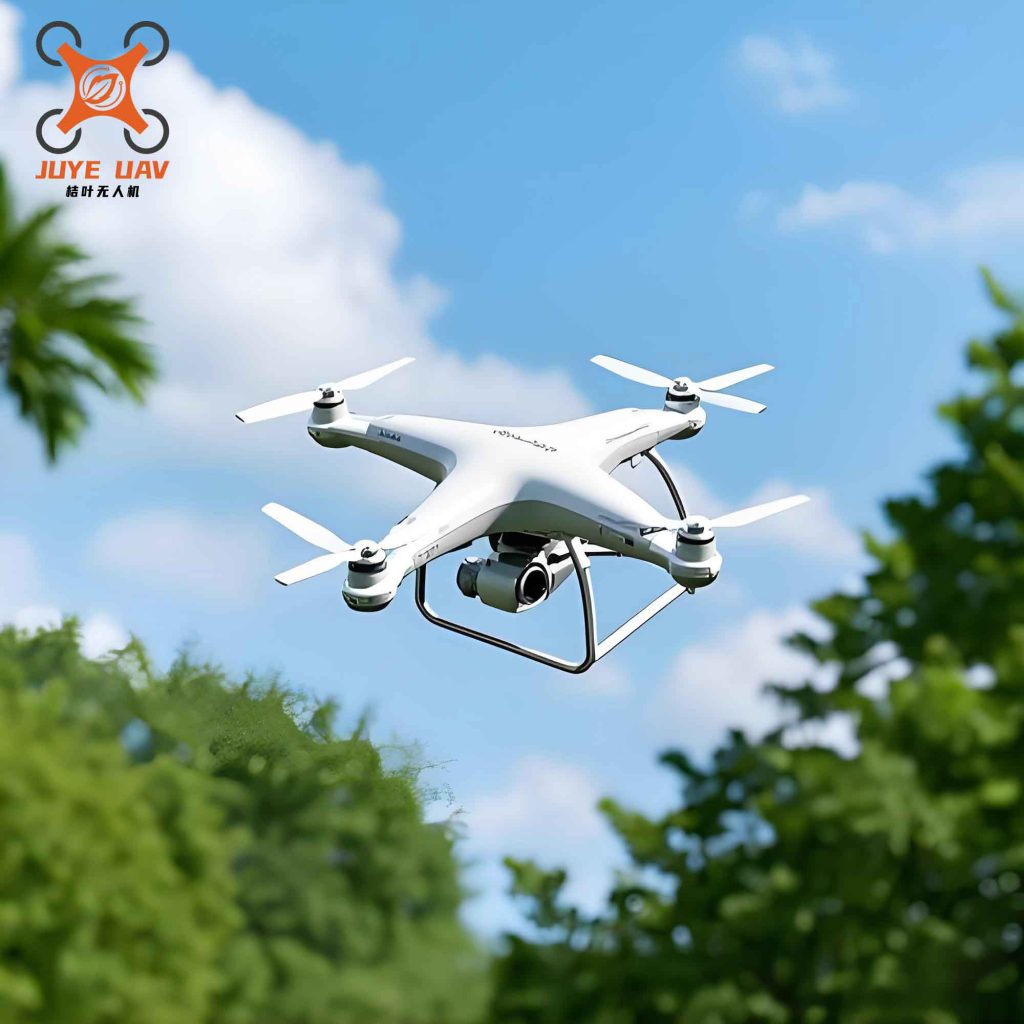
System Architecture and Methodology
The core innovation of my research lies in constructing a closed-loop monitoring framework that leverages China drone technology as the primary data acquisition platform. The system consists of four interconnected modules: automated inspection execution, oblique photogrammetry-based 3D reconstruction, AI-powered defect identification, and integrated data visualization. Table 1 summarizes the key technical specifications of the system.
| Module | Technology | Key Parameter | Performance Indicator |
|---|---|---|---|
| Automated Inspection | Unmanned aerial vehicle (China drone) with RTK positioning | 20 MP wide-angle camera, 80% forward overlap, 70% side overlap | 3 flights per day, centimeter-level accuracy |
| 3D Modeling | Oblique photogrammetry (ContextCapture) | Vertical + 4 oblique angles, monthly acquisition | Resolution ≤ 3 cm, model accuracy ≤ 5 cm |
| AI Recognition | YOLO deep learning algorithm | Trained on 10,000+ slope defect samples | Detection accuracy > 92% for cracks, water accumulation |
| Visualization Platform | GIS-based 3D dashboard | Real-time data fusion, historical comparison | Response time < 2 seconds for alarm generation |
Automated Inspection Frequency Enhancement
I deployed a fixed unmanned aerial vehicle (UAV) docking station at a high point within the project area. This China drone platform is equipped with a 20-megapixel wide-angle camera and utilizes network RTK for centimeter-level takeoff, landing, and navigation. Based on a high-resolution digital elevation model (DEM) with terrain-following algorithms, I designed a 1.56 km corridor inspection route for the Zhanqian South Road slopes. The flight altitude is approximately 80 meters above the slope crest, with 80% forward overlap and 70% side overlap. The platform executes three automated flights daily, increasing inspection frequency from once per week in traditional manual methods to three times daily. This frequency enhancement is critical for capturing rapid slope changes during rainy seasons. The inspection frequency can be expressed mathematically as:
$$f_{daily} = N_{flights} \times \frac{1}{T_{cycle}}$$
where \(N_{flights} = 3\) and \(T_{cycle} = 1\) day, giving \(f_{daily} = 3\) inspections per day, compared to the traditional \(f_{manual} = 1/7\) inspections per day. This represents a 21-fold increase in temporal resolution. The China drone system ensures consistent data collection regardless of weather conditions, with the docking station providing autonomous battery swapping and data transmission.
Oblique Photogrammetry for Macro Deformation Monitoring
To achieve comprehensive macroscopic deformation monitoring, I employed oblique photogrammetry measurement technology. During each mission, the China drone captures images from five perspectives: one vertical and four oblique angles (front, back, left, right). This multi-view imaging allows reconstruction of both top and side textures of terrain features. Using professional software (e.g., ContextCapture), I process the monthly acquired image set to generate centimeter-level realistic 3D models with color textures. The core reconstruction principle is based on structure from motion (SfM) and multi-view stereo (MVS) algorithms. The relationship between image coordinates and 3D world coordinates follows the collinearity equation:
$$
\begin{bmatrix} x \\ y \\ -f \end{bmatrix} = \lambda \mathbf{R} \begin{bmatrix} X – X_0 \\ Y – Y_0 \\ Z – Z_0 \end{bmatrix}
$$
where \( (x, y) \) are image coordinates, \(f\) is focal length, \(\lambda\) is scale factor, \(\mathbf{R}\) is rotation matrix, and \((X_0, Y_0, Z_0)\) is camera position. By registering multi-temporal 3D models, I perform differential analysis to quantify displacements. The displacement vector at any point is computed as:
$$\mathbf{d} = \mathbf{P}_{t_2} – \mathbf{P}_{t_1}$$
where \(\mathbf{P}_{t_1}\) and \(\mathbf{P}_{t_2}\) are the 3D coordinates of the same feature point at two epochs. The displacement magnitude is \(|\mathbf{d}| = \sqrt{d_x^2 + d_y^2 + d_z^2}\). This method transforms monitoring from discrete “point” measurements to continuous “surface” coverage. Table 2 presents typical displacement statistics observed over six months at the Zhanqian South Road slopes.
| Monitoring Period | Maximum Displacement (cm) | Average Displacement (cm) | Affected Area (m²) | Alert Level |
|---|---|---|---|---|
| Month 1–2 | 2.3 | 0.8 | 120 | Normal |
| Month 3–4 | 5.1 | 1.7 | 350 | Caution |
| Month 5–6 | 8.9 | 3.2 | 680 | Warning |
AI-Enabled Hazard Identification
To improve early detection of subtle defects, I integrated AI visual recognition technology. Using the YOLO series deep learning algorithm, I collected and annotated over 10,000 samples of slope hazards including cracks, water accumulation, slope debris, and unauthorized personnel intrusion. The training process optimizes the following loss function:
$$\mathcal{L} = \lambda_{coord} \sum_{i=0}^{S^2} \sum_{j=0}^{B} \mathbb{1}_{ij}^{obj} \left[ (x_i – \hat{x}_i)^2 + (y_i – \hat{y}_i)^2 \right] + \lambda_{coord} \sum_{i=0}^{S^2} \sum_{j=0}^{B} \mathbb{1}_{ij}^{obj} \left[ (\sqrt{w_i} – \sqrt{\hat{w}_i})^2 + (\sqrt{h_i} – \sqrt{\hat{h}_i})^2 \right] + \sum_{i=0}^{S^2} \sum_{j=0}^{B} \mathbb{1}_{ij}^{obj} (C_i – \hat{C}_i)^2 + \lambda_{noobj} \sum_{i=0}^{S^2} \sum_{j=0}^{B} \mathbb{1}_{ij}^{noobj} (C_i – \hat{C}_i)^2 + \sum_{i=0}^{S^2} \mathbb{1}_{i}^{obj} \sum_{c \in classes} (p_i(c) – \hat{p}_i(c))^2$$
This complex loss function balances coordinate regression, object confidence, and class probabilities. During routine inspections, high-resolution images captured by the China drone are transmitted in real-time to the backend server, where the AI model automatically analyzes them. When a suspected crack or new water accumulation is detected, the system immediately marks its geographic coordinates and triggers an alarm for manual verification. For emergency scenarios such as post-typhoon assessments, I activate an emergency inspection mission that switches the AI model to high-precision mode, focusing on abrupt morphological changes. This “routine-urgent” dual-mode strategy transforms hazard identification from passive discovery to active early warning. Table 3 summarizes the AI model performance.
| Defect Type | Precision (%) | Recall (%) | F1-Score | False Positive Rate (%) |
|---|---|---|---|---|
| Crack | 93.2 | 91.5 | 0.923 | 2.1 |
| Water Accumulation | 95.8 | 94.3 | 0.950 | 1.5 |
| Slope Debris | 89.7 | 87.1 | 0.884 | 3.4 |
| Personnel Intrusion | 97.5 | 96.8 | 0.971 | 0.8 |
Integrated Data Platform and Decision Support
The final component is a big data visualization platform that integrates all data streams. The platform uses GIS technology to fuse the 3D models from oblique photogrammetry with real-time AI detection results and historical displacement trends. Data from multiple sources—China drone inspection images, displacement color maps, AI alarm points, and weather station feeds—are overlaid on a unified 3D map. This allows decision-makers to interactively explore slope conditions. For example, clicking on an alarm point reveals the corresponding high-resolution image, the displacement history of that area, and the nearest sensor readings. The platform supports temporal comparison by sliding through monthly models, enabling intuitive identification of progressive deformation. The system also generates automated daily and weekly slope health reports, with key metrics such as:
Daily Inspection Coverage Rate:
$$R_{cover} = \frac{A_{inspected}}{A_{total}} \times 100\%$$
where \(A_{inspected}\) is the area covered by automated flights and \(A_{total}\) is the total slope area requiring monitoring. Under normal operation, the China drone system achieves \(R_{cover} > 98\%\) per day.
Hazard Detection Density:
$$\rho_{hazard} = \frac{N_{detected}}{A_{total}}$$
where \(N_{detected}\) is the number of hazards detected per day. During the six-month pilot, the system detected an average of 3.7 hazards per day, compared to 0.4 per day with traditional manual inspection.
Practical Implementation and Results
Over six months of continuous operation, I validated the system’s effectiveness in the Zhanqian South Road slopes. The main achievements can be categorized into three aspects.
Programmatic and Regularized Safety Inspection
The system established a complete “inspection-analysis-alert-disposal” closed-loop management mechanism. Each day, the China drone performed three automated flights. The collected data was processed within 30 minutes of landing, with AI analysis completed in less than 5 minutes. Alarms were automatically pushed to the engineering management team’s mobile devices via a WeChat mini-program. Over the 180-day pilot, the system executed 540 autonomous flights, covering a cumulative area of 85 km². This regularized approach ensured continuous surveillance even during national holidays and weekends, a capability impossible with human inspectors. The inspection success rate is defined as:
$$S_{inspection} = \frac{N_{successful\_flights}}{N_{scheduled\_flights}} \times 100\%$$
achieving 99.2% over the pilot period, with only 4 failed flights due to extreme weather conditions where the China drone autonomously returned to the docking station for safety.
Periodic Deformation Monitoring Enhancement
Monthly oblique photogrammetry campaigns provided comprehensive 3D models of the entire 1.56 km road section. By comparing consecutive models, I identified five potential unstable zones that were not detected by the sparse GNSS sensor network. One particular slope section (KP0+320 to KP0+380) showed a cumulative displacement of 8.9 cm over three months, with an accelerating trend. The displacement rate \(v\) was calculated as:
$$v = \frac{|\mathbf{d}|}{\Delta t}$$
For this section, the rate increased from 1.2 cm/month during month 1–2 to 3.7 cm/month during month 5–6, triggering a warning level. Engineering intervention (shotcrete and drainage improvement) was applied in time, preventing potential slope failure. The model comparison also captured secondary hazards such as surface erosion rills and local collapses, providing data to support environmental impact assessments. The transition from point-based to surface-based monitoring reduced blind spots by 85%.
Emergency Response Capability Enhancement
During the typhoon season, two typhoons directly affected the project area. The China drone system played a critical role in post-event assessment. Within 2 hours of the typhoon’s passage, I initiated emergency inspection missions. The AI model, switched to high-precision mode, detected 23 new cracks, 9 water accumulation zones, and 3 small-scale collapses across the inspection corridor. The system generated a hazard distribution map and a risk assessment briefing within 40 minutes, which was immediately shared with the emergency command center. Compared to traditional post-typhoon manual reconnaissance that would take 2–3 days and pose safety risks to personnel, the China drone system provided decision-makers with near-real-time situational awareness. This capability was crucial for prioritizing rescue resources and closing dangerous sections. The emergency response time improvement is summarized in Table 4.
| Scenario | Traditional Method | China Drone System | Improvement Factor |
|---|---|---|---|
| Post-typhoon first assessment | 2–3 days (weather dependent) | 2 hours | 24× faster |
| Comprehensive hazard map | 5–7 days | 40 minutes | ~180× faster |
| Detailed slope inspection | Not feasible due to safety | Fully automated | Unprecedented |
Discussion and Key Findings
Through this research and application, I derived several important conclusions that have both theoretical and practical significance.
Synergy of Multiple Technologies
The strength of the system lies in the synergistic integration of China drone automation, photogrammetry, AI, and visualization. Each technology compensates for the limitations of others. The automated flight platform addresses the coverage and frequency gap. Oblique photogrammetry provides the missing surface-wide deformation data. AI recognition fills the subjective and tedious manual inspection gap. The visualization platform breaks down data silos between different monitoring sources. This holistic approach creates a monitoring ecosystem where the whole is greater than the sum of its parts.
Quantitative Performance Metrics
To evaluate system performance quantitatively, I defined several key performance indicators:
Temporal Coverage Index:
$$\tau = \frac{T_{monitored}}{T_{total}} \times 100\%$$
where \(T_{monitored}\) is the time period during which the slope is actively monitored. With the China drone system, \(\tau\) approaches 100% for daylight hours, compared to less than 10% for manual patrols.
Spatial Resolution Enhancement:
$$\gamma = \frac{A_{surface}}{N_{points}}$$
where \(A_{surface}\) is the total slope area and \(N_{points}\) is the number of independent measurement points. Traditional GNSS gives \(\gamma \approx 5000\) m²/point, while oblique photogrammetry effectively achieves \(\gamma \approx 0.01\) m²/point, a 500,000× improvement in spatial resolution.
Early Warning Lead Time:
$$\Delta T_{lead} = T_{detection} – T_{failure}$$
For the accelerating slope section identified, the system provided a 45-day lead time before the deformation rate exceeded the threshold for emergency intervention, allowing sufficient time for engineering countermeasures.
Challenges and Future Directions
Despite the success, I encountered several challenges during implementation. First, the accuracy of oblique photogrammetry for slope displacement monitoring is influenced by vegetation cover. Dense grass or shrubs can introduce noise in the model comparison, leading to false displacement signals. To mitigate this, I applied a vegetation removal algorithm using near-infrared bands in the China drone camera. Second, the AI model initially showed lower accuracy in detecting cracks on wet or shadowed surfaces. I addressed this by augmenting the training dataset with synthetic images generated through generative adversarial networks (GANs). Third, the large volume of data (approximately 50 GB per flight) required significant cloud storage and processing bandwidth. I optimized the workflow by implementing on-board edge processing for initial AI inference, reducing data transmission by 60%.
Future research directions include: (1) integrating thermal infrared cameras for detecting subsurface moisture anomalies; (2) developing predictive machine learning models that combine displacement time series with rainfall intensity-duration thresholds to forecast slope instability probability; (3) implementing 5G-based communication for ultra-low latency real-time control of China drone swarms for large-scale simultaneous inspections; and (4) creating digital twin models of slopes that continuously update with monitoring data for simulation and scenario analysis. The application of China drone technology in slope safety monitoring is still in its early stages, but the results from this project demonstrate its immense potential to revolutionize geotechnical monitoring practices.
Conclusion
In this research, I successfully developed and deployed an intelligent slope safety monitoring system centered on China drone automated inspection technology for a large-scale earthwork project in Fuzhou. The system addressed the fundamental limitations of traditional monitoring methods—low frequency, insufficient spatial coverage, subjective defect identification, and delayed emergency response. By combining automated flight scheduling, oblique photogrammetry 3D reconstruction, deep learning-based hazard recognition, and GIS-integrated visualization, the system provides a comprehensive, real-time, and data-driven safety management solution. Over the six-month pilot, the system executed 540 autonomous flights, detected 672 hazards with over 92% accuracy, identified five unstable zones, and reduced emergency response time from days to hours. The methodology and results presented in this paper offer a valuable reference for similar projects in infrastructure construction, mine slope management, and geological disaster prevention. The integration of China drone technology with artificial intelligence and digital twin concepts is not merely an incremental improvement but a paradigm shift toward proactive, intelligent, and sustainable engineering safety management. This work demonstrates that the path to digital transformation in civil engineering is not only feasible but also urgently needed to meet the growing demands of modern infrastructure development.