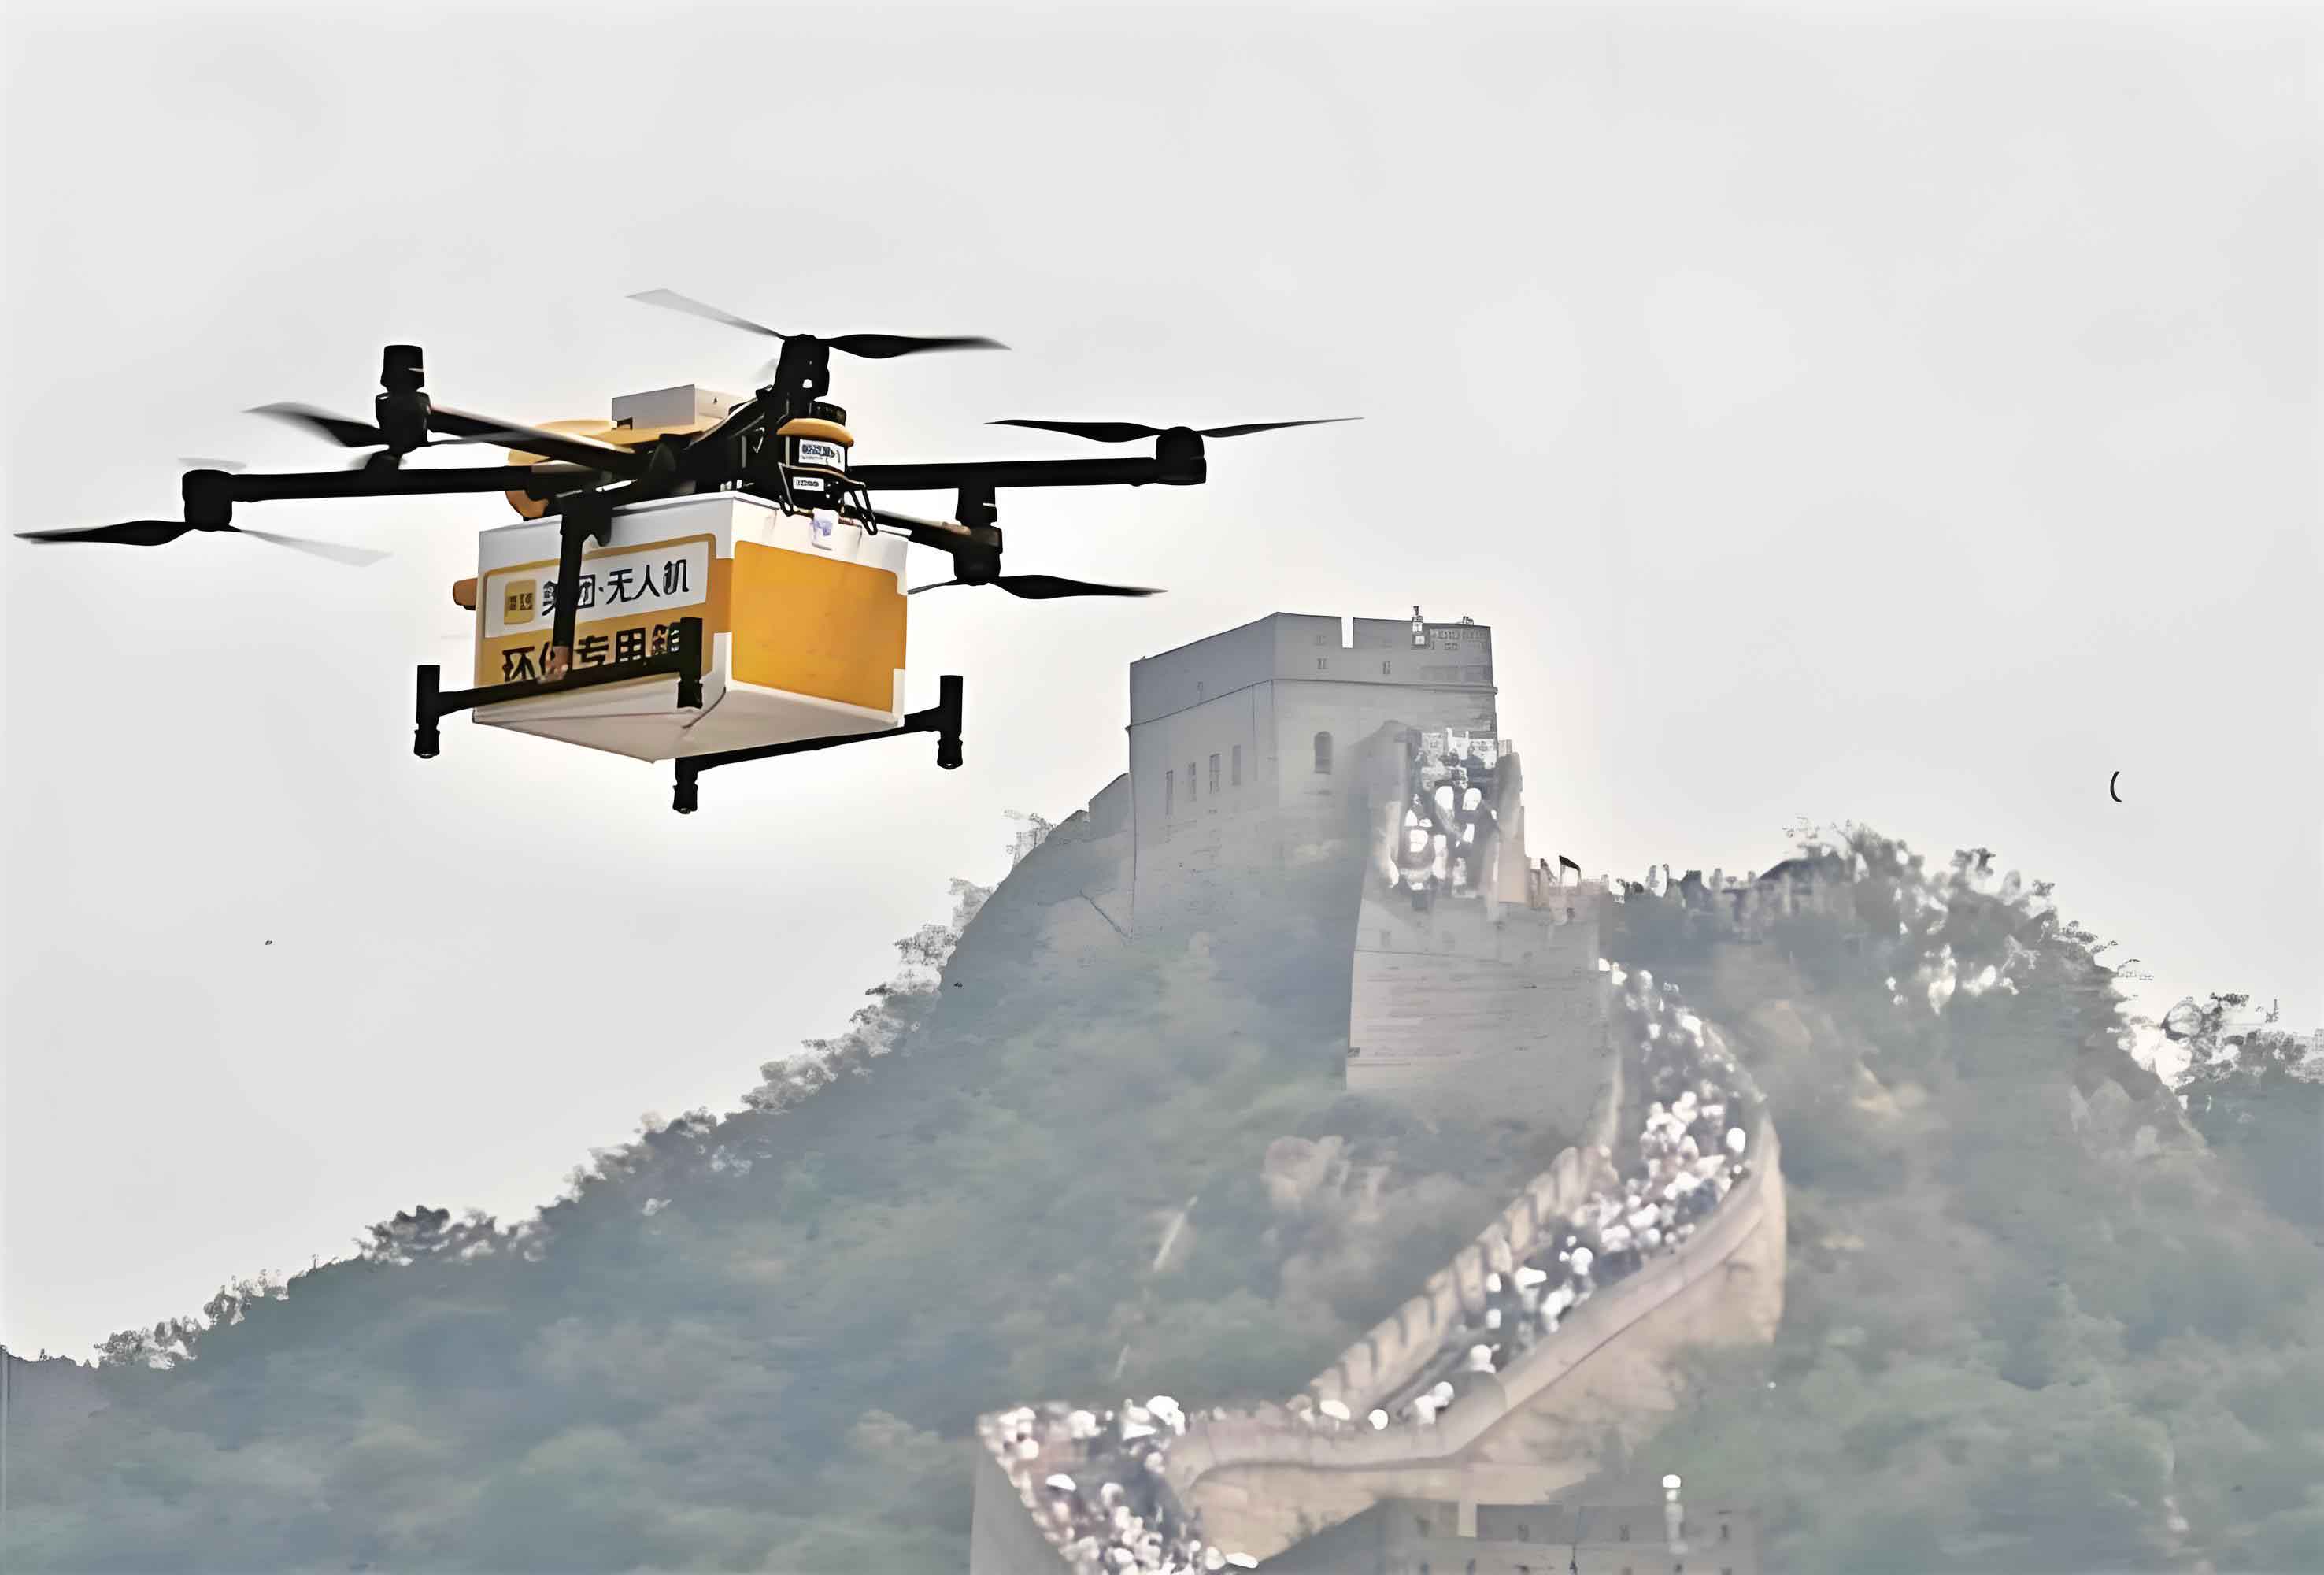
The rapid expansion of delivery drone operations necessitates efficient takeoff management strategies that maintain safety standards. This research addresses the critical challenge of determining safe takeoff intervals for delivery UAVs by analyzing speed error propagation across three operational scenarios: same-route, cross-route, and route-network configurations. We establish collision risk assessment models incorporating climb phase dynamics and cruise phase uncertainties, validated through Monte Carlo simulations against the Equivalent Level of Safety (ELOS) target of $10^{-7}$ maximum collision probability.

Delivery UAV operations exhibit distinct kinematic uncertainties during critical flight phases. The climb phase velocity $v_{\text{climb}}$ follows a normal distribution $v_{\text{climb}} \sim \mathcal{N}(\mu_{\text{climb}}, \sigma_{\text{climb}}^2)$, while cruise velocity $v_{\text{cruise}}$ adheres to $v_{\text{cruise}} \sim \mathcal{N}(\mu_{\text{cruise}}, \sigma_{\text{cruise}}^2)$. Velocity transitions between measurement intervals $\tau$ are constrained by maximum acceleration $a_{\text{max}}$:
$$v_{\text{cruise}_{m+1}} – v_{\text{cruise}_m} \leq \tau \cdot a_{\text{max}}$$
The collision template radius $R$ for delivery drones combines fuselage dimensions and rotor span:
$$R = \sqrt{\frac{l_{\text{drone}}^2}{4} + \frac{h_{\text{drone}}^2}{4}}$$
Same-route collision analysis examines overtaking risk during climb and cruise phases. The climb phase collision condition $C_{\text{climb}}$ depends on takeoff interval $T$ and climb time differential $t_{\text{climb\_diff}}$:
$$t_{\text{climb\_diff}} = \frac{H}{v_{\text{climb}_1}} – \frac{H – (R_1 + R_2)}{v_{\text{climb}_2}}$$
$$C_{\text{climb}} = \begin{cases}
0 & \text{if } T > t_{\text{climb\_diff}} \\
1 & \text{otherwise}
\end{cases}$$
Cruise phase collision assessment requires position tracking through acceleration and constant velocity segments. The separation distance $\Delta d$ must satisfy:
$$\Delta d > R_1 + R_2$$
Cross-route collision analysis focuses on intersection conflicts. The critical parameter $s_1$ represents half the collision template projection:
$$s_1 = \sqrt{(R_1 + R_2)^2 – \left( \frac{D_1 – d_1}{2} \right)^2}$$
The collision condition $C_{\text{cruise}}$ becomes:
$$C_{\text{cruise}} = \begin{cases}
0 & \text{if } s_1 < D_2 – d_2 \\
1 & \text{otherwise}
\end{cases}$$
Table 1 details the delivery UAV parameters and operational environment used in our simulations:
| Parameter | Value | Parameter | Value |
|---|---|---|---|
| $h_{\text{drone}}$ (m) | 0.56 | $L$ (m) | 8,000 |
| $l_{\text{drone}}$ (m) | 0.93 | $v_{\text{target}}$ (m/s) | 14 |
| $a_{\text{cruise\_a}}$ (m/s²) | 0.56 | $\mu_{\text{climb}}$ | 1.2358 |
| $a_{\text{max}}$ (m/s²) | 0.42 | $\sigma_{\text{climb}}^2$ | 0.02 |
| $\tau$ (s) | 1 | $\mu_{\text{cruise}}$ | 13.9817 |
| $H$ (m) | 80 | $\sigma_{\text{cruise}}^2$ | 0.001 |
Monte Carlo simulation results for same-route operations demonstrate the relationship between takeoff interval and collision probability (Figure 1). The safety threshold occurs at 122s for $10^{-7}$ collision probability:
$$P_{\text{collision}} = 1.07 \times 10^{-7} \quad \text{at} \quad T = 122 \text{s}$$
Cross-route analysis reveals a linear relationship between takeoff interval $T$ and distance differential $D = |D_1 – D_2|$ at constant collision probability levels. The ELOS-compliant surface follows (Figure 2):
$$T = \frac{D \pm 1199.97}{14} \quad (T \geq 0)$$
Route-network implementation for a grid system (Figure 3) yields optimized takeoff intervals:
| Takeoff Point Pair | Safe Interval (s) |
|---|---|
| 1→2 | 158 |
| 2→3 | 86 |
| 3→4 | 0 |
| 4→1 | 0 |
These intervals maintain system capacity of approximately 10 delivery drones with hourly throughput of 16 operations per origin point. The methodology enables delivery UAV operators to implement efficient takeoff management while meeting stringent safety requirements. Future work will incorporate landing phase dynamics and heterogeneous delivery drone fleets to enhance practical applicability.
