
In the modern railway infrastructure, steel bridges serve as critical components that enable the seamless crossing of natural obstacles and the interconnection of rail networks. However, prolonged exposure to environmental factors such as rain, snow, and temperature fluctuations gradually deteriorates the protective coating on steel bridge surfaces. This deterioration manifests in the form of blistering, peeling, and rusting defects. These coating defects not only compromise the aesthetic appearance of the bridge but also threaten the structural integrity of the steel members, thereby posing potential risks to operational safety. Timely and accurate detection and evaluation of these coating defects are therefore essential for monitoring the health condition of railway steel bridges and ensuring safe railway operations.
Traditional inspection methods rely on manual visual checks using bridge inspection vehicles or telescopes, which are typically conducted at night during maintenance windows. These approaches suffer from significant limitations, including restricted access to certain structural areas, low efficiency, high labor intensity, and subjective judgment errors. With the rapid advancement of low-altitude economy, drone technology has emerged as a transformative tool for railway infrastructure inspection. Unmanned aerial vehicles (UAVs) offer remarkable advantages such as high-altitude coverage, long-range capability, minimal impact from terrain and maintenance schedules, and enhanced operator safety. By employing drone technology, it becomes feasible to acquire comprehensive panoramic and detailed images of large-span steel bridges, thus improving the overall inspection efficiency.
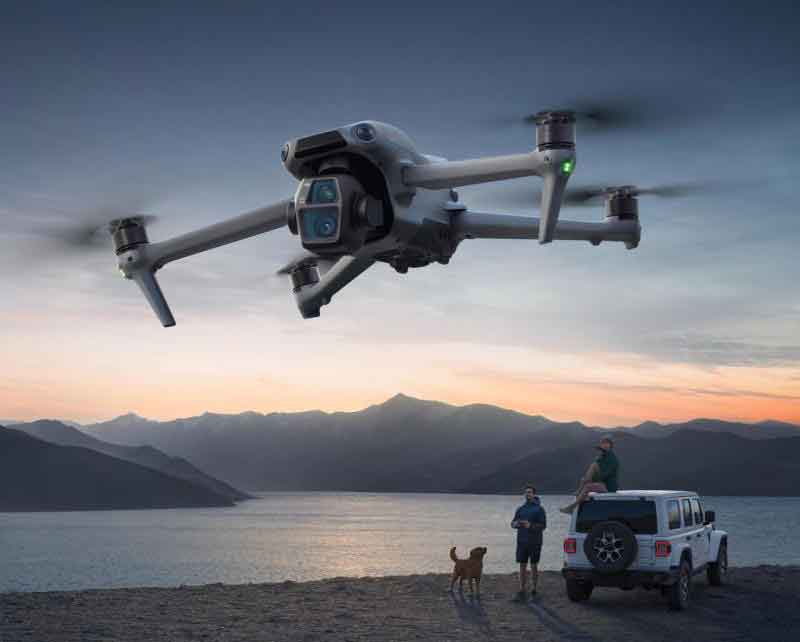
Despite the benefits of UAV-based image acquisition, manual visual examination of large volumes of drone-captured images remains problematic due to high subjectivity, laborious efforts, and inconsistencies arising from varying environmental conditions and image quality. Consequently, there is an urgent need for an automated, high-precision detection and evaluation system for railway steel bridge coating defects. Such a system would leverage drone technology combined with computer vision and deep learning to achieve efficient and objective defect analysis.
In this paper, we propose a comprehensive detection and evaluation system that addresses several key challenges encountered in coating defect analysis using drone technology. These challenges include: (1) small target scale – coating defects in UAV images often occupy only a few thousand pixels against a background of tens of millions of pixels, resulting in extremely low effective pixel ratios and limited semantic information; (2) complex background interference and discrete distribution – non-coating areas such as rivers, tracks, and ancillary facilities introduce confounding features, while defects like peeling often appear as multiple discrete instances with varying scales; (3) indistinct and irregular defect edges – blistering and peeling exhibit subtle color or gloss changes that blend smoothly with intact coating, and rusting may present diffuse or irregularly extended patches with fuzzy boundaries.
To tackle these issues, we construct an end-to-end framework consisting of three main stages. First, we perform coating foreground extraction and image tiling preprocessing to suppress background interference and increase the relative pixel proportion of defects. Second, we develop an Accurate Refinement Segmentation Network (ARSNet) that incorporates a Feature-edge and Scale-aware Attention Mechanism (FESAM) to precisely segment irregular defect edges and handle multi-scale targets. Third, we propose a discrete defect aggregation post-processing algorithm to merge nearby discrete instances of the same class and to consolidate the same defect across adjacent sub-images, followed by a quantitative evaluation of defect deterioration grades based on the area proportion.
The remainder of this paper is organized as follows. Section 2 describes the proposed system in detail, including preprocessing, ARSNet architecture, FESAM mechanism, loss functions, discrete aggregation, and grade evaluation. Section 3 presents experimental setup, evaluation metrics, ablation studies, model comparisons, and visualization analyses. Section 4 concludes the paper and discusses future work.
Proposed Detection and Evaluation System
Image Preprocessing
In UAV-captured images of railway steel bridges, non-coating background regions often cause confusion in defect feature extraction. Moreover, the defect regions typically occupy a very small pixel proportion, exhibiting distinct small-target characteristics that make the model susceptible to background interference during both training and inference, leading to missed or false detections. To address this, we first extract the coating foreground region from the original image. A semi-automatic annotation method is employed to build the sample set: a small number of coating images are manually annotated, then various data augmentation techniques are used to expand the sample set for training. Subsequently, an automatic annotation algorithm is applied to extract the region of interest – the coating foreground area. Furthermore, to enhance the model’s ability to detect small-scale defects, we introduce an image tiling preprocessing strategy that uses a fixed-size window to crop the image into non-overlapping sub-images. This operation increases the relative pixel proportion of the defect region within each sub-image, thereby improving the recognizability of defect features.
ARSNet Architecture
The ARSNet is a novel instance segmentation network derived from the YOLO family, offering both high inference speed and superior detection accuracy. The overall structure consists of four parts: Input, Backbone, FESAM-Neck, and Detection-Segmentation Head. In the Backbone, we employ a composite structure comprising C3K2, SPPF, and C2PSA modules. The C3K2 module is an improved feature extraction block that integrates lightweight convolution and residual connections to enhance multi-scale perception. The SPPF module uses multi-scale pooling to model spatial information at different scales. The C2PSA module introduces self-attention to improve the network’s focus on target regions and contextual understanding. These components collectively extract deep semantic features while balancing computational efficiency and accuracy. In the FESAM-Neck part, C3K2 modules and feature pyramid networks are integrated to enhance shallow features via bottom-up paths and fuse deep semantic information via top-down paths, forming rich hierarchical feature representations. The FESAM attention mechanism is further embedded here. The Head adopts a parallel design for bounding box detection and pixel-level segmentation. The detection head uses depthwise separable convolutions and fully connected layers to predict object categories and bounding boxes, while the segmentation head generates segmentation masks through a series of convolution operations and pixel-wise classification layers.
FESAM Attention Mechanism
Attention mechanisms are critical for information filtering and feature enhancement in deep learning-based object detection and segmentation. Traditional channel-only or spatial-only attention mechanisms ignore the interaction between channel and spatial dimensions, which can limit the extraction of complex multi-scale and multi-structural defect features. Therefore, we design a Feature-edge and Scale-aware Attention Mechanism (FESAM) that jointly models channel and spatial dimensions. The FESAM module consists of a channel attention branch and a spatial attention branch.
Channel Attention: We employ global average pooling followed by a one-dimensional convolution to achieve channel-wise feature compression. The one-dimensional convolution maintains continuity between channels while significantly reducing parameter count and computational complexity. The channel attention computation is defined as:
$$
F_2 = \sigma\left( \text{Conv}_{1\times1}\left( \frac{1}{H \times W} \sum_{i=1}^{H} \sum_{j=1}^{W} F_1 \right) \otimes F_1 \right)
$$
where \(F_1 \in \mathbb{R}^{C \times H \times W}\) is the input feature map, \(C\) is the number of channels, \(H\) and \(W\) are height and width, \(\text{Conv}_{1\times1}\) denotes 1D convolution, \(\sigma\) is the Sigmoid function, and \(\otimes\) denotes element-wise multiplication of the attention weights with the input features.
Spatial Attention: Taking the channel attention output \(F_2\) as input, we first perform global average pooling and max pooling along the channel dimension to capture statistical information and salient responses, then concatenate them to form a spatial descriptor \(\tilde{F}_2 \in \mathbb{R}^{2 \times H \times W}\) :
$$
\tilde{F}_2 = \text{Concat}\left( \frac{1}{C} \sum_{k=1}^{C} F_2 , \max_{k=1:C}(F_2) \right)
$$
To enhance multi-scale feature extraction, we employ multiple parallel convolution kernels with different dilation rates to obtain feature representations from different receptive fields. Channel shuffle operation is introduced to promote cross-channel feature interaction and improve feature diversity. The multi-scale feature maps \(\hat{F}_n\) are computed as:
$$
\begin{cases}
\hat{F}_n = \text{Conv}(\hat{F}_{n-1}), & n \geq 2 \\
\hat{F}_1 = \text{Conv}(\tilde{F}_2)
\end{cases}
$$
Then, a 1×1 convolution fuses the concatenated multi-scale features, reducing the channel dimension from \(2n\) to 1, followed by a Sigmoid function to generate the spatial attention weight map. Finally, the attention map is multiplied element-wise with the input feature, and a residual connection is introduced to preserve original information and prevent over-suppression. The output of the spatial attention branch is:
$$
F_3 = F_2 + \sigma\left( \text{Conv}^{1\times1}_{2n \rightarrow 1} \left( \text{Concat}(\hat{F}_1, \hat{F}_2, \ldots, \hat{F}_n) \right) \right) \odot F_2
$$
By embedding FESAM into ARSNet, the model gains enhanced edge perception and scale expression capabilities at all feature pyramid levels, thereby improving recognition and segmentation performance for multi-scale defect targets.
Loss Function
The total loss of ARSNet comprises classification loss, regression loss, and mask loss. The regression loss includes Complete Intersection over Union (CIoU) loss and Distribution Focal Loss (DFL). These components are weighted and summed to obtain the total loss.
Classification Loss: We use binary cross-entropy (BCE) loss:
$$
L_{\text{cls}} = -w_n \left[ y_n \log(\sigma(x_n)) + (1-y_n) \log(1-\sigma(x_n)) \right]
$$
where \(y_n\) and \(x_n\) are the ground truth and predicted values for the n-th sample, and \(w_n\) is the sample weight.
CIoU Loss: This loss measures overlap and aspect ratio consistency between predicted and ground-truth bounding boxes:
$$
L_{\text{CIoU}} = 1 – \left( \text{IoU} – \frac{\rho^2(b, b^{\text{gt}})}{c^2} – \frac{v^2}{(1-\text{IoU}) + v} \right)
$$
where \(\rho\) is the Euclidean distance between centers, \(c\) is the diagonal length of the smallest enclosing box, and \(v\) is a parameter measuring aspect ratio consistency.
DFL Loss: This loss models the bounding box as a generalized distribution to improve regression precision:
$$
\text{DFL}(S_i, S_{i+1}) = -[(y_{i+1} – y) \log(S_i) + (y – y_i) \log(S_{i+1})]
$$
Mask Loss: Pixel-wise binary cross-entropy between predicted mask \(M\) and ground-truth mask \(M_{\text{gt}}\):
$$
L_{\text{mask}} = \text{BCE}(M, M_{\text{gt}})
$$
Discrete Defect Aggregation and Evaluation
In railway steel bridge coating images, some defect instances are spatially close and belong to the same continuous defective region, yet the model tends to recognize them as multiple isolated small targets due to their discrete morphology. Additionally, image tiling may split a large defect across adjacent sub-images, resulting in fragmented detection. To address these issues, we design a discrete defect aggregation post-processing algorithm. The algorithm works in three steps:
Step 1: Within each sub-image, for detection results of the same class that are spatially close, we compute the Intersection over Union (IoU) between any two bounding boxes. If the IoU exceeds a small threshold (e.g., 0.01), they are considered duplicate detections of the same defect area. The merging is performed iteratively, replacing the original boxes with the merged one until no more pairs are found. This strategy effectively aggregates small discrete instances into a larger bounding box without using complex clustering algorithms.
Step 2: Map the sub-image coordinates back to the original full image coordinates. Since the tiling uses non-overlapping windows, each sub-image has a known index \((i, j)\) in the full image. The global coordinates \((x, y)\) are obtained from local coordinates \((\tilde{x}, \tilde{y})\) as:
$$
x = \tilde{x} + i \cdot w, \quad y = \tilde{y} + j \cdot h
$$
where \(w\) and \(h\) are the sub-image width and height, respectively.
Step 3: Aggregate the same defect instance that has been split across adjacent sub-images. We perform pairwise comparisons only for detections near the tile boundaries, to reduce computation. A pair is considered aggregatable if the distance between their bounding box edges is within a pixel threshold \(T_p\) (e.g., 5 pixels). Two conditions are checked: horizontal aggregation and vertical aggregation. Horizontal aggregation condition:
$$
(|x_1 – x_3| \leq T_p \lor |x_2 – x_4| \leq T_p) \land (|y_2 – y_3| \leq T_p)
$$
Vertical aggregation condition:
$$
(|y_1 – y_3| \leq T_p \lor |y_2 – y_4| \leq T_p) \land (|x_2 – x_3| \leq T_p)
$$
Additionally, a Euclidean distance between the bounding box centers is used as a fallback condition to handle extreme cases. The merged bounding box is the minimum enclosing rectangle of the two original boxes, and the corresponding masks are also merged.
Defect Grade Evaluation: According to the “Railway Bridge and Tunnel Building Deterioration Assessment” standard and combined with practical considerations, coating defects are classified into four grades based on the proportion of defect area in the coating area. The area proportion for defect category \(i\) is defined as:
$$
P_i = \frac{M_i}{N_{\text{coating}}} \times 100\%
$$
where \(M_i\) is the number of mask pixels of category \(i\), and \(N_{\text{coating}}\) is the total number of coating mask pixels. The grade thresholds are listed in Table 1.
| Grade | Rust | Blistering/Peeling |
|---|---|---|
| Slight | 0.3 | 0.3 |
| Moderate | 3.0 | 5.0 |
| Severe-Moderate | 5.0 | 16.0 |
| Severe | – | 33.0 |
The final evaluation output per image is linked to the actual field location (e.g., pier number, track side, truss number) to facilitate traceability for maintenance personnel.
Experimental Results and Discussion
Dataset and Implementation Details
We collected UAV images of the steel bridge coating on the Jinan Yellow River Bridge of the Beijing-Shanghai High-Speed Railway. The dataset includes coating samples from the top and side surfaces, with defect types categorized as blistering, peeling, and rust. Image annotation was performed using LabelMe with a semi-automatic pipeline. After coating foreground extraction and tiling preprocessing, we obtained 526 image patches (sub-images). The dataset was randomly split into 418 training patches and 108 testing patches, containing 110 blister instances, 615 peeling instances, and 1,434 rust instances. All experiments were conducted on a Linux system with an NVIDIA GeForce RTX 3080 GPU. Input images were resized to 640×640 pixels. The model was implemented in PyTorch. Training hyperparameters were: learning rate 0.01, weight decay 0.0005, momentum 0.937, batch size 16, and total epochs 500. Loss weights: classification 0.5, CIoU 7.5, DFL 1.5, mask 0.5.
Evaluation Metrics
We used Precision, Recall, mean Average Precision (mAP50), Giga Floating-point Operations per Second (GFLOPs), and Frames per Second (FPS) as evaluation metrics. Definitions:
$$
\text{Precision} = \frac{TP}{TP+FP} \times 100\%, \quad \text{Recall} = \frac{TP}{TP+FN} \times 100\%
$$
$$
\text{mAP50} = \frac{1}{n_{\text{class}}} \int P(\text{Recall}) d(\text{Recall})
$$
$$
\text{FPS} = \frac{1000}{t_{\text{pre}} + t_{\text{inference}} + t_{\text{NMS}}}
$$
Ablation Study on FESAM
To validate the effectiveness of the FESAM mechanism, we conducted ablation experiments using the YOLOv11-seg model as the baseline. We introduced various mainstream attention mechanisms: GAM, MSCA, CBAM, PPA, MHRSA, as well as channel-only (C) and spatial-only (S) attention modules, and compared with the proposed FESAM. Results are summarized in Table 2.
| Model | Det Precision (%) | Det Recall (%) | Det mAP50 (%) | Seg Precision (%) | Seg Recall (%) | Seg mAP50 (%) | GFLOPs | FPS |
|---|---|---|---|---|---|---|---|---|
| Baseline | 85.3 | 83.0 | 87.6 | 86.1 | 83.4 | 88.2 | 35.3 | 128 |
| +GAM | 89.9 | 85.9 | 90.1 | 90.2 | 85.3 | 89.9 | 39.5 | 92 |
| +MSCA | 89.3 | 85.9 | 90.5 | 86.8 | 83.9 | 89.0 | 36.0 | 115 |
| +CBAM | 88.1 | 83.9 | 89.6 | 87.9 | 83.7 | 89.1 | 35.5 | 125 |
| +PPA | 90.4 | 82.5 | 89.6 | 90.4 | 82.3 | 89.8 | 54.3 | 93 |
| +MHRSA | 85.3 | 85.9 | 89.9 | 85.3 | 86.0 | 89.7 | 37.8 | 119 |
| +Channel | 86.1 | 86.1 | 89.6 | 87.1 | 85.5 | 89.9 | 35.1 | 129 |
| +Spatial | 91.2 | 82.3 | 90.1 | 91.1 | 82.3 | 89.9 | 35.3 | 120 |
| +FESAM | 92.2 | 86.1 | 90.7 | 91.7 | 85.6 | 90.3 | 35.3 | 121 |
From Table 2, FESAM achieves the best detection and segmentation performance, with detection precision 92.2%, recall 86.1%, mAP50 90.7%; segmentation precision 91.7%, recall 85.6%, mAP50 90.3%. It maintains a competitive computational cost (GFLOPs 35.3) and inference speed (FPS 121). GAM improves performance but increases GFLOPs to 39.5 and reduces FPS to 92. MSCA yields second-best detection mAP50 (90.5%) but lower detection recall (85.9%) and segmentation precision (86.8%). CBAM is lightweight but provides limited improvement due to lack of joint channel-spatial modeling. PPA enhances local features but suffers from high complexity (GFLOPs 54.3) and lower recall. MHRSA achieves high segmentation recall (86.0%) but lower precision. These results confirm the superiority of FESAM in balancing accuracy and efficiency.
Comparison with State-of-the-Art Models
We compared ARSNet with recent YOLO-based models: YOLOv8-seg, YOLOv9-seg, YOLOv10-seg, YOLOv11-seg, and YOLOv12-seg. All models were trained and tested on the same dataset. Results are shown in Table 3.
| Model | Det Precision (%) | Det Recall (%) | Det mAP50 (%) | Seg Precision (%) | Seg Recall (%) | Seg mAP50 (%) | FPS |
|---|---|---|---|---|---|---|---|
| YOLOv8-seg | 88.3 | 81.7 | 87.9 | 88.0 | 82.5 | 88.7 | 122 |
| YOLOv9-seg | 84.3 | 82.3 | 87.7 | 84.3 | 82.3 | 88.1 | 105 |
| YOLOv10-seg | 88.7 | 77.9 | 88.2 | 88.3 | 78.9 | 88.4 | 127 |
| YOLOv11-seg | 85.3 | 83.0 | 87.6 | 86.1 | 83.4 | 88.2 | 128 |
| YOLOv12-seg | 90.6 | 72.5 | 85.9 | 90.5 | 72.6 | 86.0 | 101 |
| ARSNet (Ours) | 92.2 | 86.1 | 90.7 | 91.7 | 85.6 | 90.3 | 121 |
ARSNet outperforms all compared YOLO models in both detection and segmentation metrics. Detection mAP50 reaches 90.7%, which is 2.5% higher than the second-best YOLOv10-seg (88.2%). Segmentation mAP50 is 90.3%, surpassing YOLOv8-seg by 1.6%. In terms of recall, ARSNet achieves 86.1% for detection and 85.6% for segmentation, significantly higher than other models (the closest YOLOv11-seg has 83.0% detection recall). Although YOLOv10-seg and YOLOv11-seg achieve higher FPS (127 and 128, respectively), ARSNet still maintains a competitive 121 FPS, which is acceptable for practical real-time applications. YOLOv12-seg has higher precision but lower recall (72.5% detection, 72.6% segmentation), indicating a tendency to miss many true defects. Qualitative visualizations further confirm that ARSNet produces fewer false positives and false negatives, with more accurate segmentation masks.
Visual Analysis of System Intermediate Results
To demonstrate the progressive improvements brought by each module, we performed intermediate visualization experiments. The results illustrate that: (a) Direct application of the baseline model on raw images suffers from many false detections due to complex non-coating backgrounds. (b) After coating foreground extraction, false detections are reduced but small defects are still frequently missed. (c) Introducing image tiling increases the detection of small targets, but multiple discrete detections for the same defective region produce redundant bounding boxes. (d) The full system with ARSNet, FESAM, and discrete aggregation yields accurate, non-redundant segmentation masks, effectively handling small-scale, discrete, and irregular defects. This confirms the effectiveness of our proposed pipeline.
Defect Grade Evaluation Examples
We applied the grade evaluation to several typical images. For instance, a rust defect covering 4.2% of the coating area was classified as “Moderate” according to Table 1. A blistering defect with 0.2% area was “Slight”. A peeling defect with 8.5% area was “Severe-Moderate”. These evaluations provide quantitative guidance for maintenance decisions: slight and moderate defects may be monitored, while severe-moderate and severe defects require immediate repair. The area proportion metric is robust to perspective variations because both defect and coating regions experience similar projective distortions.
Conclusion
In this paper, we presented a comprehensive system for detecting and evaluating coating defects on railway steel bridges using drone technology. The system effectively addresses the challenges of small target scale, discrete distribution, irregular edges, and complex background interference through coating foreground extraction, image tiling, a novel ARSNet model with FESAM attention mechanism, and a discrete defect aggregation algorithm. Extensive experiments on a real-world UAV dataset demonstrate that our method achieves state-of-the-art detection and segmentation accuracy (detection mAP50 90.7%, segmentation mAP50 90.3%) while maintaining high inference speed (121 FPS). The defect grade evaluation based on area proportion provides actionable information for maintenance personnel. Future work will focus on expanding the dataset to include more bridge types, multiple viewing angles, and varying lighting conditions, as well as exploring cross-scene generalization strategies to further enhance the robustness and applicability of drone technology in railway bridge inspection.