As a dedicated radio spectrum management professional, I have been at the forefront of ensuring the seamless execution of large-scale drone light shows. These breathtaking aerial displays, where hundreds or thousands of unmanned aerial vehicles (UAVs) dance in synchronized harmony, represent a fusion of art and technology that captivates audiences worldwide. My journey in safeguarding these events has taught me that the invisible realm of radio frequencies is as critical as the visible spectacle. In this account, I share the intricate processes, technical frameworks, and personal experiences that underpin our mission to eliminate interference and guarantee safety. The drone light show is not merely a performance; it is a complex ecosystem reliant on pristine electromagnetic conditions. Through meticulous planning, advanced monitoring, and rapid response, we strive to make every drone light show a flawless experience.
The foundation of any successful drone light show lies in comprehensive pre-event preparation. For instance, prior to a major national celebration featuring a drone light show, our team engages in extensive coordination with organizers. We establish a joint mechanism to exchange critical data, including performance area coordinates, drone count, and communication frequency bands. A site survey is conducted to map the terrain and identify potential sources of interference. Pre-monitoring of the electromagnetic environment within a radius of several kilometers is performed to establish a baseline database. This phase is crucial for risk assessment and mitigation. The table below summarizes key preparatory activities for a typical drone light show.
| Preparation Phase | Core Actions | Technological Tools | Duration |
|---|---|---|---|
| Initial Coordination | Meeting with organizers, frequency allocation review | Communication protocols, frequency databases | 3-5 days prior |
| Site Survey & Mapping | GPS coordinate collection, terrain analysis | Geographic information systems (GIS), drones for aerial survey | 2 days prior |
| Electromagnetic Pre-scan | Baseline spectrum measurement within 5-10 km radius | Mobile monitoring vehicles, fixed stations | 1-2 days prior |
| Risk Identification | Detection of existing signals, interference sources | Spectrum analyzers, direction finders | Ongoing during prep |
During rehearsals for the drone light show, we implement real-time monitoring to detect and address any anomalies. Unauthorized drone activities, often termed “black flights,” are a significant threat. Using drone detection systems, we collaborate with security agencies to identify and neutralize such intrusions. In one case, we assisted in pinpointing 13 unauthorized drones during rehearsals, preventing potential collisions or signal jamming. This proactive approach is vital for maintaining the integrity of the drone light show. The electromagnetic environment is dynamic, and continuous vigilance is required. We employ mathematical models to predict signal behavior. For example, the received signal power \( P_r \) at a monitoring point can be estimated using the Friis transmission equation: $$ P_r = P_t G_t G_r \left( \frac{\lambda}{4\pi d} \right)^2 $$ where \( P_t \) is transmitted power, \( G_t \) and \( G_r \) are antenna gains, \( \lambda \) is wavelength, and \( d \) is distance from the source. By comparing measured \( P_r \) with expected values, we can flag deviations indicative of interference.
The core of our operational strategy during a live drone light show is “full-time duty + full-spectrum monitoring.” From hours before the event until its conclusion, we deploy mobile monitoring vehicles equipped with high-precision spectrum analyzers and portable devices for foot patrols. The focus is on key frequency bands: 2.4 GHz and 5.8 GHz for drone command-and-control links, and GPS bands (e.g., L1 at 1575.42 MHz) for navigation. We scan these bands continuously, analyzing signal characteristics such as bandwidth, modulation, and power levels. The table below outlines the monitoring parameters for a standard drone light show.
| Frequency Band | Primary Use in Drone Light Show | Monitoring Threshold | Potential Interference Sources |
|---|---|---|---|
| 2.400 – 2.4835 GHz | Drone remote control, telemetry data | Power density < -80 dBm/Hz | Wi-Fi networks, Bluetooth devices, microwave ovens |
| 5.725 – 5.850 GHz | High-speed data transmission for video and control | SNR > 20 dB | Radar systems, satellite links, illegal transmitters |
| 1.57542 GHz (GPS L1) | Drone positioning and navigation | Carrier-to-noise ratio (C/N0) > 35 dB-Hz | GPS jammers, accidental emissions from electronics |
To quantify the quality of the electromagnetic environment, we often calculate the signal-to-noise ratio (SNR) and carrier-to-interference ratio (C/I). For a drone light show, maintaining high ratios is essential. The SNR is given by: $$ SNR = \frac{P_{signal}}{P_{noise}} $$ where \( P_{signal} \) is the power of the desired drone signal and \( P_{noise} \) is the background noise power. In decibels, \( SNR_{dB} = 10 \log_{10}(SNR) \). We aim for \( SNR_{dB} > 20 \) dB in critical bands to ensure reliable communication. Similarly, C/I assesses interference from other signals: $$ C/I = \frac{P_{carrier}}{P_{interference}} $$ where \( P_{carrier} \) is the drone signal power and \( P_{interference} \) is power from interfering sources. A C/I below 15 dB may cause performance degradation in a drone light show.
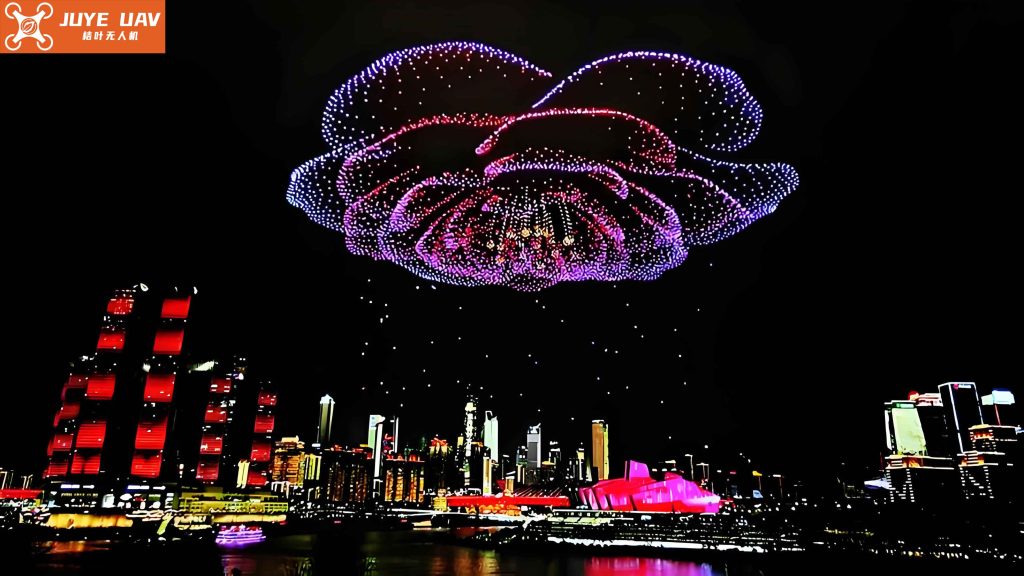
This visual representation captures the mesmerizing beauty of a drone light show, where each drone acts as a pixel in a grand aerial canvas. The precision required for such displays hinges on uninterrupted radio frequency links. During one notable event, a drone light show featuring 1000 drones performed flawlessly, painting the night sky with vibrant messages and patterns. Our team ensured zero interference through relentless monitoring. The success of this drone light show demonstrated the effectiveness of our protocols. Beyond entertainment, drone light shows are increasingly used for commercial and ceremonial purposes, amplifying the need for robust spectrum management.
In another scenario, during a major international sports event with live broadcast, our responsibilities extended to safeguarding wireless microphones, cameras, and timing systems. However, we also employed drone monitoring systems to detect unauthorized signals in the GPS band, which could affect aerial cameras or nearby drone operations. This highlights the interconnected nature of radio spectrum security; lessons from securing a drone light show apply broadly. We used triangulation techniques to locate illegal jammers. The location error \( \Delta d \) in such operations can be modeled by: $$ \Delta d = c \cdot \Delta t $$ where \( c \) is the speed of light and \( \Delta t \) is the time difference of arrival (TDOA) measurement error. Minimizing \( \Delta t \) through synchronized sensors allows precise localization, crucial for rapid response.
The technological arsenal for drone light show保障 includes both hardware and software tools. Mobile monitoring vehicles are equipped with software-defined radios (SDRs) that enable flexible frequency coverage and real-time signal processing. Portable spectrum analyzers allow technicians to conduct on-foot patrols around the venue, checking for localized interference. Data from these devices is aggregated into a central system for analysis. We often use algorithms to detect anomalies, such as sudden spikes in power or unauthorized modulations. For instance, an automated interference detection algorithm might trigger an alert if the power in a protected band exceeds a threshold: $$ P_{measured} > P_{threshold} + \sigma $$ where \( \sigma \) is the standard deviation of historical noise floor data. This proactive detection is vital for a drone light show, where even brief interference can cause drones to deviate from their programmed paths.
Risk management for a drone light show involves identifying vulnerabilities and implementing countermeasures. We conduct threat modeling exercises, considering both accidental and malicious interference sources. The table below categorizes common risks and mitigation strategies for a drone light show.
| Risk Category | Specific Threat | Probability | Impact on Drone Light Show | Mitigation Measures |
|---|---|---|---|---|
| Technical Failures | Drone transmitter malfunction | Low | Individual drone loss, formation gap | Redundant communication links, pre-flight checks |
| Environmental Interference | Multipath fading in urban areas | Medium | Signal degradation, control latency | Site selection, antenna diversity, equalization techniques |
| Human-Induced Interference | Illegal jammers or unauthorized transmitters | Medium-High | Complete loss of control, drone drift or collision | Real-time monitoring, rapid localization, legal enforcement |
| Spectrum Congestion | Co-channel interference from other services | High in dense areas | Reduced SNR, increased error rates | Frequency coordination, dynamic frequency selection (DFS) |
To optimize spectrum usage during a drone light show, we sometimes employ cognitive radio techniques, where drones dynamically switch frequencies based on environment sensing. This can be modeled as a Markov decision process, where the state \( s \) represents the current channel conditions, and the action \( a \) is the frequency selection. The goal is to maximize the expected reward \( R \), which could be defined as signal quality: $$ R = \sum_{t=0}^{\infty} \gamma^t Q(s_t, a_t) $$ where \( \gamma \) is a discount factor and \( Q \) is the quality function. While still emerging, such approaches promise greater resilience for future drone light shows.
Coordination with multiple stakeholders is essential for a successful drone light show. We work closely with event organizers, local authorities, aviation regulators, and communication service providers. This collaboration ensures that all wireless activities in the vicinity are harmonized. For example, we may request temporary restrictions on certain frequency bands or power levels for other services during the drone light show. In one instance, we coordinated with a nearby airport to adjust radar emissions to avoid harmonic interference with drone control links. The complexity of these interactions underscores the importance of a unified command structure. Our team often acts as the central node for radio frequency-related decisions during a drone light show.
The evolution of drone light show technology presents new challenges and opportunities. As drone counts increase to thousands, and formations become more intricate, the demand for spectrum efficiency grows. We are exploring the use of millimeter-wave bands (e.g., 24 GHz or 60 GHz) for high-density communication in drone light shows. However, these bands have higher path loss, modeled by the free-space path loss formula: $$ FSPL = 20 \log_{10}(d) + 20 \log_{10}(f) + 20 \log_{10}\left(\frac{4\pi}{c}\right) $$ where \( d \) is distance in meters, \( f \) is frequency in Hz, and \( c \) is speed of light. At 60 GHz, atmospheric absorption also becomes significant, adding another term: $$ L_{absorption} = \alpha(f) \cdot d $$ where \( \alpha(f) \) is the absorption coefficient. These factors must be carefully considered when designing communication systems for next-generation drone light shows.
Training and skill development are crucial for our team. We regularly conduct simulations of interference scenarios for drone light shows, using software tools to emulate various electromagnetic conditions. Technicians are trained in signal analysis, direction finding, and emergency response. We also study past incidents to improve protocols. For example, analysis of a drone light show disruption due to a hidden jammer led us to enhance our mobile detection capabilities. The learning curve is steep, but each event adds to our expertise. The ultimate reward is seeing a drone light show unfold without a hitch, knowing our efforts contributed to its success.
Looking ahead, the proliferation of drone light shows worldwide will require standardized frameworks for spectrum management. I advocate for international guidelines that address frequency allocation, power limits, and interference mitigation specifically for drone light shows. Such standards could include mandatory pre-show electromagnetic compatibility (EMC) assessments and real-time monitoring requirements. By sharing best practices and technological innovations, we can ensure that drone light shows continue to inspire awe while operating safely and reliably. The drone light show is more than a spectacle; it is a testament to human ingenuity and the invisible infrastructure that makes it possible.
In conclusion, my experiences in radio spectrum保障 for drone light shows have reinforced the importance of meticulous planning, advanced technology, and interdisciplinary collaboration. Every drone light show is a unique challenge, but the fundamental principles remain: know your environment, monitor relentlessly, and respond swiftly. Through formulas that model signal propagation, tables that organize risks, and protocols that guide actions, we create a shield against interference. The drone light show represents a harmonious blend of art and science, and I am proud to play a role in safeguarding its magic. As technology advances, our methods will evolve, but the commitment to excellence will remain constant, ensuring that every drone light show soars without constraint.