
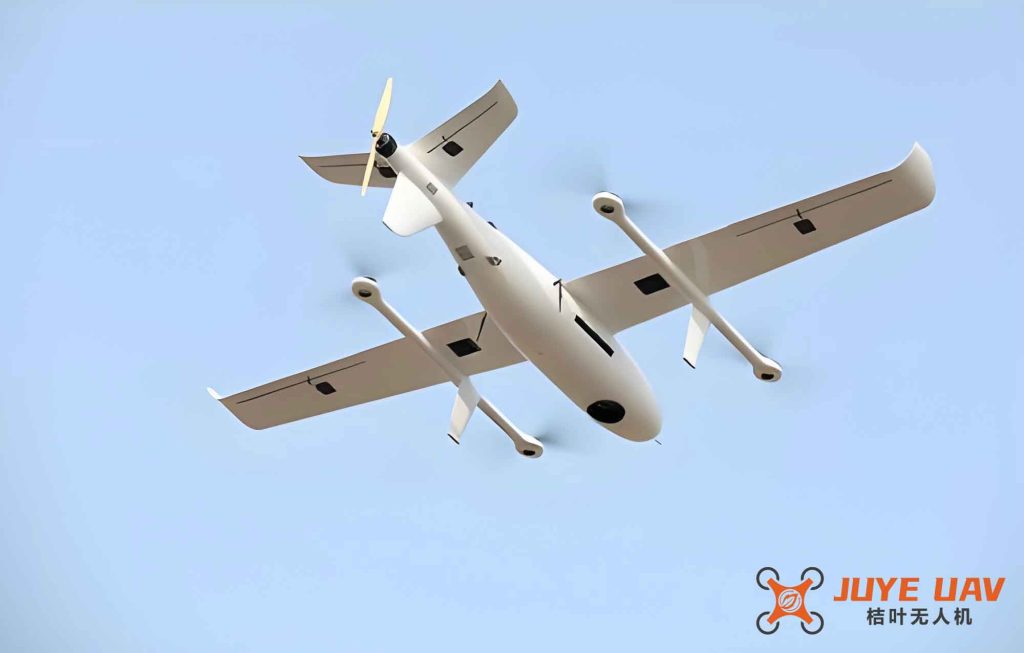
In our research, we tackle the critical challenge of enhancing urban traffic system resilience through strategic placement of fixed-wing drone takeoff and landing facilities during emergency events. Modern cities face increasing pressure from escalating vehicle populations and frequent traffic incidents, which degrade road efficiency and safety. Fixed-wing drones offer unique advantages in emergency response due to their extended range, higher speed, and longer endurance compared to multirotor platforms. However, their effective deployment depends fundamentally on an optimized network of ground infrastructure. We propose a comprehensive multi-objective optimization framework that balances economic efficiency with resilience performance across the entire lifecycle of these facilities.
Our methodology begins with identifying traffic emergency demand points using multi-source heterogeneous data, including road network topology, operational status, and historical incident records. We capture both recurring congestion points (e.g., near schools, construction zones, transit hubs) and high-frequency accident locations (annual occurrences exceeding 15 incidents). For analysis, we selected Changqing District in Jinan City, China, extracting 100 emergency demand points distributed across arterial, secondary, and expressway networks. The spatial distribution reveals clustering patterns that inform our facility planning strategy.
Methodological Framework
1. Demand Point Clustering and Candidate Site Identification
We employ K-means clustering with the elbow method to automatically determine optimal clustering parameters. The sum of squared errors (SSE) function guides our selection:
$$
SSE = \sum_{i=1}^{K} \sum_{x \in C_i} ||x – \mu_i||^2
$$
Through iterative analysis and SSE evaluation, we identify K=10 as the optimal cluster count where the marginal decrease in SSE becomes negligible. The resulting cluster centroids serve as candidate facility locations, as shown in Table 1.
| Candidate ID | Coordinates (Lat, Lon) | Demand Points Served | Cluster Density |
|---|---|---|---|
| C01 | 36.55, 116.75 | 12 | High |
| C02 | 36.58, 116.78 | 9 | Medium |
| C03 | 36.52, 116.72 | 14 | High |
| C04 | 36.60, 116.80 | 7 | Low |
| C05 | 36.48, 116.68 | 11 | Medium |
| C06 | 36.62, 116.82 | 8 | Low |
| C07 | 36.54, 116.70 | 13 | High |
| C08 | 36.56, 116.76 | 10 | Medium |
| C09 | 36.50, 116.65 | 6 | Low |
| C10 | 36.59, 116.79 | 10 | Medium |
2. Multi-Objective Optimization Model
We formulate the facility location problem as a multi-objective optimization with two primary objectives: minimizing total lifecycle cost and maximizing resilience efficiency. The model accounts for fixed-wing drone operational constraints including range limits, service capacity, and coverage requirements.
Objective 1: Total Lifecycle Cost Minimization
Total cost combines annualized facility and drone costs over their respective lifespans:
$$
f_1 = \sum_{i \in I} \sum_{g \in G} \left( \frac{c_g}{l_g} + cm_g \right) \times z_{gi} + \sum_{i \in I} \left( \frac{c_i}{l_i} + cm_i \right) \times x_i
$$
Where: c_g is drone procurement cost (20,000 yuan), l_g is drone lifespan (5 years), cm_g is annual maintenance cost (5,000 yuan), c_i is facility construction cost (200,000 yuan), l_i is facility lifespan (10 years), cm_i is annual facility maintenance (50,000 yuan). Decision variables x_i indicates facility selection and z_{gi} indicates drone assignment.
Objective 2: Resilience Efficiency Maximization
We develop a three-dimensional resilience metric capturing pre-event robustness, pre-event redundancy, and post-event rapidity:
$$
f_2 = C’_s + E’ + H’
$$
Where normalized components include:
Robustness (C_s): Degree centrality measuring structural importance
$$
C_s = \sum_{i \in I} \sum_{j \in J} y_{ij}
$$
Redundancy (E): Average node redundancy measuring backup capability
$$
E = \frac{\sum_{i \in I} \sum_{j \in J} y_{ij} – Q}{\sum_{i \in I} x_i}
$$
Rapidity (H): Spatial accessibility via Gaussian two-step floating catchment area method
$$
H = \sum_{i \in I} \sum_{j \in J} R_i \times e^{-\frac{1}{2}(\frac{d_{ij}}{d_0})^2}
$$
$$
R_i = \frac{\sum_{g \in G} z_{gi}}{\sum_{i \in I} \sum_{j \in J} y_{ij} \times e^{-\frac{1}{2}(\frac{d_{ij}}{d_0})^2}}
$$
These metrics collectively capture the system’s ability to resist, absorb, and recover from disruptions throughout the emergency lifecycle.
3. Constraints
Our model incorporates critical operational constraints:
Facility capacity constraint: Each facility accommodates maximum 3 fixed-wing drones
$$
\sum_{g \in G} z_{gi} \leq N_{i}^{max}, \quad \forall i \in I
$$
Drone service constraint: Each drone serves at most one demand point
$$
\sum_{j \in J} w_{gj} \leq 1, \quad \forall g \in G
$$
Facility count constraint: Selected facilities must be between 1 and K (10 candidates)
$$
1 \leq \sum_{i \in I} x_i \leq K
$$
Assignment constraint: One-to-one drone-to-facility assignment
$$
\sum_{i \in I} z_{gi} \leq 1, \quad \forall g \in G
$$
Coverage constraint: Service within 15 km range
$$
w_{gj} \times z_{gi} \times d_{ij} \leq d_0 \times y_{ij}, \quad \forall i, j, g
$$
Logical constraints: Facility activation governs drone assignment
$$
z_{gi} \leq x_i, \quad \forall g, i
$$
$$
y_{ij} \times d_{ij} \leq x_i \times d_0, \quad \forall i, j
$$
4. Solution Algorithm: NSGA-II
We employ the Non-dominated Sorting Genetic Algorithm II (NSGA-II) for its proven effectiveness in multi-objective optimization. The algorithm’s key features include:
- Non-dominated sorting for Pareto front identification
- Crowding distance mechanism for solution diversity
- Elitist strategy preserving superior solutions
The crowding distance calculation guides selection:
$$
o_a = \sum_{b=1}^{n_f} \frac{f_b(x_{a+1}) – f_b(x_{a-1})}{f_b^{max} – f_b^{min}}
$$
Algorithm parameters: population size = 100, chromosome length = 24 bits, crossover probability = 0.8, mutation probability = 0.1, maximum iterations = 100.
Results and Analysis
Optimal Facility Configuration
Through Pareto optimization and marginal benefit analysis, we identify the optimal balance between cost and resilience at 7 facilities. Table 2 compares our multi-objective model against single-objective alternatives.
| Model | Facilities | Coverage (%) | Total Cost (×10^6 yuan) | Normalized Cost | Robustness | Redundancy | Rapidity | Composite Benefit |
|---|---|---|---|---|---|---|---|---|
| Cost-Only | 5 | 93 | 1.250 | 0.25 | 0.65 | 0.63 | 0.75 | 0.43 |
| Resilience-Only | 8 | 97 | 2.375 | 0.24 | 0.98 | 0.79 | 0.97 | 0.67 |
| Multi-Objective | 7 | 98 | 2.075 | 0.15 | 0.84 | 0.83 | 0.90 | 0.71 |
Key findings from our analysis:
- The multi-objective model adds only 2 facilities compared to the cost-only model while achieving 5.4% higher coverage and 26.6% higher resilience
- Compared to the resilience-only model, our approach reduces cost by 12.6% with only 6.2% resilience degradation
- The composite benefit value (0.71) surpasses both single-objective alternatives, demonstrating superior balance
Sensitivity Analysis Across Demand Scales
To validate model robustness, we test three demand scales: small (30 points), medium (60 points), and large (100 points). Table 3 summarizes results.
| Demand Scale | Facilities | Coverage (%) | Total Cost (×10^6 yuan) | Normalized Cost | Robustness | Redundancy | Rapidity | Composite Benefit |
|---|---|---|---|---|---|---|---|---|
| Small (30) | 4 | 100 | 1.125 | 0.12 | 0.86 | 0.86 | 0.86 | 0.74 |
| Medium (60) | 7 | 98 | 2.075 | 0.15 | 0.84 | 0.83 | 0.90 | 0.71 |
| Large (100) | 12 | 96 | 3.450 | 0.11 | 0.84 | 0.79 | 0.84 | 0.71 |
The composite benefit demonstrates remarkable stability, fluctuating less than 5% across all scales. The coverage remains high (96-100%) regardless of demand magnitude. We observe that redundancy decreases with scale (0.86 → 0.79), suggesting concentrated demand enables better backup resource allocation. The rapidity metric peaks at medium scale, attributable to balanced spatial distribution as confirmed by Nearest Neighbor Index (NNI) analysis:
$$
NNI = \frac{\frac{1}{n}\sum_{j}^{n} min(d)}{\frac{1}{2}\sqrt{\frac{n}{A}}}
$$
Small and medium scales show NNI ≤ 1 (clustered pattern), while large scale shows NNI > 1 (dispersed pattern). This spatial heterogeneity directly impacts rapidity performance, with the more balanced medium-scale distribution achieving optimal response times.
Implications for Fixed-Wing Drone Operations
Our findings have specific implications for fixed-wing drone deployment in emergency scenarios:
- Fixed-wing drones require 7-12 strategically placed facilities to achieve 96-98% coverage in our study area, compared to more facilities needed for multirotor equivalents
- The longer range of fixed-wing platforms (15 km service radius) enables efficient coverage with fewer facilities, reducing infrastructure investment
- The robustness metric (0.84-0.86) confirms fixed-wing drones’ structural importance in the emergency response network, reflecting their ability to serve multiple demand points efficiently
- The redundancy metric (0.79-0.86) indicates effective backup coverage, critical for maintaining service continuity during multiple simultaneous incidents
- Rapidity performance (0.84-0.90) validates fixed-wing drones’ rapid response capability, essential for time-critical emergency interventions
Conclusion and Future Work
Our research presents a comprehensive framework for optimizing fixed-wing drone takeoff and landing facility locations to enhance urban traffic system resilience. The key contributions include:
- Integration of multi-source heterogeneous data for demand identification and spatial analysis
- Development of a full lifecycle resilience assessment framework encompassing robustness, redundancy, and rapidity dimensions
- Construction of a multi-objective optimization model balancing cost efficiency and resilience performance
- Validation through computational experiments demonstrating model robustness across varying demand scales
The multi-objective model achieves 98% coverage of emergency demand points while maintaining 26.6% higher resilience compared to cost-only approaches, all with only 12.6% additional investment. The solution demonstrates remarkable stability (<5% composite benefit fluctuation) across demand scales from 30 to 100 points.
Future research directions include:
- Integration of demand urgency weighting and dynamic task scheduling for fixed-wing drones
- Co-optimization of facility location and capacity planning
- Extension to multi-modal emergency response systems combining fixed-wing drones with ground vehicles
- Consideration of dynamic facility relocation strategies during evolving emergency situations
- Incorporation of weather constraints and no-fly zones affecting fixed-wing drone operations
This work provides theoretical foundations and practical guidance for smart city infrastructure planners seeking to establish resilient fixed-wing drone networks for traffic emergency management.