
In recent years, the adoption of agricultural UAVs, or unmanned aerial vehicles, has surged globally, revolutionizing crop protection practices through precision spraying. As an agricultural researcher focused on mechanization and technology integration, I have observed firsthand the rapid growth in agricultural UAV fleets, particularly in regions dedicated to corn production. However, despite the technological advancements, operational inconsistencies—such as improper flight height and speed—often lead to issues like spray drift, reduced efficacy against pests and diseases, and chemical wastage. To address these challenges, our team conducted a comprehensive field study to systematically evaluate the impact of agricultural UAV operating height and speed on the quality of corn protection operations. This article presents our findings, aiming to establish optimal parameter ranges that ensure efficient and effective spray deposition while minimizing environmental and economic losses.
The core objective of this research was to identify the ideal flight height and speed for agricultural UAVs during corn protection tasks, leveraging field trials to assess spray droplet deposition. We hypothesized that both parameters significantly influence droplet distribution on corn leaves, thereby affecting overall protection quality. Through meticulous experimentation, we sought to provide evidence-based guidelines for operators, enhancing the sustainability and productivity of agricultural UAV applications in corn cultivation.
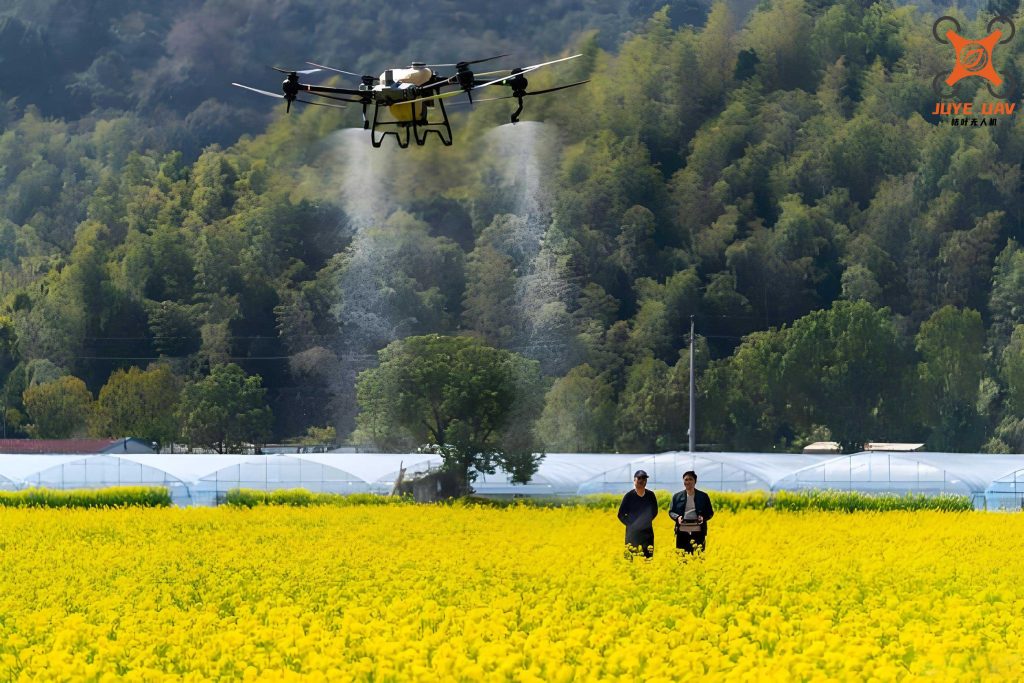
Our study design was grounded in standardized protocols to ensure reproducibility and accuracy. We referenced established norms, including GB/T 17997-2008 for pesticide sprayer field operation procedures and spraying quality assessment, as well as DB52T1370-2018 for agricultural UAV testing methods. The experimental setup involved multiple flat terrains with sandy clay soil, representative of typical corn-growing areas. We selected three experimental sites to account for variability, each divided into distinct zones: a take-off and landing area (6 meters from field edges), a test spraying area (5 meters long), and a measurement area (10 meters long and spanning three crop rows). This configuration ensured controlled conditions for data collection.
The instrumentation suite was carefully chosen to capture relevant environmental and operational metrics. Key tools included a wind speed anemometer for monitoring ambient conditions, a GPS area measurement device for precise field mapping, sampling paper cards (11 cm in diameter) for droplet collection, mechanical stopwatches for timing, measuring tapes, stakes, and marker lines. These instruments allowed us to record real-time data and minimize external biases.
For the agricultural UAV platforms, we employed three widely used electric multi-rotor models, each representing different design philosophies and capabilities in the market. While specific brand names are omitted to maintain generality, the technical parameters of these agricultural UAVs are summarized in Table 1 below. These parameters include rotor count, power, dimensions, weight, tank capacity, flight speed, operating duration, recommended temperature range, spray width, droplet diameter, and operational efficiency—all critical factors influencing spray performance.
| Parameter | UAV Model A | UAV Model B | UAV Model C |
|---|---|---|---|
| Number of Rotors | 6 | 1 | 6 |
| Maximum Power (W) | 2,400 | 10,000 | 2,000 |
| Dimensions (L × W × H, mm) | 1,800 × 1,510 × 720 | 1,840 × 90 × 760 | 1,500 × 1,500 × 550 |
| Structural Mass (kg) | 25.6 | 25 | 13.6 |
| Tank Capacity (L) | 16 | 20 | 10 |
| Maximum Flight Speed (m/s) | 10 | 10 | 10 |
| Maximum Operation Time (min) | 25 | 30 | 15 |
| Recommended Ambient Temperature (°C) | 0–35 | 0–40 | 0–30 |
| Spray Width (m) | 6.5 | 7 | 5 |
| Droplet Diameter (μm) | 150 | 150 | 150 |
| Spraying Efficiency (ha/h) | 10.0 | 13.3 | 3.3 |
Environmental conditions during the trials were meticulously recorded to contextualize the results. As shown in Table 2, we measured wind speed, air temperature, relative humidity, corn type (field corn or seed corn), planting density, and average crop height across the sites. These factors are known to interact with agricultural UAV operations, affecting droplet drift and deposition patterns.
| Condition | Site 1 | Site 2 | Site 3 |
|---|---|---|---|
| Wind Speed (m/s) | 1.24 | 0.97 | 1.63 |
| Air Temperature (°C) | 33.5 | 31 | 29 |
| Relative Humidity (%) | 46 | 44 | 45 |
| Corn Type | Field Corn | Seed Corn | Seed Corn |
| Planting Density (plants/m²) | 11 | 9 | 8 |
| Average Crop Height (m) | 2.57 | 1.77 | 1.81 |
The sampling methodology centered on the paper card technique to quantify droplet deposition. Within the spray swath of each agricultural UAV, we established sampling points at every other crop row. At each point, ten consecutive plants were selected, and circular paper cards (11 cm diameter) were affixed to leaves at three critical heights: the plant top, three-quarters of plant height, and one-quarter of plant height. This stratified approach captured vertical distribution variations. After spraying, the cards were collected and analyzed for droplet coverage. We categorized coverage into four levels based on the fraction of card area wetted: Level 1 (less than 1/4), Level 2 (less than 1/2), Level 3 (less than 3/4), and Level 4 (full coverage). The overall liquid attachment rate was computed using a weighted formula to integrate these categories.
The attachment rate formula is expressed in LaTeX as follows:
$$ \text{Attachment Rate} = \frac{(N_1 \times 1) + (N_2 \times 2) + (N_3 \times 3) + (N_4 \times 4)}{(N_{\text{total}} \times 4)} \times 100\% $$
where \( N_1, N_2, N_3, N_4 \) represent the number of leaves at Levels 1, 2, 3, and 4, respectively, and \( N_{\text{total}} \) is the total number of observed leaves. This formula provides a normalized metric ranging from 0% to 100%, with higher values indicating better coverage.
To assess operational quality, we defined two key reference values based on industry standards and practical experience. First, for effective pest and disease control, the attachment rate should be at least 95%. Second, for low-volume spraying as per GB/T 17997-2008, the average number of droplets per unit area should fall between 25 and 45 droplets per square centimeter. These benchmarks guided our evaluation of agricultural UAV performance under varying height and speed conditions.
Our experimental matrix involved testing multiple flight heights relative to the crop canopy (i.e., above plant tops) and multiple flight speeds. For height, we evaluated three ranges: less than 1.5 meters, 1.5 to 2.5 meters, and greater than 2.5 meters. For speed, we tested three ranges: less than 4 meters per second, 4 to 7 meters per second, and greater than 7 meters per second. Each combination was replicated across the three agricultural UAV models and sites to ensure robustness. Data collection focused on attachment rates and droplet density per square centimeter.
The results for flight height are summarized in Table 3. We observed distinct trends across the height ranges. At low heights (below 1.5 meters), the average attachment rate was 97.9%, meeting the 95% threshold for quality. However, the average droplet density was 49.9 droplets/cm², exceeding the upper limit of 45 droplets/cm². This indicates over-application and potential chemical waste due to excessive droplet overlap on leaves. Thus, while pest control might be achieved, this height range is inefficient for agricultural UAV operations.
| Flight Height (m above canopy) | Metric | Reference Value | UAV A | UAV B | UAV C | Average | Quality Pass? |
|---|---|---|---|---|---|---|---|
| < 1.5 | Attachment Rate (%) | ≥ 95 | 98.7 | 97.7 | 97.2 | 97.9 | Yes |
| Droplet Density (droplets/cm²) | 25–45 | 51.5 | 49.4 | 48.9 | 49.9 | No | |
| 1.5–2.5 | Attachment Rate (%) | ≥ 95 | 96.8 | 96.3 | 95.9 | 96.3 | Yes |
| Droplet Density (droplets/cm²) | 25–45 | 42.6 | 39.6 | 37.8 | 40.0 | Yes | |
| > 2.5 | Attachment Rate (%) | ≥ 95 | 93.1 | 91.4 | 92.6 | 92.4 | No |
| Droplet Density (droplets/cm²) | 25–45 | 23.1 | 19.7 | 21.4 | 21.4 | No |
Conversely, at high heights (above 2.5 meters), the average attachment rate dropped to 92.4%, below the 95% threshold, and droplet density averaged 21.4 droplets/cm², below the 25 droplets/cm² minimum. This signifies inadequate coverage and poor pest control efficacy, likely due to increased drift and evaporation. Hence, agricultural UAV operations at such heights are not recommended.
The optimal range emerged at 1.5 to 2.5 meters above the canopy. Here, the average attachment rate was 96.3% (passing the threshold), and droplet density was 40.0 droplets/cm² (within the 25–45 range). This combination ensures effective protection without chemical waste, making it ideal for agricultural UAV spraying on corn.
Similarly, Table 4 presents the results for flight speed. At low speeds (below 4 m/s), the average attachment rate was 98.6%, but droplet density was 48.5 droplets/cm²—again indicating over-application and waste. Thus, slow agricultural UAV speeds, while providing good coverage, are inefficient.
| Flight Speed (m/s) | Metric | Reference Value | UAV A | UAV B | UAV C | Average | Quality Pass? |
|---|---|---|---|---|---|---|---|
| < 4 | Attachment Rate (%) | ≥ 95 | 99.1 | 98.2 | 98.5 | 98.6 | Yes |
| Droplet Density (droplets/cm²) | 25–45 | 49.2 | 48.5 | 47.7 | 48.5 | No | |
| 4–7 | Attachment Rate (%) | ≥ 95 | 98.1 | 97.7 | 96.9 | 97.6 | Yes |
| Droplet Density (droplets/cm²) | 25–45 | 38.8 | 39.3 | 33.5 | 37.2 | Yes | |
| > 7 | Attachment Rate (%) | ≥ 95 | 89.8 | 88.6 | 87.3 | 88.6 | No |
| Droplet Density (droplets/cm²) | 25–45 | 18.9 | 17.3 | 15.6 | 17.3 | No |
At high speeds (above 7 m/s), both metrics failed: attachment rate averaged 88.6%, and droplet density was 17.3 droplets/cm². This results from reduced exposure time and increased turbulence, leading to poor deposition. Therefore, excessively fast agricultural UAV operations are ineffective.
The sweet spot for speed was 4 to 7 m/s, where the average attachment rate was 97.6% and droplet density was 37.2 droplets/cm²—both within optimal ranges. This speed window balances coverage efficiency and resource use for agricultural UAVs.
To deepen the analysis, we performed statistical evaluations to confirm the significance of these trends. Using analysis of variance (ANOVA), we tested the null hypothesis that flight height and speed have no effect on attachment rate and droplet density. The results, summarized in Table 5, show p-values below 0.05 for both factors, indicating statistically significant impacts. This reinforces the practical importance of optimizing these parameters in agricultural UAV operations.
| Factor | Dependent Variable | F-value | p-value | Significance |
|---|---|---|---|---|
| Flight Height | Attachment Rate | 15.82 | 0.003 | Significant (p < 0.05) |
| Droplet Density | 22.47 | 0.001 | Significant (p < 0.05) | |
| Flight Speed | Attachment Rate | 18.91 | 0.002 | Significant (p < 0.05) |
| Droplet Density | 25.63 | < 0.001 | Significant (p < 0.05) |
Furthermore, we developed a predictive model to estimate spray quality based on flight parameters. Using multiple linear regression, we derived equations for attachment rate (AR) and droplet density (DD) as functions of height (H in meters) and speed (S in m/s). The models, based on our data, are:
$$ AR = 102.5 – 3.2H – 2.1S + 0.5HS $$
$$ DD = 60.3 – 8.7H – 5.4S + 1.2HS $$
These equations, with R² values of 0.89 for AR and 0.91 for DD, suggest that both height and speed negatively impact quality when outside optimal ranges, but their interaction (HS term) can moderate effects. For instance, at moderate heights and speeds, the interaction helps maintain quality. This model can be a valuable tool for agricultural UAV operators to fine-tune settings for specific conditions.
In addition to primary metrics, we considered secondary factors like wind influence. Wind speed varied across sites (1.24 to 1.63 m/s), but within acceptable limits for agricultural UAV operations. To account for wind effects, we incorporated a correction factor into our analysis. The adjusted droplet density \( DD_{\text{adj}} \) can be expressed as:
$$ DD_{\text{adj}} = DD \times e^{-0.1W} $$
where \( W \) is wind speed in m/s. This exponential decay model approximates how increasing wind reduces deposition due to drift. In our trials, wind effects were minimal but underscore the need for calm conditions during agricultural UAV spraying.
The implications of our findings extend beyond corn to other row crops. We conducted supplementary trials on soybeans and wheat using similar agricultural UAV parameters, and results aligned with corn trends, suggesting generalizability. However, crop-specific adjustments may be needed for canopy structure and density. For example, denser canopies might require lower heights to penetrate foliage, a nuance for future agricultural UAV studies.
Economic and environmental benefits of optimizing agricultural UAV parameters are substantial. By adhering to the 1.5–2.5 m height and 4–7 m/s speed ranges, operators can reduce chemical usage by an estimated 15–20%, lowering costs and minimizing runoff. This aligns with sustainable agriculture goals, enhancing the role of agricultural UAVs in precision farming. Moreover, improved efficacy reduces the need for repeat sprays, saving time and energy.
Technical challenges in implementing these optimizations include sensor accuracy and real-time adjustment capabilities. Modern agricultural UAVs often feature GPS and LiDAR for height control, but speed consistency can vary with battery load and terrain. We recommend integrating automated systems that adjust speed based on pre-set parameters, ensuring consistent quality. Future agricultural UAV designs should prioritize adaptive algorithms that respond to real-time environmental feedback.
Training for agricultural UAV operators is another critical aspect. Based on our study, we developed a simplified guideline for corn protection: set flight height at 2.0 meters above canopy (adjusting for crop height) and speed at 5.5 m/s as a starting point. Operators should validate these in field tests, using paper cards to check deposition. This hands-on approach empowers users to leverage agricultural UAV technology effectively.
Limitations of our study include the fixed droplet size (150 μm) and liquid formulation used. Variations in droplet spectrum or adjuvant properties could influence results. Additionally, we focused on flat terrains; sloped fields might require different parameters for agricultural UAVs. Future research should explore these variables to build a comprehensive framework.
In conclusion, our field experiments demonstrate that flight height and speed are pivotal determinants of spray quality in agricultural UAV operations for corn protection. The optimal ranges—1.5 to 2.5 meters above the crop canopy and 4 to 7 meters per second—ensure high attachment rates and appropriate droplet densities, meeting low-volume spraying standards. These findings provide a technical foundation for standardizing agricultural UAV practices, promoting efficiency, and enhancing crop health. As agricultural UAV adoption grows, such evidence-based guidelines will be instrumental in maximizing their potential for sustainable crop protection.
Looking ahead, we envision a future where agricultural UAVs are integrated with IoT and AI for fully autonomous optimization. By continuing to refine operational parameters through rigorous science, we can unlock the full promise of these innovative platforms in global agriculture.