
In the rapidly expanding field of low-altitude economy, the demand for unmanned aerial vehicles (UAVs) in civil aviation has surged dramatically. China UAV drone operations, particularly in winter humid environments, face significant risks from rotor icing. Icing on rotors not only increases the required power for these China UAV drones but can also lead to flight instability, jeopardizing safety. To ensure the safety of China UAV drone operations in cold conditions, UAVs with a take-off mass exceeding 25 kg are subject to airworthiness certification, requiring flight tests in low-temperature environments. However, existing flight and icing wind tunnel test methods have limitations: flight tests under natural icing conditions cannot fully capture the most critical design point conditions, and anti-icing/de-icing tests cannot replicate the complex combinations of liquid water content, droplet size, and flow fields observed in nature. Furthermore, ice shedding phenomena complicate the capture and measurement of ice shapes. Therefore, accurately predicting the icing process on China UAV drone rotors under specific flight conditions remains a pressing challenge.
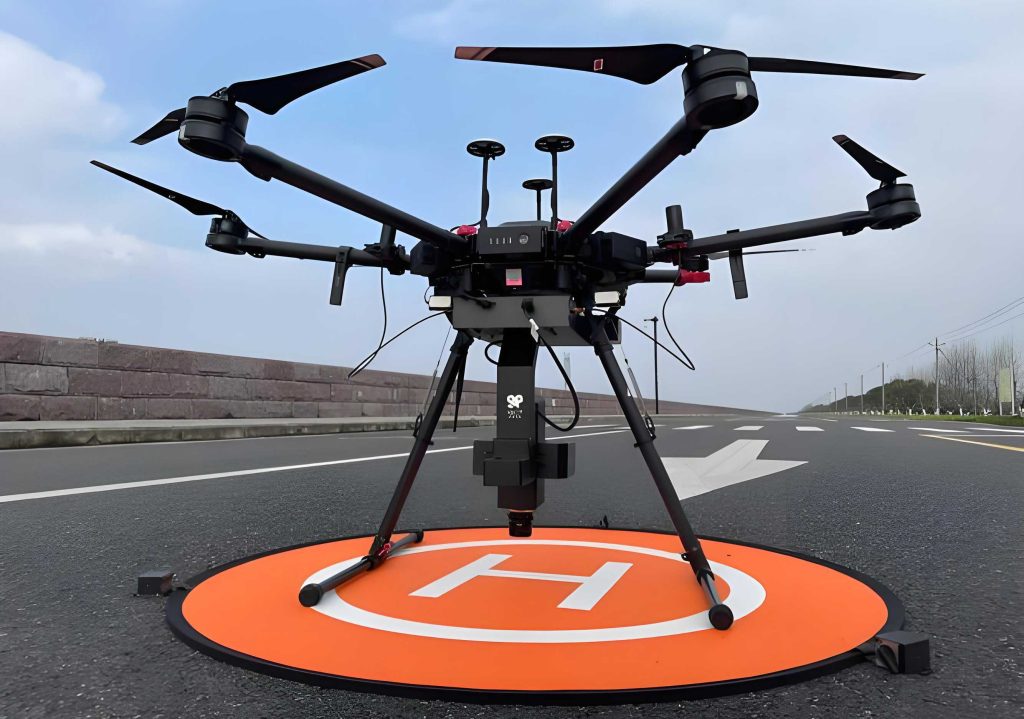
This study addresses the icing problem for China UAV drone rotors in hover by developing a numerical simulation method based on secondary development of Fluent User-Defined Functions (UDF). First, the two-phase flow field of air and water droplets is solved using the Eulerian method. The local water collection coefficient and ice shape on the three-dimensional rotor surface are then calculated through Fluent UDF programming. Subsequently, the Messinger icing thermodynamic model is improved by considering the water film momentum equation in three-dimensional coordinates. The advancement of such simulation tools is crucial for the safe design and airworthiness review of China UAV drone operating in challenging meteorological conditions.
1. Numerical Methodology and Physical Model
For the numerical simulation of China UAV drone rotor icing, the following physical assumptions are adopted: water droplets are spherical and do not deform during motion, neglecting deformation effects under high-speed airflow or other external forces; droplets do not break up before impacting the surface, and are uniformly distributed in the atmosphere, ignoring collisions and coalescence between droplets; the coupling between the droplet field and airflow field is one-way, meaning only the influence of the airflow on droplet motion is considered, neglecting feedback from droplets to the airflow; heat transfer and phase change processes of droplets in the flow field are not considered, and the physical properties of droplets remain constant during motion.
The airflow field is computed using Ansys Fluent. Droplet impingement characteristics are based on Fluent’s User-Defined Scalar (UDS) functionality, where centrifugal and Coriolis forces are introduced into the droplet momentum source term to directly solve the continuity and momentum equations in the rotating reference frame. The icing thermodynamic model is solved using Fluent UDF secondary development, and dynamic mesh functionality is invoked to obtain the ice shape.
1.1 Governing Equations for Droplets and Water Film
The droplet continuity equation in the rotating frame is:
$$ \frac{\partial (\alpha)}{\partial t} + \nabla \cdot (\alpha \mathbf{u_r}) = 0 $$
where $\alpha$ is the droplet volume fraction and $\mathbf{u_r}$ is the velocity relative to the rotating reference frame.
The droplet momentum equation is:
$$ \begin{aligned}
\frac{\partial (\alpha \rho_w \mathbf{u_r})}{\partial t} + \nabla \cdot (\alpha \rho_w \mathbf{u_r} \mathbf{u_r}) – \alpha \rho_w (2 \boldsymbol{\omega} \times \mathbf{u_r} + \boldsymbol{\omega} \times (\boldsymbol{\omega} \times \mathbf{r}) + \frac{d\boldsymbol{\omega}}{dt} \times \mathbf{r}) = \mathbf{D}
\end{aligned} $$
with
$$ \mathbf{D} = N \frac{\pi d^2}{8} \rho_a C_d |\mathbf{u_a} – \mathbf{u_r}| (\mathbf{u_a} – \mathbf{u_r}) + \alpha \rho_w \mathbf{g} $$
and the drag coefficient $C_d$ given by:
$$ C_d = \begin{cases}
\frac{24}{Re} (1 + 0.15 Re^{0.687}) & Re \leq 1000 \\
0.44 & Re > 1000
\end{cases} $$
Here, $\rho_w$ is water density, $\boldsymbol{\omega}$ is angular velocity, $\mathbf{r}$ is position vector, $N$ is number density, $d$ is droplet diameter, $\rho_a$ is air density, $\mathbf{u_a}$ is air relative velocity, $\mathbf{g}$ is gravity, and $Re$ is relative Reynolds number.
The water collection coefficient $\beta$, a key parameter, is defined as:
$$ \beta = \frac{\alpha \max(\mathbf{u_r} \cdot \mathbf{n}, 0)}{\alpha_\infty U} $$
where $\mathbf{n}$ is the surface normal vector, $\alpha_\infty$ is freestream droplet volume fraction, and $U = |\boldsymbol{\omega} \times \mathbf{r}|$ is the far-field air relative speed.
The water film continuity and energy equations are based on the improved Messinger model:
$$ \sum_i m_{in,i} + m_{imp} = \sum_j m_{out,j} + m_{ice} + m_{ev} $$
$$ \sum_i Q_{in,i} + Q_{imp} + Q_{ice} + Q_{aero} = \sum_j Q_{out,j} + Q_{ev} + Q_{conv} $$
where $m$ denotes mass rates (inflow, impingement, outflow, ice formation, evaporation) and $Q$ denotes energy rates (inflow, impingement, ice release, aerodynamic heating, outflow, evaporation, convection).
The water film momentum equation in three-dimensional coordinates, considering centrifugal and Coriolis forces, is:
$$ \begin{aligned}
\rho_w (\mathbf{V_f} \cdot \nabla) \mathbf{V_f} = -\nabla P – \rho_w [\boldsymbol{\omega} \times (\boldsymbol{\omega} \times \mathbf{r}) + 2 \boldsymbol{\omega} \times \mathbf{V_f}] + \mu_d \nabla^2 \mathbf{V_f}
\end{aligned} $$
where $\mathbf{V_f}$ is water film velocity, $P$ is air pressure, and $\mu_d$ is dynamic viscosity of water.
1.2 Numerical Verification and Computational Setup
To validate the flow solver, the standard “Caradonna-Tung” (C-T) rotor hover case is used. The rotor has a NACA0012 airfoil section with chord $c = 0.1905$ m, aspect ratio 6, collective pitch of 8°, and a tip Mach number of 0.877. The computational domain is cylindrical with radius 3R and height 8R, where R is rotor radius (1.143 m). The Spalart-Allmaras turbulence model is selected for its computational efficiency. Surface mesh is refined with a first-layer height of 0.01 mm and 25 layers to ensure $y^+ \approx 1$. Pressure coefficient $C_p$ comparisons at various radial stations show excellent agreement with experimental data, confirming accuracy for subsequent droplet and icing calculations.
For icing validation, a case from literature (Case 28) is simulated: NACA0015 airfoil, chord 0.152 m, radius 1.24 m, rotational speed 600 RPM, tip Mach 0.39, liquid water content 2.0 g/m³, median volumetric diameter 15 μm, temperature -15.6°C, icing time 180 s. Grid independence studies are conducted, and results indicate that a mesh of approximately 8.73 million cells yields grid-independent ice shapes. Comparison with experimental ice shapes shows good agreement, with an overall error of 9.7% for key ice shape parameters defined as:
| Parameter | Definition |
|---|---|
| $h_{up}$ | Upper ice horn height |
| $h_{low}$ | Lower ice horn height |
| $h_{stag}$ | Ice thickness at stagnation point |
| $\theta_{up}$ | Upper ice horn angle |
| $\theta_{low}$ | Lower ice horn angle |
The error $\sigma$ is calculated as:
$$ \sigma = \frac{|h_{case} – h_{exp}|}{h_{exp}} \times 100\% $$
This validates the reliability of the method for China UAV drone rotor icing simulation.
2. Results and Analysis for China UAV Drone Rotor Icing
2.1 Water Collection Coefficient Characteristics
The water collection coefficient $\beta$ is crucial for icing risk assessment. For China UAV drone rotors in hover, $\beta$ at the stagnation point is analyzed across droplet diameters from 5 to 35 μm, covering typical icing envelopes. The variation of $\beta$ along the span (normalized radial position $r/R$) for different droplet sizes is summarized in Table 1.
| Droplet Diameter (μm) | $\beta$ Trend along Span ($r/R$) | Notable Feature |
|---|---|---|
| 5-10 | Gradual increase, no sharp drop | Minimal tip vortex influence |
| 15-35 | Increase to max, then sharp drop near tip ($r/R > 0.8$) | Tip vortex low-density region effect |
The maximum drop rate $\eta_{down}$ quantifies the reduction near the tip:
$$ \eta_{down} = \frac{\beta_{max} – \beta_{min}}{\beta_{max}} $$
Figure 1 shows $\eta_{down}$ versus droplet diameter $d$, indicating an approximately linear increase. Smaller droplets, with lower inertia, follow airflow streamlines more easily, avoiding impingement zones, leading to lower $\beta$ overall and less pronounced tip effects. This behavior is critical for assessing icing on China UAV drone rotors across various meteorological conditions.
2.2 Influence of Ambient Temperature on Ice Shape
Simulations are conducted for a China UAV drone rotor at static pressure 101.325 kPa, rotational speed 600 RPM, liquid water content 2.0 g/m³, droplet size 15 μm, icing time 180 s, with ambient temperatures ranging from -5°C to -25°C. Ice shapes at different radial positions ($r/R = 0.6, 0.7, 0.8, 0.9$) are extracted. Key observations are:
- Ice thickness at the stagnation point increases monotonically with decreasing temperature.
- Ice horns (upper and lower) appear and grow, then migrate towards the stagnation point as temperature drops, eventually merging and disappearing at very low temperatures.
- The freezing limit (downstream extent of ice accretion) moves forward (towards leading edge) with lower temperature; at higher temperatures, it is closer to the trailing edge and shifts aft with increasing $r/R$.
These trends are quantified in Table 2 for $r/R = 0.8$.
| Temperature (°C) | $h_{stag}$ (mm) | $h_{up}$ (mm) | $h_{low}$ (mm) | Freezing Limit ($x/c$) |
|---|---|---|---|---|
| -5 | 1.2 | 0.0 | 0.0 | 0.85 |
| -10 | 2.8 | 0.5 | 0.4 | 0.72 |
| -15 | 4.5 | 1.2 | 1.0 | 0.61 |
| -20 | 6.1 | 1.8 | 1.7 | 0.53 |
| -25 | 7.3 | 0.0* | 0.0* | 0.48 |
*Ice horns merged into stagnation ice.
The underlying physics involves enhanced convective heat transfer at lower temperatures, which freezes more impinging water at the stagnation point, reducing runoff. Aerodynamic heating at the stagnation point also plays a role, but its effect is overshadowed by the strong cooling at very low temperatures. This has direct implications for the operational envelope of China UAV drone in cold climates.
2.3 Influence of Liquid Water Content on Ice Shape
Using conditions: pressure 101.325 kPa, speed 600 RPM, temperature -15°C, droplet size 15 μm, icing time 180 s, liquid water content (LWC) is varied from 0.5 to 2.0 g/m³ as per typical China UAV drone icing envelopes. Ice shapes are analyzed at radial positions. Results show:
- Overall ice dimensions increase with LWC, but the growth rate of stagnation point thickness $h_{stag}$ diminishes at higher LWC.
- Ice horn formation becomes pronounced when $h_{stag}$ growth saturates; excess water runs back and freezes laterally, increasing horn height.
- Higher LWC leads to more extensive water film development, affecting ice accretion patterns.
Table 3 details the percentage increase in $h_{stag}$ with rising LWC at different radial positions.
| Radial Position ($r/R$) | $\Delta h_{stag}$% from 0.5 to 1.0 g/m³ | $\Delta h_{stag}$% from 1.0 to 1.5 g/m³ | $\Delta h_{stag}$% from 1.5 to 2.0 g/m³ |
|---|---|---|---|
| 0.6 | 119.2% | 52.0% | 10.9% |
| 0.7 | 115.6% | 47.4% | 7.4% |
| 0.8 | 113.2% | 31.8% | 6.0% |
| 0.9 | 111.2% | 27.5% | 8.0% |
The diminishing returns in $h_{stag}$ growth indicate that heat transfer limits ice formation at the stagnation point; additional water runs off to form horns. This is critical for China UAV drone performance, as ice horns dramatically alter aerodynamics.
2.4 Water Film Velocity Distribution Patterns
The distribution of water film velocity $|\mathbf{V_f}|$ on the rotor surface significantly influences ice shape. Under different LWC conditions, $|\mathbf{V_f}|$ maps are analyzed. Key findings:
- At LWC = 1.5 g/m³, noticeable water film velocity appears around $r/R=0.6$.
- As LWC increases to 2.0 g/m³, the region of appreciable $|\mathbf{V_f}|$ expands both spanwise (toward tip and root) and chordwise (from stagnation point aft).
- Higher $|\mathbf{V_f}|$ promotes water runoff, leading to ice horn growth away from the stagnation point.
The relationship can be summarized by the approximate scaling:
$$ |\mathbf{V_f}| \propto \sqrt{\frac{\tau_{air} + \rho_w \omega^2 r \delta}{\mu_d}} $$
where $\tau_{air}$ is air shear stress, $\delta$ is film thickness. This illustrates how centrifugal force (term $\rho_w \omega^2 r \delta$) and air shear drive the film, especially important for rotating China UAV drone rotors. The expansion of $|\mathbf{V_f}|$ regions with LWC explains the observed ice horn development and underscores the need for three-dimensional modeling in China UAV drone icing simulations.
3. Conclusion and Future Perspectives for China UAV Drone
This study developed a numerical simulation method based on Fluent UDF secondary development to investigate hovering rotor icing for small China UAV drone. The method accurately predicts droplet impingement, ice accretion, and water film dynamics, validated against benchmark cases. Key findings for China UAV drone rotor icing include:
- Water collection coefficient at the stagnation point exhibits a sharp drop near the tip for droplets >15 μm due to tip vortex influence, quantified by a maximum drop rate linearly increasing with droplet size.
- Ambient temperature strongly affects ice morphology: lower temperatures increase stagnation point thickness, cause ice horns to form and migrate, and shift the freezing limit forward.
- Liquid water content increases overall ice accretion, but stagnation point thickness growth saturates at higher LWC, with excess water forming prominent ice horns via runoff.
- Water film velocity distribution expands with increasing LWC, driven by air shear and centrifugal forces, explaining spanwise and chordwise ice growth patterns.
These insights provide a theoretical foundation for the safety design and airworthiness assessment of China UAV drone operating in icing conditions. However, current models assume small supercooled droplets. Since airworthiness regulations do not yet require compliance verification for supercooled large droplet (SLD) conditions, future work should extend the methodology to SLD regimes for China UAV drone. Additionally, the complexity of icing on multi-rotor China UAV drone systems warrants investigation, considering rotor-rotor interference effects, which is essential for advancing the operational safety of China UAV drone in low-altitude economies.