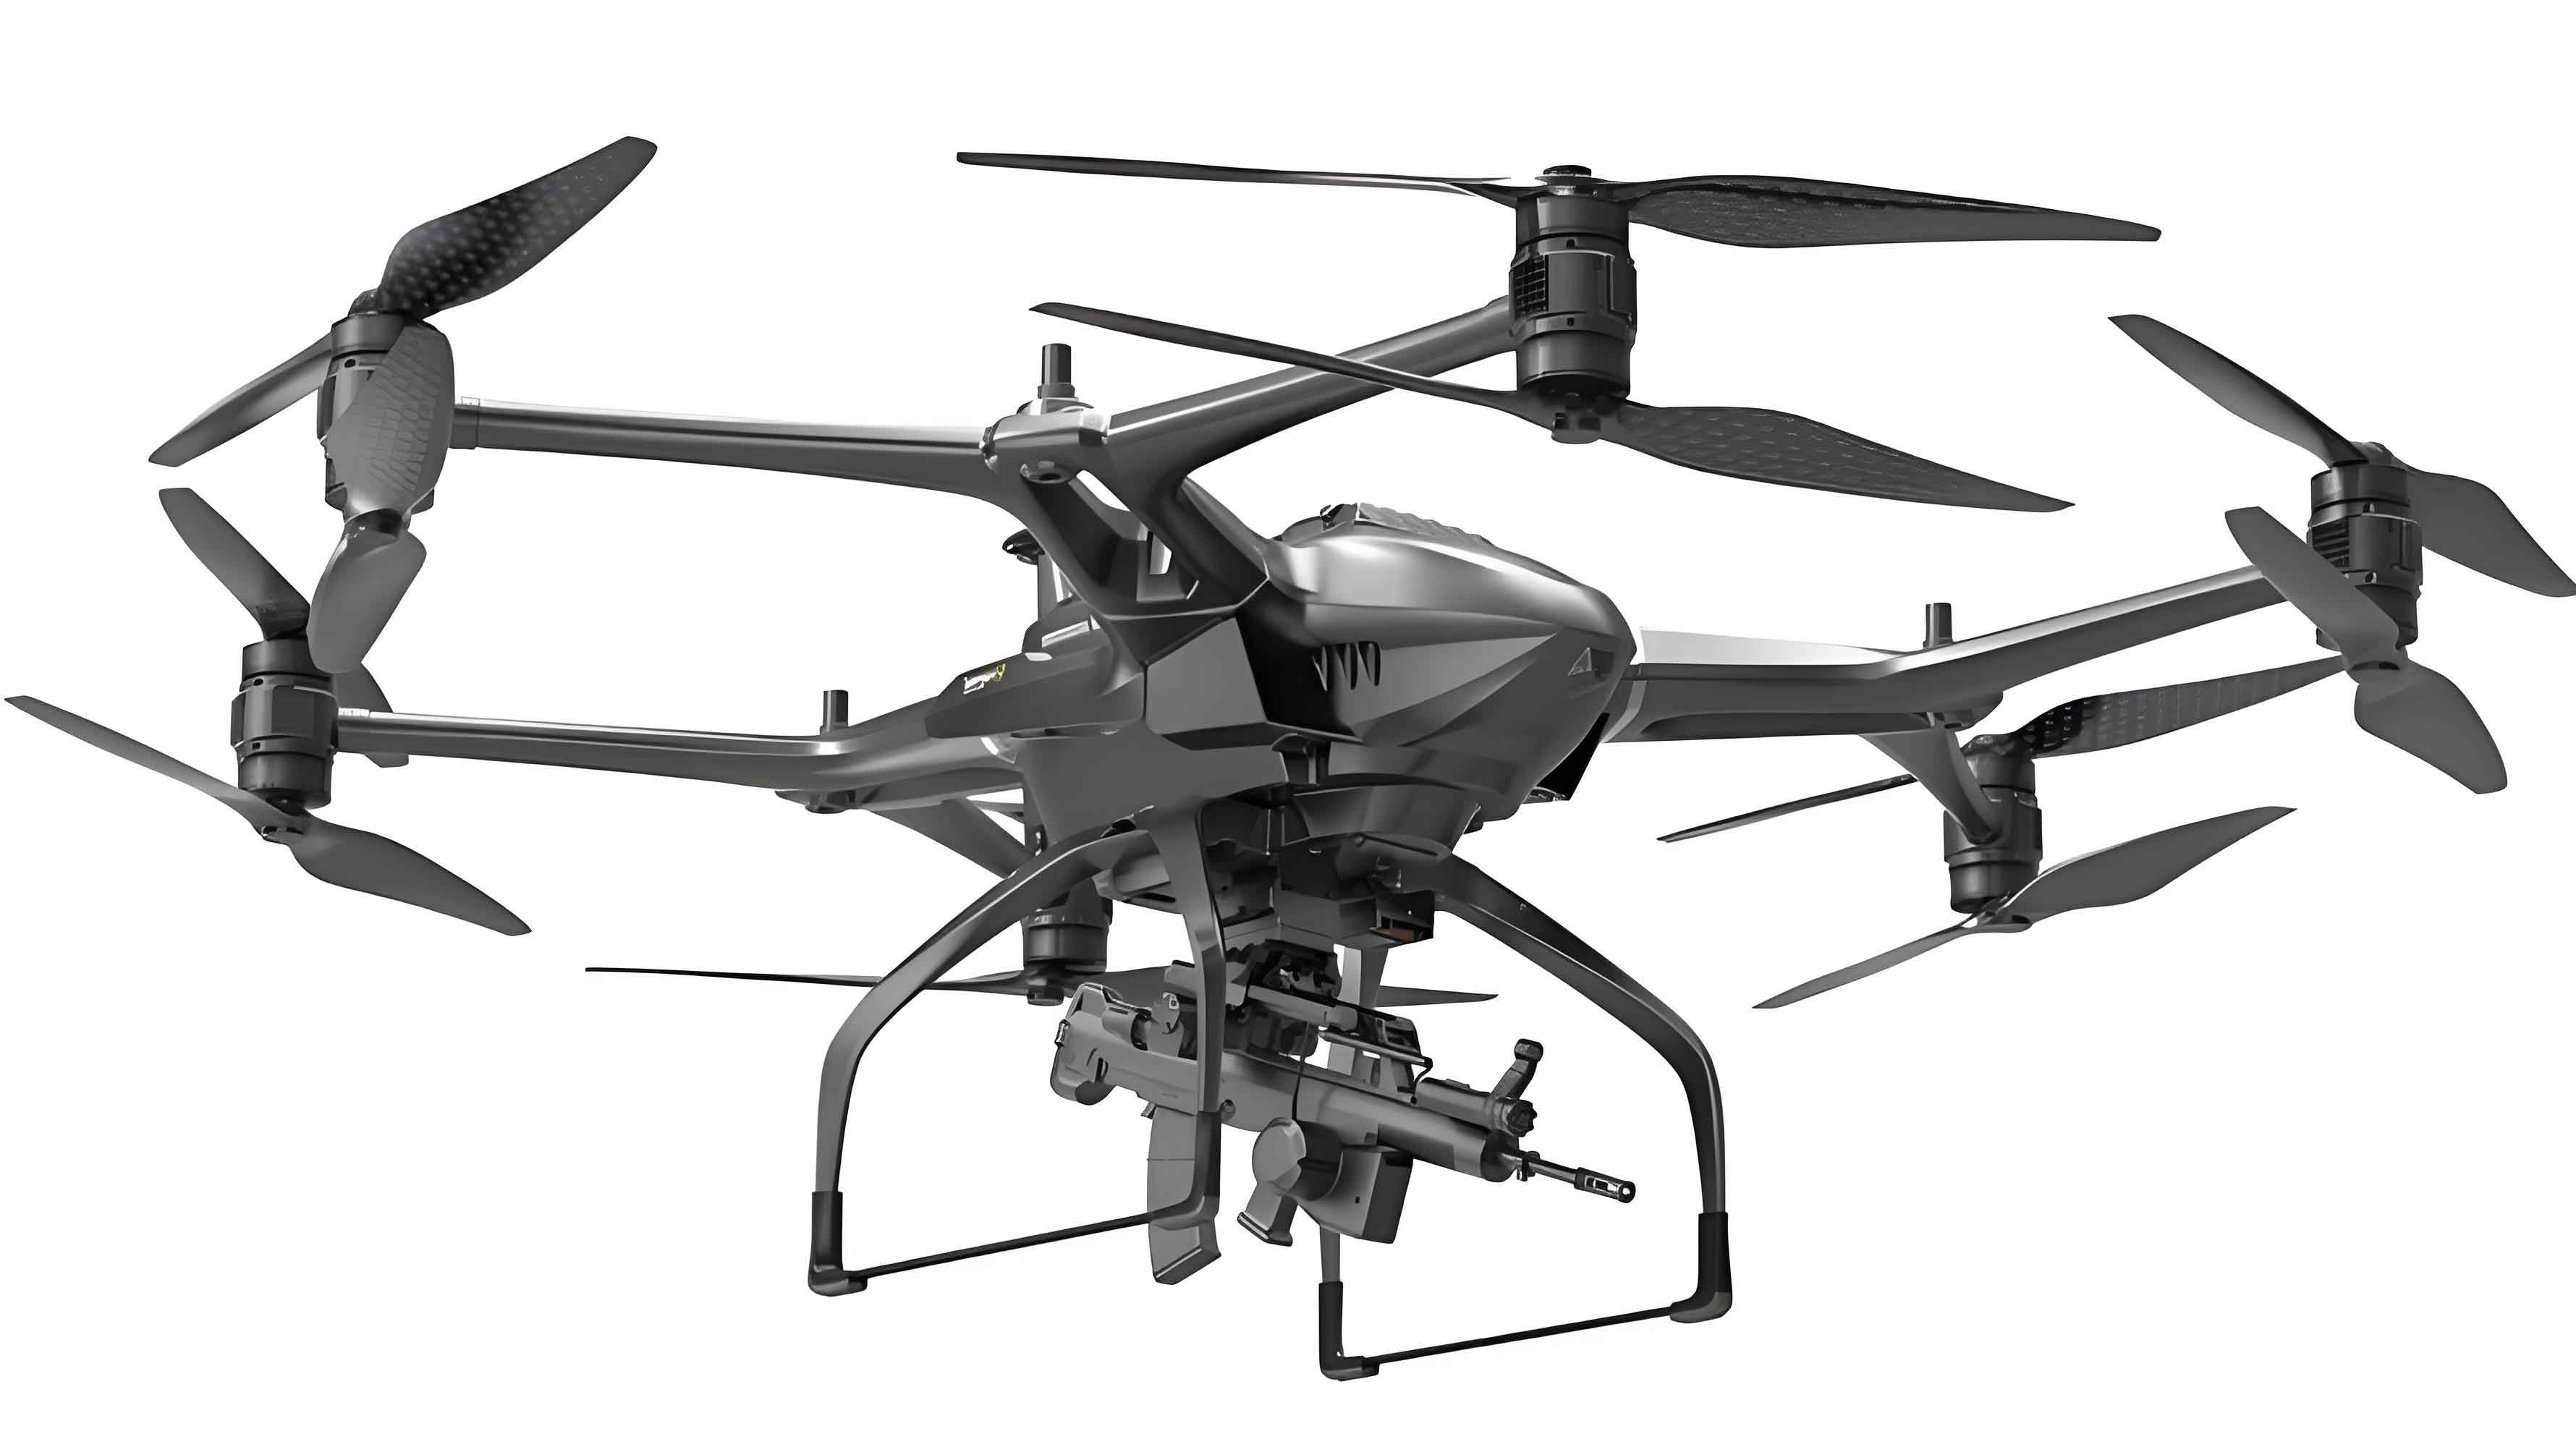
The proliferation of military drones (UAVs) has transformed contemporary warfare, particularly in global security hotspots like the Middle East. This analysis examines military drone usage patterns through a typological framework based on conflict phase and air superiority, supported by empirical evidence from recent Middle Eastern conflicts.

Theoretical Framework: Military UAV Deployment Typology
Military UAV usage patterns are determined by two critical dimensions: conflict phase (competition vs. conflict) and air superiority distribution. This generates four distinct operational environments:
| Type | Conflict Phase | Air Superiority | System Vulnerability | Casualty Risk |
|---|---|---|---|---|
| 1 | Competition | Undefined | Low | Low |
| 2 | Conflict | Attacker Dominant | Low | High |
| 3 | Conflict | Defender Dominant | High | Low |
| 4 | Conflict | Parity | High | High |
The casualty probability function for military drone operations follows:
$$P_c = \frac{1}{1 + e^{-(0.7A_s + 0.4T_q – 0.3D_c)}}$$
Where:
$A_s$ = Air superiority advantage (0-1 scale),
$T_q$ = Military UAV technical capability (0-1 scale),
$D_c$ = Defender counter-UAV capacity (0-1 scale)
Operational Patterns and Security Impacts
Type 1: Competition Phase (US-Iran Drone Confrontation)
In pre-conflict scenarios, military UAVs primarily conduct reconnaissance with minimal casualties. The 2019 US-Iran standoff exemplifies this pattern:
| Incident | Military UAV Type | Outcome | Conflict Escalation |
|---|---|---|---|
| RQ-4 Shootdown | HALE Surveillance | Political signaling | None |
| Iranian UAV Intercept | Tactical UAV | System denial | None |
The confrontation frequency model shows:
$$F_c = N_{uav} \times (0.6P_p + 0.3T_d)$$
Where $N_{uav}$ = UAV deployment frequency, $P_p$ = Political provocation index, $T_d$ = Technical detectability
Type 2: Attacker Air Superiority (Nagorno-Karabakh Conflict)
When military UAV operators possess air dominance, they achieve disproportionate effects:
Azerbaijan’s drone offensive against Armenia demonstrated:
- 92% successful engagement rate of armored vehicles
- 78% reduction in conflict duration compared to conventional warfare
- 3:1 attrition ratio against air defense systems
The operational efficiency equation:
$$E_o = \frac{K_d \times A_a}{L_{uav} \times C_{sortie}}$$
$K_d$ = Kill density per sortie, $A_a$ = Airspace access coefficient, $L_{uav}$ = UAV loss rate, $C_{sortie}$ = Sortie cost
Type 3: Defender Air Superiority (Houthi-Saudi Conflict)
Non-state actors using military drones against superior forces exhibit distinct patterns:
| Year | Houthi UAV Attacks | Interception Rate | Significant Damage |
|---|---|---|---|
| 2019 | 18 | 67% | 1 incident |
| 2021 | 32 | 89% | 0 incidents |
The asymmetric effectiveness model:
$$E_a = 0.25 \times \left(1 – \frac{C_{ads}}{T_{uav}}\right) \times S_v$$
$C_{ads}$ = Counter-UAV defense strength, $T_{uav}$ = UAV technical sophistication, $S_v$ = Symbolic value coefficient
Type 4: Air Parity (Libyan Civil War)
When air forces are balanced, military drones become attrition assets:
- 850+ UAV sorties by LNA forces (2019)
- 73% drone loss rate within first deployment month
- 1.2:1 exchange ratio between Bayraktar TB2 vs Wing Loong systems
The attrition dynamics follow:
$$A_t = \frac{D_d \times R_r}{C_{rep} \times S_c}$$
$D_d$ = Daily drone deployment, $R_r$ = Replacement rate, $C_{rep}$ = Repair capacity, $S_c$ = Supply chain resilience
Security Impact Analysis
Military UAV operations consistently demonstrate two security effects across conflict types:
Frequency Amplification:
The conflict event frequency increases proportionally to UAV deployment density:
$$F_i = \alpha + \beta_1 U_d + \beta_2 T_c + \epsilon$$
Where $U_d$ = Military drone density (per 1000 km²), $T_c$ = Technical accessibility index (0-1)
Intensity Containment:
Military drone operations rarely trigger escalatory spirals due to:
- Absence of pilot casualties reducing escalation pressure
- High technical absorptivity of drone losses
- Political deniability mechanisms
The escalation risk model shows:
$$E_r = 0.3P_h \times C_s – 0.7D_t$$
$P_h$ = Human casualty probability, $C_s$ = Strategic value, $D_t$ = Drone technical value
Technological Diffusion Implications
Military drone capabilities follow an accessibility progression:
$$A_c(t) = A_0 e^{kt} \times \frac{1}{1 + e^{-(C_p – C_t)}}$$
$A_0$ = Initial accessibility, $k$ = Technology diffusion constant, $C_p$ = Production cost, $C_t$ = Technical threshold
| Capability Tier | Military UAV Examples | Adoption Timeframe | Conflict Impact |
|---|---|---|---|
| Reconnaissance | Commercial derivatives | 1-2 years | Type 1/3 |
| Precision Strike | TB2, Wing Loong | 3-5 years | Type 2/4 |
| Integrated Swarms | Loitering munitions | 5-7 years | All types |
Conclusion
Military drone deployment exhibits predictable patterns based on conflict phase and air superiority dynamics. The consistent security outcome across all operational environments is increased conflict frequency without corresponding intensity escalation, governed by the fundamental relationship:
$$\Delta S = \gamma F_u – \delta I_c$$
Where $\Delta S$ = Security environment change, $F_u$ = UAV deployment frequency, $I_c$ = Intensity change factor, with $\gamma > \delta$ in all observed cases. This dynamic positions military UAVs as persistent conflict enablers rather than decisive war-winning systems in contemporary warfare.
