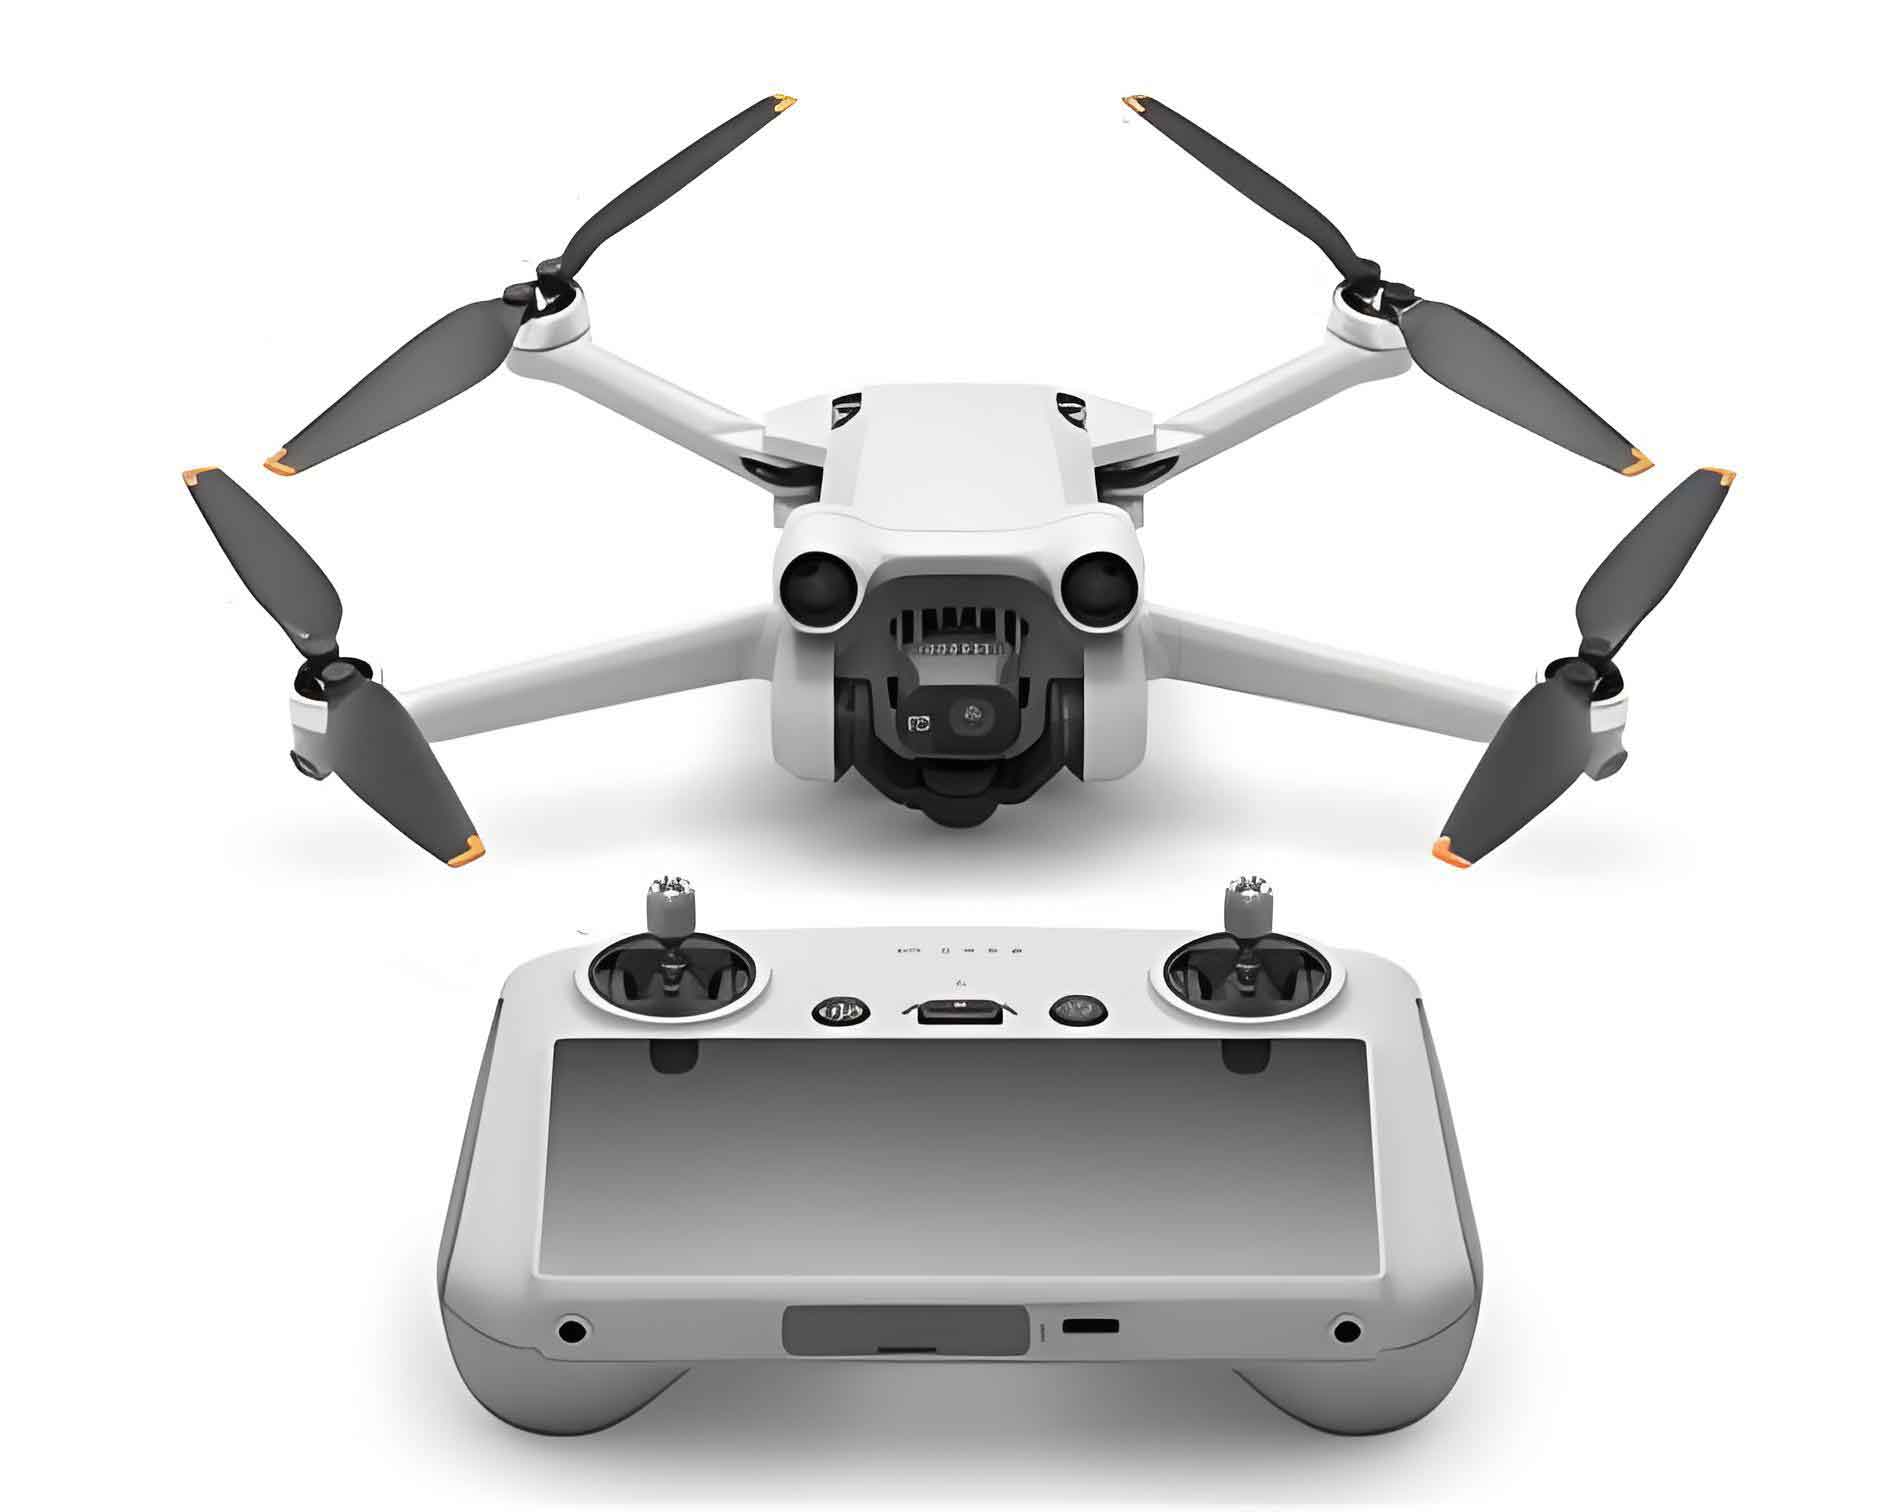
We present a comprehensive investigation into the spatial distribution patterns of pine wilt disease (PWD) mortality across 3,500 hectares of mixed coniferous-broadleaf forests using fixed-wing camera drone technology. Our methodology employed a fixed-wing camera UAV (Xiangyu-I model) equipped with a 36.35-megapixel full-frame CMOS sensor camera (Nikon D810), capturing aerial imagery at 480m altitude with 12.5 cm/pixel resolution. Flight operations covered 4,200 ha within a single day (9:30-15:30), demonstrating the efficiency of camera UAV systems for large-scale forest health monitoring.

Data processing utilized Pix4Dmapper for orthomosaic generation, eCognition for segmentation and classification (scale parameter=30, shape=0.1, compactness=0.7), and ArcGIS for spatial analysis. We established 92 contiguous sample plots (500×500m) across three townships, extracting terrain factors (elevation, aspect, slope position) and dead tree locations. Spatial distribution was quantified using six aggregation indices:
Spatial Distribution Metrics:
- Diffusion coefficient: $$ C = \frac{S^2}{\bar{x}} $$
- Negative binomial index: $$ K = \frac{\bar{x}^2}{S^2 – \bar{x}} $$
- Cassie index: $$ CA = \frac{1}{K} $$
- Clumping index: $$ I = \frac{S^2}{\bar{x}} – 1 $$
- Aggregation index: $$ \frac{m^*}{m} = 1 + \frac{1}{K} $$
Where \( S^2 \) = variance of dead tree frequency and \( \bar{x} \) = mean frequency.
| UAV Parameter | Value |
|---|---|
| Wingspan | 3.3m |
| Cruise Speed | 80 km/h |
| Maximum Endurance | 2 hours |
| Coverage per Sortie | 1,400 ha |
| Camera Specification | Parameter |
|---|---|
| Sensor Resolution | 36.35 MP |
| Image Resolution | 7,360 × 4,912 px |
| Overlap | 75% (along-track), 65% (cross-track) |
The camera drone survey identified 5,794 dead trees across all sites. Spatial analysis confirmed aggregated distribution patterns (p < 0.05) through multiple indices:
| Location | Mean | C | K | CA |
|---|---|---|---|---|
| Site A | 103.08 | 102.36 | 1.02 | 0.98 |
| Site B | 52.10 | 31.80 | 1.69 | 0.59 |
| Site C | 26.96 | 20.92 | 1.35 | 0.74 |
Sampling efficiency analysis revealed the five-point method as statistically optimal for mortality estimation:
| Sampling Method | Mortality (%) | SD |
|---|---|---|
| Double Diagonal | 0.54 ± 0.001 | 0.00255 |
| Parallel Transect | 0.35 ± 0.001 | 0.00232 |
| Z-Pattern | 0.48 ± 0.001 | 0.00262 |
| Five-Point | 0.85 ± 0.002 | 0.00659 |
Terrain significantly influenced mortality distribution. Camera UAV data revealed elevation-specific patterns described by:
$$ f(h) = \frac{1}{\sigma\sqrt{2\pi}} e^{-\frac{(h-\mu)^2}{2\sigma^2}} $$
where \( h \) = elevation and \( \mu \) = optimal elevation (300-350m).
| Terrain Factor | Mortality Concentration |
|---|---|
| Aspect | West (25.94%), South (23.57%) |
| Slope Orientation | Semi-sunny (36.54%), Sunny (34.09%) |
| Elevation | 300-350m (30.43%), 250-300m (21.83%) |
Disease progression altered distribution patterns. Initial outbreaks concentrated on convex slopes (51.72% in low-mortality stands), while advanced infections shifted to concave slopes (76.75% in high-mortality stands). This camera drone-based analysis demonstrated several operational advantages:
- Cost efficiency: 68% reduction versus ground surveys
- Temporal efficiency: 3,500 ha coverage in <6 hours
- Precision: 92% detection accuracy after manual verification
The fixed-wing camera UAV platform enabled statistically robust terrain-mortality modeling unattainable through conventional methods. Our elevation distribution model explains 78% of mortality variance (\( R^2 = 0.78 \)), while aspect and slope position models achieved \( R^2 = 0.65 \) and \( R^2 = 0.71 \) respectively. Future camera drone deployments should incorporate temporal analysis to track spatiotemporal progression vectors described by:
$$ \vec{v} = \frac{\Delta \vec{x}}{\Delta t} $$
where \( \vec{x} \) = spatial mortality gradient.
This research establishes camera UAV technology as essential for precision forest pathology. The methodology provides actionable intelligence for targeted management, particularly in mountainous terrain where traditional monitoring proves impractical. Future studies should integrate LiDAR with camera drone multispectral sensors to quantify host density effects on observed distribution patterns.
