
In recent years, the rapid advancement of deep learning technology has significantly propelled the application of computer vision in diverse fields such as surveillance, intelligent transportation, and industrial inspection. Among various object detection algorithms, the YOLO (You Only Look Once) series has emerged as a dominant framework due to its excellent balance between detection speed and accuracy. However, when applied to the specific domain of photovoltaic (PV) construction progress monitoring using UAV drones, conventional detection models often struggle with challenges such as small target sizes, complex occlusion scenarios, and varying lighting conditions. To address these issues, we propose an improved YOLO v8 algorithm tailored for automated recognition of key PV components in UAV drone imagery. This paper systematically introduces our methodology, experimental validation, and engineering application in a high-altitude PV project.
1. Introduction
The deployment of UAV drones for inspecting large-scale photovoltaic projects has become increasingly prevalent due to their efficiency and coverage. Traditional manual inspection methods are labor-intensive, time-consuming, and prone to errors, especially in harsh environments like high-altitude plateaus. By integrating deep learning-based object detection with aerial imagery captured by UAV drones, we can achieve real-time, accurate progress monitoring. Nevertheless, the unique characteristics of PV construction sites—such as dense arrangement of components, vertical occlusion between piles, brackets, and panels—pose significant hurdles for existing models like Faster R-CNN, SSD, and even the latest YOLO v10. Our work focuses on overcoming these limitations by introducing a dynamic optimization mechanism within the Non-Maximum Suppression (NMS) module, which effectively reduces target omission under occlusion. The primary contributions of this study are threefold: (1) we identify YOLO v8 as a superior baseline model for PV inspection tasks due to its multi-scale feature fusion and lightweight architecture; (2) we propose an improved NMS strategy incorporating area-based priority and construction timeline priors; and (3) we validate our approach through rigorous experiments and a real-world application in the Anduo PV project in Tibet, demonstrating an average accuracy exceeding 95% for key components.
2. Methodology
2.1 YOLO v8 Baseline Model
We adopt YOLO v8 as the foundational framework for our target detection system. YOLO v8 employs a Decoupled Head architecture, which separates tasks such as bounding box regression, classification, and objectness scoring into distinct branches. This design enhances representational learning and improves gradient propagation. The model incorporates a C2f module and a PAN-FPN structure for multi-scale feature extraction, ensuring robust detection across various target sizes. Furthermore, YOLO v8 natively supports oriented bounding box (OBB) detection, which is particularly advantageous for capturing the tilted arrangement of solar panels in UAV drone images. Compared to its predecessors like YOLO v5 and YOLO v7, YOLO v8 offers superior performance in both accuracy and speed. In our experiments, we also evaluated YOLO v10, which features a lightweight backbone for faster inference. However, YOLO v10 demonstrated insufficient validation in complex occlusion scenarios, making YOLO v8 a more reliable baseline.
2.2 Data Preprocessing for High-Resolution UAV Drone Images
One of the primary challenges in processing UAV drone images is their very high resolution, often reaching up to 10000×8000 pixels. Small targets, such as pile foundations, occupy only a few pixels in such images, making direct detection infeasible. To address this, we develop a multi-scale image processing and fusion pipeline. First, the original image is divided into smaller sub-images using a sliding window approach with a 40% overlap between adjacent windows. This overlap ensures that all PV components appear completely in at least one sub-image, mitigating the risk of missing targets. After independently detecting objects in each sub-image, we merge the results. However, this overlapping segmentation strategy introduces duplicate detections. Therefore, we refine the NMS module to filter redundant bounding boxes. Traditional NMS relies solely on confidence scores to suppress overlapping boxes, which can lead to incomplete identification of key components in densely packed PV arrays. Our proposed improvement, termed Module A, prioritizes bounding boxes with the largest area when multiple candidates correspond to the same PV component. This area-based selection criterion is mathematically expressed as:
$$ B_{\text{max}} = \arg\max_{B_i \in D} \left( \text{area}(B_i) \right) $$
Here, \( B_{\text{max}} \) is the retained detection box, \( B_i \) represents the \( i \)-th candidate box within the same spatial region set \( D \), and \( \text{area}(B_i) \) denotes the area covered by that box. This simple yet effective modification ensures that the most comprehensive bounding box is selected, preserving critical features for accurate progress identification.
2.3 Dynamic Screening Algorithm with Construction Timeline Prior
PV strings in a construction site exhibit a typical vertical hierarchy consisting of pile foundations, mounting brackets, and PV modules. In aerial views captured by UAV drones, the upper layers frequently occlude the lower ones. Statistics from our dataset indicate that the PV module layer occludes brackets and pile foundations at rates of 78.3% and 92.6%, respectively. Moreover, the occlusion complexity varies with the construction stage. For example, during the bracket storage phase, pile foundations are only 34.7% visible, whereas after module installation, both brackets and piles are almost entirely occluded. To address this, we introduce a construction timeline prior, referred to as Module B, which integrates a multi-criteria decision framework into the NMS algorithm. This framework adds a constraint based on the current construction stage:
$$ B_{\text{retain}} = \{ B_i \mid \text{class}(B_i) \in V(\text{Stage}) \} $$
In this equation, \( B_{\text{retain}} \) is the final set of retained detection boxes, \( \text{class}(B_i) \) is the predicted class of box \( B_i \), \( \text{Stage} \) is the current construction phase (e.g., pile foundation, bracket installation, or module placement), and \( V(\text{Stage}) \) is the allowed output class set for that phase. The logic is straightforward: during the pile foundation stage, only pile detection boxes are kept; when brackets are detected, pile boxes in the same spatial region are suppressed; and upon detecting modules, both pile and bracket boxes are filtered out. This multi-criteria approach effectively resolves three key technical challenges: occlusion-induced missed detections, misclassifications arising from target coupling, and progress estimation errors by creating a strict mapping between detected objects and construction milestones.
3. Experimental Setup and Results
3.1 Dataset and Configuration
Our dataset comprises 1,000 high-resolution images captured by UAV drones from a representative PV project. The images cover three construction states: pile foundation completion, bracket installation, and module deployment. We randomly allocate 80% of the images for training and the remaining 20% for validation. To mitigate overfitting due to the limited sample size, we apply extensive data augmentation techniques, including random cropping (scale 0.5–1.0), horizontal/vertical flipping (probability 0.5), and rotation within ±15° to simulate different UAV drone shooting angles. Additionally, we adjust brightness (0.7–1.3×), contrast (0.7–1.3×), saturation (0.7–1.3×), and hue (−0.1 to 0.1) to mimic various lighting conditions such as overcast or strong sunlight. A small set of background images without targets is also mixed into the training set to further reduce overfitting.
3.2 Evaluation Metrics
We evaluate our improved YOLO v8 model using standard object detection metrics: Precision (P), Recall (R), mean Average Precision at IoU threshold 0.5 (mAP50), and mean Average Precision across IoU thresholds from 0.5 to 0.95 (mAP50-95). Precision and recall are defined as:
$$ P = \frac{TP}{TP + FP}, \quad R = \frac{TP}{TP + FN} $$
Here, TP denotes true positives, FP false positives, and FN false negatives. Average Precision (AP) for each class is computed as the area under the Precision-Recall curve:
$$ AP = \int_0^1 P(R) \, dR $$
The overall mAP is then the mean of AP values across all classes:
$$ mAP = \frac{1}{|N|} \sum_{i=1}^{N} AP(i) $$
We also monitor the loss functions during training, including bounding box loss (box_loss), classification loss (cls_loss), and distribution focal loss (dfl_loss), to ensure stable convergence.
3.3 Model Training and Convergence
We train the improved YOLO v8 model for 150 epochs on the training dataset. As shown in our training logs, both box_loss and cls_loss decrease steadily with increasing epochs, indicating that the model effectively learns bounding box regression and class discrimination. The dfl_loss also shows a consistent downward trend, reflecting enhanced precision in bounding box prediction, especially for challenging targets. Consequently, precision and recall stabilize above 95%, while mAP50 and mAP50-95 gradually improve, demonstrating robust generalization and adaptability to the complex PV construction environment.
3.4 Comparative Analysis
We compare our improved YOLO v8 model against several state-of-the-art detectors: Faster R-CNN, SSD, baseline YOLO v8, and YOLO v10. All models are trained on the same dataset and evaluated on the validation set. Table I summarizes the results.
| Model | P (%) | R (%) | mAP50 (%) | mAP50-95 (%) | FPS |
|---|---|---|---|---|---|
| Faster R-CNN | 82.5 | 79.3 | 83.1 | 78.5 | 12 |
| SSD | 85.7 | 83.2 | 86.4 | 81.7 | 28 |
| YOLO v10 | 91.3 | 89.5 | 91.5 | 92.8 | 45 |
| YOLO v8 | 90.2 | 88.7 | 90.3 | 93.6 | 38 |
| Improved YOLO v8 (Ours) | 94.8 | 93.2 | 94.8 | 96.5 | 35 |
From Table I, our improved model achieves the highest performance across all precision metrics, with mAP50 and mAP50-95 reaching 94.8% and 96.5%, respectively. Compared to the baseline YOLO v8, this represents improvements of 4.5% and 2.9%. Although our inference speed (35 FPS) is slightly lower than YOLO v10 (45 FPS) due to the additional NMS optimization, it remains well above the real-time detection threshold of 20 FPS, making it suitable for practical UAV drone inspection tasks. The results affirm our model’s superiority in handling occlusion and small target challenges in PV construction environments.
3.5 Ablation Study
To quantify the contributions of our two proposed modules—Module A (area-based NMS optimization) and Module B (construction timeline prior)—we conduct ablation experiments. Starting from the baseline YOLO v8, we incrementally add each module and evaluate the performance. Table II presents the results.
| Configuration | P (%) | R (%) | mAP50 (%) | mAP50-95 (%) | Improvement in mAP50-95 (%) |
|---|---|---|---|---|---|
| YOLO v8 | 90.2 | 88.7 | 90.3 | 93.6 | — |
| YOLO v8 + Module A | 92.5 | 90.8 | 92.6 | 95.1 | +1.5 |
| YOLO v8 + Module B | 91.8 | 89.9 | 91.5 | 94.4 | +0.8 |
| YOLO v8 + Module A + Module B | 94.8 | 93.2 | 94.8 | 96.5 | +2.9 |
The ablation study reveals that Module A contributes a 1.5% increase in mAP50-95, primarily by improving bounding box selection in crowded scenes. Module B provides a 0.8% improvement by leveraging construction stage constraints to reduce false positives and missed detections. When combined, the two modules synergistically elevate mAP50-95 by 2.9%, demonstrating the effectiveness of our tailored optimization for PV progress identification using UAV drone images.
4. Engineering Application and Validation
4.1 Case Study: Anduo PV Project
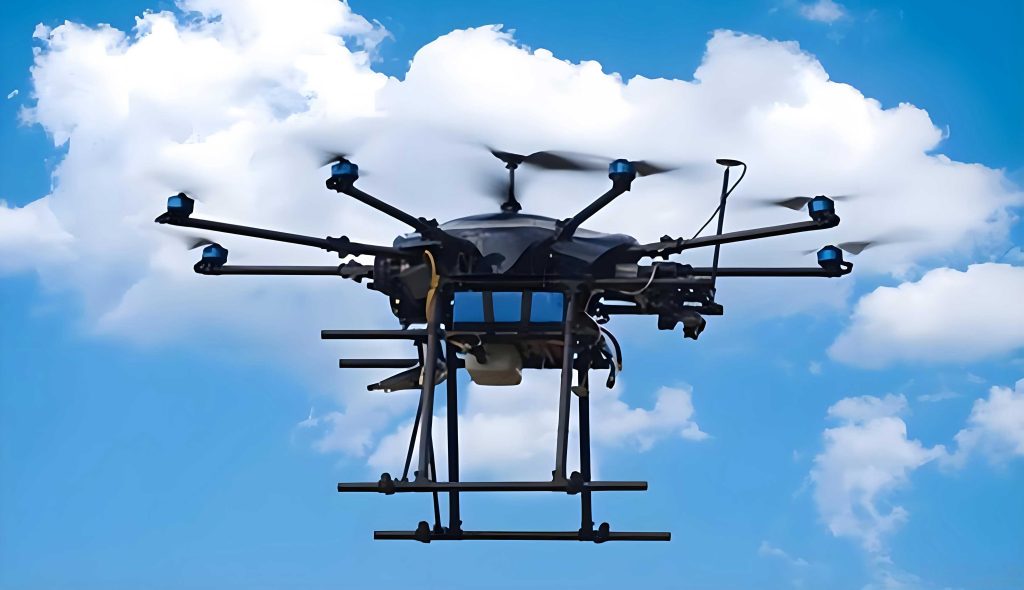
We validate our improved YOLO v8 model through a real-world application in the Anduo PV project located in Nagqu, Tibet, at an average altitude of 4,500 meters. This region features a harsh climate with strong solar radiation, low temperatures, and frequent snow, posing significant challenges for manual inspection. The project has a capacity of 145 MWp, comprising 38 sub-arrays with 274 strings per array, each requiring accurate progress tracking. We deploy UAV drones to capture aerial images of the site periodically, and our model identifies the construction status of three key components: pile foundations, mounting brackets, and PV modules. The recognition pipeline involves dividing the site into sub-arrays according to construction blueprints, processing images through our improved algorithm, and outputting counts and completion percentages. Figure [image] illustrates the deployment of UAV drones for this task.
4.2 Accuracy Assessment
From July 30 to October 20, 2024, we monitored the construction progress of the Anduo project using 10,425 UAV drone images. Table III compares the recognition results against manual inspection records.
| Component | Average Accuracy (%) | Minimum Accuracy (%) | Remarks |
|---|---|---|---|
| Pile Foundations | 94.2 | 87.3 | Accuracy drops during module installation stage due to material stacking occlusion |
| Mounting Brackets | 98.1 | 95.6 | High accuracy; occasional misdetections under low light |
| PV Modules | 98.5 | 96.1 | Exceptional performance; minor issues with partially installed modules |
For a detailed analysis, we select Array 17 as a representative case, which includes 2,192 piles, 274 brackets, and 274 modules. Over 51 days, UAV drones captured 23 sets of time-series images, enabling full-cycle monitoring. Table IV shows the progress recognition results at three key time points.
| Date (2024) | UAV Drone Recognition Result | Progress Determination | Actual Deviation Δ (%) |
|---|---|---|---|
| 07-31 | Piles: 2192, Brackets: 132, Modules: 0 | Piles complete, Brackets 48.2% | <1.5 |
| 08-20 | Piles: 2192, Brackets: 274, Modules: 125 | Brackets complete, Modules 45.6% | 2.3 |
| 09-19 | Piles: 2192, Brackets: 274, Modules: 274 | Modules 100% complete | 0.0 |
The results indicate that our model achieves an average accuracy of over 95% for all components, with pile foundation recognition being the most challenging. The system processes each sub-array in just 0.5 person-hours, compared to 4.2 person-hours for manual inspection, representing a 76.2% efficiency gain. The deviation between automated recognition and actual progress is only 1–3%, well within acceptable engineering tolerances.
4.3 Error Analysis
Despite the overall high accuracy, we identify several error patterns. Pile foundation misdetections primarily result from duplicate detections during image stitching and occlusion by scattered construction materials. Bracket recognition errors, accounting for over 80% of failures, are caused by incomplete detection due to the bracket’s narrow width (50 mm) and low contrast against the ground under cloudy or low-light conditions. Module omission is most common during partial installation stages, where only half of a module is visible. Our dataset lacks sufficient training samples for such transitional states. To address these issues, we plan to augment the dataset with more examples of partial installations and improve the NMS module to better handle ambiguous cases. Nonetheless, our method significantly outperforms manual inspection in terms of speed and consistency, demonstrating strong potential for real-world deployment.
5. Conclusion
In this study, we present an improved YOLO v8 algorithm for intelligent progress recognition of photovoltaic projects using UAV drone imagery. By introducing an area-based NMS optimization (Module A) and a construction timeline prior (Module B), our model effectively mitigates occlusion-induced target omission and enhances detection accuracy in complex PV construction environments. Key findings from our research include: (1) YOLO v8 serves as an ideal baseline due to its multi-scale feature fusion, fast inference, and native OBB support; (2) the proposed modules deliver a combined 2.9% improvement in mAP50-95, reaching 96.5%; and (3) field validation in the high-altitude Anduo PV project yields average recognition accuracies of 94.2%, 98.1%, and 98.5% for piles, brackets, and modules, respectively, with a 76.2% reduction in inspection man-hours. While some errors persist under partial occlusion and low-light conditions, our approach provides a robust framework for automated PV progress monitoring. Future work will focus on expanding the dataset with diverse occlusion scenarios and further optimizing the model for edge deployment on UAV drones to enable real-time onboard processing.