In this work, we present a comprehensive study on the intelligent inspection of hot spot defects in photovoltaic power stations using UAV drone infrared vision technology. The proposed system integrates deep learning based object detection with unmanned aerial vehicle platforms to achieve real-time, accurate, and reliable hot spot identification and severity assessment. We first establish a coupled relationship model linking infrared image color features, temperature ranges, and defect severity levels. To enhance detection accuracy for small and blurred targets captured by UAV drones, we propose a hybrid intensive YOLO architecture named MI-YOLO, which incorporates multi-scale feature enhancement and spatial pyramid pooling at multiple resolution levels. A complete UAV drone inspection scheme is designed, including flight path planning, real-time kinematic positioning, and adaptive image acquisition. Extensive experiments are conducted to evaluate the proposed method under various conditions, including different activation functions, image resolutions, illumination variations, and false target scenarios. The results demonstrate that our MI-YOLO with hybrid activation achieves superior performance in terms of precision, recall, mAP, and F1 score, while maintaining real-time inference capability suitable for UAV drone deployment.
1. Introduction
Photovoltaic modules are widely deployed in large-scale solar power plants to convert solar energy into electricity. However, during actual operation, these modules are frequently affected by non-transparent obstructions such as sand, dust, bird droppings, and fallen leaves. These obstructions cause localized overheating of solar cells, leading to the well-known “hot spot effect”. Hot spot defects not only reduce the power generation efficiency of photovoltaic modules but also accelerate their degradation and may even cause fire hazards in severe cases. Traditional manual inspection methods rely on visual observation or handheld thermal cameras, which are labor-intensive, inefficient, and often fail to detect early-stage hot spots in a timely manner.
With the rapid advancement of unmanned aerial vehicle technology, UAV drones have emerged as a powerful platform for photovoltaic power station inspection. Equipped with high-resolution infrared thermal cameras, UAV drones can capture thermal images of large photovoltaic arrays from a low altitude with high spatial resolution and temporal flexibility. The combination of UAV drone mobility and infrared thermography enables efficient, contactless, and large-scale hot spot detection. However, the images acquired by UAV drones often exhibit characteristics such as small target size, blurred boundaries, and complex background interference, which pose challenges for accurate hot spot detection and classification.
In recent years, deep learning based object detection methods have achieved remarkable success in various defect detection tasks. Among these, the YOLO family of models stands out for its excellent balance between detection accuracy and inference speed, making it particularly suitable for real-time applications on UAV drone platforms. Nevertheless, standard YOLO architectures may not perform optimally for small and subtle hot spot defects in infrared images due to insufficient shallow feature exploitation and limited multi-scale contextual information.
To address these challenges, we propose a novel hot spot intelligent inspection framework that integrates UAV drone infrared imaging with an enhanced YOLO-based detection model. The main contributions of this work are summarized as follows:
First, we analyze the thermal characteristics of photovoltaic hot spots and establish a coupled relationship model that maps infrared image color representations to temperature ranges and defect severity levels. This model provides a direct and intuitive basis for hot spot assessment.
Second, we propose MI-YOLO, a hybrid intensive YOLO architecture that incorporates three key improvements: enhanced shallow feature extraction using multi-layer convolution, deepened spatial pyramid pooling modules, and multi-scale SPP insertion at multiple feature levels. These enhancements significantly improve the detection accuracy for small and ambiguous hot spot targets.
Third, we design a complete UAV drone intelligent inspection scheme, including low-altitude S-shaped flight path planning, camera angle optimization based on panel tilt, and centimeter-level RTK positioning for accurate hot spot localization.
Fourth, we conduct comprehensive experiments to evaluate the proposed method under various operational conditions, including different activation functions, image resolutions, illumination levels, and false target scenarios. The results demonstrate the robustness and effectiveness of our approach for real-world photovoltaic power station inspection.
The remainder of this paper is organized as follows. Section 2 presents the coupled relationship model of hot spot image, temperature, and severity. Section 3 describes the proposed MI-YOLO detection method in detail. Section 4 presents the design of the UAV drone intelligent inspection system. Section 5 reports and discusses the experimental results. Finally, Section 6 concludes the paper with a summary of findings and future research directions.
2. Coupled Relationship Model of Hot Spot Image, Temperature, and Severity
Photovoltaic modules consist of multiple monocrystalline silicon cells connected in series. When non-transparent objects partially shade a module, the shaded cells cease to generate electricity and instead act as loads, consuming power from adjacent cells and generating heat. This localized heating creates a hot spot that can be detected using infrared thermal imaging. The severity of a hot spot defect depends on factors such as the size of the shaded area, the duration of shading, and the electrical characteristics of the affected cells.
To facilitate rapid and intuitive assessment of hot spot severity from infrared images, we establish a coupled relationship model that correlates the pseudocolor representation of thermal images with actual temperature ranges and corresponding defect severity levels. In our data acquisition process, raw infrared images are processed using pseudocolor mapping to enhance visual contrast between regions of different temperatures. This mapping assigns distinct colors to different temperature intervals, making hot spots more distinguishable from the background.
Through extensive analysis of infrared images captured by UAV drones under various operating conditions, we identify five representative hot spot color states: blue, green, yellow, red, and white. Each color corresponds to a specific temperature range and indicates a particular level of severity. The blue state corresponds to normal operating conditions with no significant temperature elevation. The green state indicates a warning level where slight temperature anomalies begin to appear. The yellow state represents a light hot spot condition that requires observation. The red state indicates a moderate hot spot that demands prompt attention. The white state corresponds to a severe hot spot with critically high temperatures requiring immediate intervention.
The coupled relationship between hot spot color, temperature, and severity is formally defined in Table 1. This model provides a direct mapping from visual features observed in infrared images to actionable maintenance decisions, enabling rapid screening and prioritization of defective modules during UAV drone inspection missions.
| Color State | Blue | Green | Yellow | Red | White |
|---|---|---|---|---|---|
| Temperature Range (°C) | < 28 | 28 – 33 | 33 – 35 | 35 – 40 | > 40 |
| Severity Level | None | Warning | Light | Moderate | Severe |
| Maintenance Action | No action | Monitor | Observe | Schedule repair | Immediate repair |
The temperature thresholds defined in Table 1 are derived from empirical measurements collected from multiple photovoltaic power stations under standard operating conditions. It is important to note that these thresholds may vary slightly depending on factors such as ambient temperature, solar irradiance, wind speed, and module type. However, the relative ordering and color correspondence remain consistent across different scenarios, providing a reliable basis for hot spot severity assessment.
By integrating this coupled relationship model into the detection pipeline, our UAV drone inspection system can not only identify the presence and location of hot spots but also automatically estimate their severity level based on the detected color features. This capability significantly enhances the intelligence level of photovoltaic power station operation and maintenance, allowing for data-driven decision-making and efficient resource allocation.
3. MI-YOLO: A Hybrid Intensive Object Detection Method for Hot Spot Detection
Infrared images captured by UAV drones often contain small, blurred, and low-contrast hot spot targets due to the relatively long imaging distance and atmospheric interference. To address these challenges, we propose MI-YOLO, a hybrid intensive YOLO architecture that builds upon the YOLOv4 framework with three key structural improvements. The goal is to enhance the model’s ability to extract and utilize shallow feature information, thereby improving detection accuracy for small hot spot defects while maintaining real-time inference speed suitable for UAV drone deployment.
3.1 Baseline Architecture: YOLOv4
YOLOv4 employs CSPDarknet53 as its backbone for feature extraction, which outputs three feature maps at different scales: 76×76, 38×38, and 19×19. These multi-scale feature maps are fed into a feature pyramid network with spatial pyramid pooling to achieve multi-scale object detection. While this design is effective for general object detection tasks, it exhibits limitations when applied to small target detection in infrared images due to insufficient shallow feature processing and limited contextual information at high-resolution levels.
In the original YOLOv4 architecture, the two high-resolution feature maps (76×76 and 38×38) are processed through only a single 1×1 convolutional layer for channel reduction before being passed to the detection head. This shallow processing restricts the model’s ability to capture fine-grained semantic information that is critical for small target detection. Meanwhile, the low-resolution feature map (19×19) is processed through a three-layer convolutional block before entering the SPP module, which provides reasonable feature abstraction but insufficient depth for complex background scenarios.
3.2 Enhancement of High-Resolution Feature Maps
To strengthen the feature extraction capability for high-resolution feature maps, we introduce a three-layer convolutional structure (1×1 → 3×3 → 1×1) to replace the original single 1×1 convolution on the 76×76 and 38×38 feature maps. The rationale behind this design is as follows:
The first 1×1 convolution performs channel compression to reduce computational complexity while retaining essential information. The subsequent 3×3 convolution expands the receptive field and enhances spatial relationship modeling, allowing the network to capture local contextual patterns that are crucial for distinguishing hot spots from background noise. The final 1×1 convolution integrates the extracted features and refines the semantic representation.
This three-layer structure significantly improves the model’s ability to perceive fine-grained details of small hot spot targets without introducing excessive computational overhead. The enhanced high-resolution feature maps provide richer semantic information for the subsequent detection head, leading to improved recall and precision for small and subtle defects.
3.3 Deepened Spatial Pyramid Pooling
The spatial pyramid pooling module in YOLOv4 applies max pooling operations at multiple scales (1×1, 5×5, 9×9, 13×13) to the 19×19 feature map, generating multi-scale contextual features that are concatenated to form a robust representation. However, the three-layer convolutional structure preceding the SPP module in the original design provides limited feature abstraction depth, which may not be sufficient for complex hot spot scenarios with varying background textures and temperature gradients.
We extend the convolutional block before the SPP module from three layers to five layers, following a symmetric structure of 1×1 → 3×3 → 1×1 → 3×3 → 1×1. This deepened structure introduces additional non-linear transformations that enhance the model’s ability to abstract high-level semantic features while maintaining computational efficiency through the alternating 1×1 and 3×3 convolution design. The additional 3×3 convolution layer further improves local context capture, while the extra 1×1 layers control parameter growth and mitigate overfitting risks.
3.4 Multi-Scale SPP Insertion
In the original YOLOv4 framework, the SPP module is only applied to the 19×19 feature map from the backbone network. This single-point insertion limits the multi-scale contextual information available to the high-resolution feature maps, potentially compromising their ability to detect small targets under varying background conditions.
To address this limitation, we extend the SPP module to the upsampled 38×38 and 76×76 feature map branches in the feature pyramid network. By introducing SPP at these higher resolution levels, the model can simultaneously capture fine-grained spatial details and multi-scale contextual information at each detection scale. This design significantly enhances the contextual awareness of shallow feature maps, improving their discriminative power for small hot spot detection.
The integration of SPP modules at multiple scales is achieved through parallel max pooling operations followed by concatenation, similar to the original SPP design. The multi-scale features are then fused with the original feature maps through element-wise addition or concatenation, producing enhanced representations that encode both local details and global context.
3.5 Hybrid Activation Function Strategy
Activation functions play a critical role in determining the representational capacity and training dynamics of deep neural networks. To further optimize the performance of MI-YOLO for hot spot detection, we investigate the use of a hybrid activation strategy that combines the strengths of different activation functions at different stages of the network.
We experiment with four activation function configurations: Mish (original), Swish, Leaky-ReLU, and a hybrid combination of Swish and Mish. The mathematical formulations of these activation functions are as follows:
The Mish activation function is defined as:
$$ Mish(x) = x \cdot \tanh(\ln(1 + e^{x})) $$
The Swish activation function is defined as:
$$ Swish(x) = x \cdot \frac{1}{1 + e^{-x}} $$
The Leaky-ReLU activation function is defined as:
$$ LeakyReLU(x) = \begin{cases} x & x \geq 0 \\ a \cdot x & x < 0 \end{cases} $$
where a is typically set to 0.01. In our hybrid activation strategy, we employ Swish in the shallow layers of the backbone network to accelerate convergence during early training stages, while Mish is used in the deeper residual modules to enhance feature modeling capability. This hybrid approach leverages the advantages of both activation functions, resulting in improved detection performance without additional computational cost.
4. Design of UAV Drone Intelligent Inspection System
The UAV drone intelligent inspection system is designed to achieve autonomous, efficient, and accurate hot spot detection in large-scale photovoltaic power stations. The system consists of four main components: the UAV drone platform, the infrared imaging payload, the flight control and navigation module, and the ground-based data processing and analysis station.
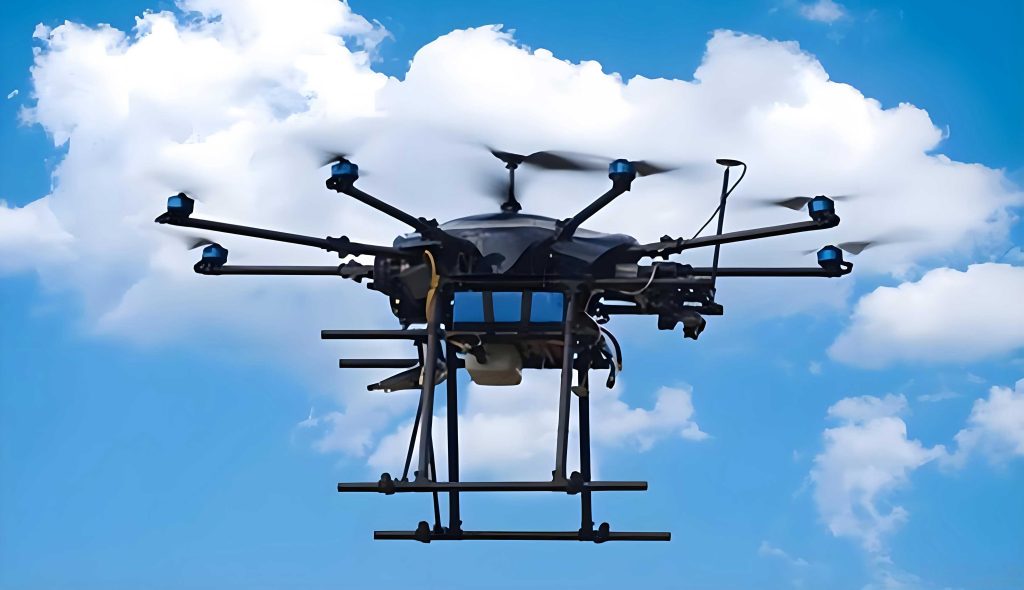
4.1 UAV Drone Platform and Payload
We select a quadcopter UAV drone platform with a maximum takeoff weight of 60 kg and a payload capacity of up to 50 kg. The platform is equipped with a high-resolution infrared thermal camera, a flight controller, a real-time kinematic positioning module, and a wireless video transmission system with a range of 15 km. The infrared camera operates in the long-wave infrared spectrum and provides pseudocolor thermal images with a resolution exceeding 1920×1080 pixels. The key parameters of the UAV drone platform are summarized in Table 2.
| Parameter | Value |
|---|---|
| Battery configuration | 14S 66000 mAh × 2 |
| Control mode | Full autonomous control |
| Wheelbase | 2.1 m |
| Cruise speed | 8 – 15 m/s |
| Maximum takeoff weight | 60 kg |
| Empty weight | 35 kg |
| Flight time (empty load) | 60 min |
| Flight time (full load) | 18 min |
| Dimensions (expanded) | 1.62 × 1.62 × 0.97 m |
| Dimensions (folded) | 1.00 × 1.00 × 0.97 m |
4.2 Flight Path Planning and Camera Angle Optimization
To ensure complete coverage of photovoltaic arrays with minimal redundancy, we adopt a low-altitude horizontal S-shaped flight pattern. The S-shaped path allows the UAV drone to traverse the entire array in a systematic manner, maintaining a consistent distance from the panels and ensuring uniform image quality. The flight altitude is set between 5 and 10 meters above the panels, providing an optimal balance between spatial resolution and field of view.
The camera angle is adjusted based on the tilt angle of the photovoltaic panels to ensure that the infrared camera captures the panel surface at a near-perpendicular angle, minimizing geometric distortion and reflection artifacts. If the panel tilt angle is denoted as θ, the camera tilt angle is set to:
$$ \alpha = \frac{\pi}{2} – \theta $$
This configuration ensures that the optical axis of the camera is approximately perpendicular to the panel surface, maximizing the thermal signal received from the hot spot regions.
4.3 Centimeter-Level Localization with RTK
Accurate localization of hot spot defects is essential for efficient maintenance operations. We integrate a real-time kinematic positioning system that provides centimeter-level positioning accuracy through differential signal transmission between a base station and a rover mounted on the UAV drone. The RTK system continuously receives correction signals from the base station, enabling precise georeferencing of each captured image.
By combining the known geographic coordinates of the photovoltaic power station, the UAV drone’s flight altitude, and the attitude angles from the inertial measurement unit, the system can accurately calculate the spatial position of each detected hot spot. This information is transmitted to the ground station in real time, allowing maintenance crews to quickly locate and address defective modules.
5. Experiments and Results
In this section, we present a comprehensive evaluation of the proposed MI-YOLO method for hot spot detection in photovoltaic power stations. We conduct experiments on a real-world dataset collected using UAV drones at a photovoltaic power station in Northeast China. The dataset comprises 2,218 infrared thermal images captured under varying weather conditions, illumination levels, and flight altitudes. Each image is annotated with bounding boxes and severity labels for five types of hot spot defects: blue (none), green (warning), yellow (light), red (moderate), and white (severe).
The dataset distribution is characterized by a predominance of blue and green hot spots, which together account for approximately 53.6% of the total samples. Yellow and red hot spots are moderately represented, while white hot spots are the least frequent, corresponding to the most severe defect condition. This distribution reflects the typical condition of well-maintained photovoltaic power stations, where severe defects are relatively rare but require prompt attention when they occur.
5.1 Experimental Setup and Evaluation Metrics
All experiments are conducted using the same training hyperparameters to ensure fair comparison. The hyperparameters are summarized in Table 3.
| Parameter | Value |
|---|---|
| Input image size | 512 × 512 pixels |
| Learning rate | 0.00261 |
| Weight decay | 0.0005 |
| Momentum | 0.949 |
| Number of epochs | 200 |
| Batch size | 8 |
We use five evaluation metrics to assess the performance of different models: Precision, Recall, mean Average Precision at IoU threshold 0.5 (mAP@0.5), F1 score, and frame rate (FPS). These metrics provide a comprehensive view of detection accuracy, completeness, and real-time capability.
5.2 Comparison of Activation Functions
We first evaluate the impact of different activation functions on the performance of the MI-YOLO model. The results are presented in Table 4, which compares the original MI-YOLO (with Mish activation) against variants using Swish, Leaky-ReLU, and the proposed hybrid activation strategy.
| Model | Precision (%) | Recall (%) | mAP@0.5 (%) | F1 (%) | Frame Rate (fps) |
|---|---|---|---|---|---|
| YOLOv4 (baseline) | 81.3 | 94.2 | 90.2 | 87.2 | 104.22 |
| MI-YOLO (Mish) | 83.8 | 98.0 | 95.0 | 90.3 | 78.82 |
| MI-YOLO-Swish | 82.5 | 96.3 | 92.7 | 89.1 | 80.54 |
| MI-YOLO-Leaky | 80.5 | 92.3 | 88.7 | 85.3 | 115.37 |
| MI-YOLO-Hybrid | 85.4 | 98.0 | 95.2 | 91.2 | 82.11 |
The results show that the proposed MI-YOLO with hybrid activation achieves the highest precision (85.4%) and F1 score (91.2%) among all variants, while maintaining a competitive frame rate of 82.11 fps. Compared to the baseline YOLOv4, the MI-YOLO-Hybrid model improves precision by 4.1%, recall by 3.8%, mAP@0.5 by 5.0%, and F1 score by 4.0%. These improvements demonstrate the effectiveness of the proposed architectural enhancements and hybrid activation strategy for hot spot detection.
The Leaky-ReLU variant achieves the highest frame rate (115.37 fps) due to its simpler computation, but suffers from reduced detection accuracy. The Swish variant shows comparable performance to the Mish-based MI-YOLO but with slightly lower precision and recall. The hybrid activation strategy successfully combines the convergence speed of Swish with the feature modeling capability of Mish, resulting in the best overall performance.
5.3 Ablation Study
To evaluate the contribution of each structural improvement in the MI-YOLO architecture, we conduct an ablation study. The three key improvements are denoted as follows: (1) enhanced high-resolution feature maps, (2) deepened SPP module, and (3) multi-scale SPP insertion. The results are presented in Table 5.
| Configuration | Precision (%) | Recall (%) | mAP@0.5 (%) | F1 (%) | Frame Rate (fps) |
|---|---|---|---|---|---|
| YOLOv4 (baseline) | 81.3 | 94.2 | 90.2 | 87.2 | 104.22 |
| MI-YOLO-Hybrid (full) | 85.4 | 98.0 | 95.2 | 91.2 | 82.11 |
| Improvement (1) only | 83.1 | 95.8 | 92.8 | 89.0 | 98.51 |
| Improvement (2) only | 83.5 | 96.0 | 93.1 | 89.3 | 96.72 |
| Improvement (3) only | 82.9 | 95.5 | 92.5 | 88.8 | 97.45 |
| Improvements (1)+(2) | 84.2 | 96.8 | 94.0 | 90.1 | 92.32 |
| Improvements (1)+(3) | 83.9 | 96.6 | 93.8 | 89.8 | 93.17 |
| Improvements (2)+(3) | 84.3 | 97.0 | 94.2 | 90.2 | 91.85 |
The ablation results reveal that each of the three improvements contributes positively to the overall detection performance. Among the individual improvements, the deepened SPP module (improvement 2) yields the highest F1 score (89.3%), indicating its critical role in enhancing feature abstraction for small target detection. The combination of improvements (2) and (3) achieves an F1 score of 90.2%, approaching the performance of the full model. The full MI-YOLO-Hybrid model with all three improvements achieves the best overall performance, with an F1 score of 91.2%.
5.4 Comparison with State-of-the-Art Methods
We compare the proposed MI-YOLO-Hybrid method with several state-of-the-art object detection models, including Faster R-CNN, SSD, Mask R-CNN, YOLOv4, and other YOLO variants. The results are summarized in Table 6.
| Model | F1 (%) | Frame Rate (fps) | Parameters (M) | GFLOPs |
|---|---|---|---|---|
| Otsu thresholding | 30.8 | – | – | – |
| Sobel edge detection | 9.3 | – | – | – |
| Faster R-CNN | 68.4 | 40.55 | 41.5 | 86.7 |
| SSD | 48.4 | 39.87 | 24.6 | 62.3 |
| Mask R-CNN | 77.6 | 36.98 | 63.2 | 134.2 |
| YOLOv4 | 87.2 | 104.22 | 7.2 | 16.5 |
| YOLOv6 | 82.7 | 39.57 | 17.2 | 44.2 |
| YOLOv8 | 88.4 | 57.10 | 11.2 | 28.6 |
| YOLOv10 | 90.5 | 82.72 | 7.2 | 21.6 |
| YOLOv12 | 87.3 | 76.45 | 9.3 | 21.4 |
| MI-YOLO-Hybrid (ours) | 91.2 | 82.11 | 8.1 | 18.8 |
The results demonstrate that traditional image processing methods (Otsu and Sobel) achieve very low F1 scores, as they struggle to distinguish hot spots from background textures and noise. Among the deep learning methods, our MI-YOLO-Hybrid achieves the highest F1 score (91.2%) while maintaining a competitive frame rate (82.11 fps) and moderate computational complexity (8.1 million parameters and 18.8 GFLOPs). Compared to YOLOv4, which has the fastest inference speed, our method improves F1 by 4.0% with only a modest increase in computational cost. Compared to YOLOv10, which achieves the second-highest F1 score (90.5%), our method further improves F1 by 0.7% while maintaining similar inference speed and parameter count.
These results highlight the advantages of our proposed architectural improvements for hot spot detection in infrared images captured by UAV drones. The MI-YOLO-Hybrid model achieves an excellent balance between detection accuracy, inference speed, and computational efficiency, making it well-suited for real-time deployment on UAV drone platforms.
5.5 Robustness Analysis
To evaluate the robustness of the proposed method under varying operational conditions, we conduct a series of experiments that simulate different flight altitudes, illumination levels, and false target scenarios.
First, we investigate the impact of flight altitude on detection performance. By varying the flight altitude of the UAV drone, we obtain images with different spatial resolutions. The results show that the MI-YOLO-Hybrid model maintains high detection accuracy for image sizes of 512×512 and 416×416 pixels. However, when the image size is reduced to 256×256 pixels, corresponding to higher flight altitudes, the model begins to exhibit false detections for blue hot spots due to the reduced pixel count and loss of fine details. Based on these findings, we recommend a flight altitude of 5 to 10 meters for optimal detection performance.
Second, we examine the effect of illumination conditions on detection accuracy. We simulate three illumination levels by adjusting the brightness of the input images: original brightness +10%, -10%, and -20%. The results indicate that increased brightness can cause blue hot spots to be misclassified as green, while red hot spots become more susceptible to false detection. Conversely, decreased brightness enhances contrast but may cause green hot spots to appear as blue, leading to missed detections. These findings underscore the importance of conducting UAV drone inspections during daytime with stable illumination conditions to ensure reliable hot spot detection.
Third, we evaluate the model’s robustness to false targets such as fallen leaves and shadow occlusions. The results show that the MI-YOLO-Hybrid model is generally robust to these types of interference, as the shape features of leaves differ significantly from the trained hot spot features, and shadow occlusions do not produce thermal signatures that resemble hot spots. The model demonstrates stable performance under these common field conditions, confirming its suitability for real-world photovoltaic power station inspection.
6. Conclusion
In this paper, we have presented a comprehensive framework for intelligent hot spot inspection in photovoltaic power stations using UAV drone infrared vision technology. The main contributions and findings of this work are summarized as follows.
First, we established a coupled relationship model that directly maps the pseudocolor representations of infrared thermal images to temperature ranges and defect severity levels. This model provides an intuitive and practical basis for rapid hot spot assessment during UAV drone inspection missions, enabling maintenance personnel to quickly prioritize and address defective modules.
Second, we proposed MI-YOLO, a hybrid intensive YOLO architecture that incorporates three key structural improvements: enhanced shallow feature extraction using multi-layer convolution, deepened spatial pyramid pooling modules, and multi-scale SPP insertion at multiple feature levels. These enhancements significantly improve the detection accuracy for small and subtle hot spot targets in infrared images. Experimental results show that MI-YOLO with hybrid activation achieves a precision of 85.4%, recall of 98.0%, mAP@0.5 of 95.2%, and F1 score of 91.2%, outperforming baseline YOLOv4 by substantial margins.
Third, we designed a complete UAV drone intelligent inspection scheme, including low-altitude S-shaped flight path planning, camera angle optimization based on panel tilt, and centimeter-level RTK positioning for accurate hot spot localization. The system is capable of autonomous flight, real-time image acquisition, and on-board hot spot detection, making it suitable for large-scale photovoltaic power station maintenance operations.
Fourth, we conducted extensive experiments to evaluate the robustness of the proposed method under various operational conditions. The results demonstrate that the MI-YOLO-Hybrid model maintains high detection accuracy under different flight altitudes, illumination levels, and false target scenarios, confirming its reliability for real-world deployment.
In future work, we plan to extend the proposed framework in several directions. First, we aim to incorporate temporal information from video sequences to further improve detection robustness and enable early warning of developing hot spots. Second, we will explore lightweight network architectures and model compression techniques to enable on-board processing on resource-constrained UAV drone platforms. Third, we will investigate the integration of multi-modal sensor data, such as visible light images and electroluminescence images, to provide complementary information for more comprehensive defect assessment. Finally, we will validate the proposed system in additional photovoltaic power stations with different module types, climatic conditions, and site layouts to further demonstrate its generalizability and practical value.