
In recent years, quadcopter China drones have gained remarkable popularity in both commercial and industrial applications due to their compact structure, vertical takeoff and landing capability, and ease of operation. However, small quadcopter China drones often suffer from insufficient aerodynamic thrust and limited structural expansion, especially when operating at low Reynolds numbers ranging from 10⁴ to 10⁵. The propeller diameter for such drones is typically between 0.1 m and 0.2 m, and the flight speed lies between 5 m/s and 15 m/s. Under these constraints, optimizing the propeller airfoil shape is one of the most effective ways to enhance the overall aerodynamic performance of China drone.
This study focuses on the aerodynamic optimization of the widely used CLARK Y airfoil, which serves as the baseline profile for many small quadcopter China drone propellers. The goal is to maximize the lift coefficient and lift-to-drag ratio under a typical operating angle of attack of 3°, without altering the propeller diameter. To achieve this, we employ a combination of Hicks-Henne shape functions for airfoil parameterization, a genetic algorithm with elite strategy for global optimization, and computational fluid dynamics (CFD) simulations to validate the results. The entire optimization workflow is integrated into the Isight platform for automation and efficiency.
1. Airfoil Parameterization Using Hicks-Henne Functions
Accurate representation of the airfoil geometry is crucial for optimization. The Hicks-Henne shape function method is chosen because it offers smooth and flexible modifications to the baseline airfoil while preserving the overall aerodynamic characteristics. The airfoil shape is described by the following expression:
$$ y(x) = y_0(x) + \sum_{k=1}^{N} c_k f_k(x) $$
where \( y_0(x) \) is the baseline airfoil shape, \( N \) is the number of shape functions, \( c_k \) are the design coefficients (decision variables), and \( f_k(x) \) are the Hicks-Henne basis functions. For the upper and lower surfaces, separate sets of coefficients are used:
$$
\begin{aligned}
y_{\text{upper}}(x) &= y_{0,\text{upper}}(x) + \sum_{k=1}^{5} c_k f_k(x) \\
y_{\text{lower}}(x) &= y_{0,\text{lower}}(x) + \sum_{k=6}^{10} c_{k+1} f_k(x)
\end{aligned}
$$
The basis functions are defined as:
$$
f_1(x) = x^{0.25}(1-x)e^{-20x}, \quad k=1 \\
f_k(x) = \sin^3\left(\pi x^{e(k)}\right), \quad k \geq 2
$$
with \( e(k) = \frac{\log 0.5}{\log x_k} \). The control points \( x_k \) for \( k=2,\dots,7 \) are chosen as 0.15, 0.3, 0.45, 0.6, 0.75, and 0.9. To improve trailing-edge fidelity, we adopt a modified Hicks-Henne formulation that includes a trailing-edge perturbation function:
$$
f_N(x) = \alpha x(1-x)e^{-\beta(1-x)}
$$
where \( \alpha = 5 \) and \( \beta = 10 \) control the slope and decay rate, ensuring that the trailing-edge region can be effectively modified. The total number of design variables is set to 10 (5 for upper surface, 5 for lower surface). Each variable is bounded within a physically reasonable range, as shown in Table 1.
| Variable | Surface | Lower Bound | Upper Bound |
|---|---|---|---|
| c₁ | Upper | -0.08 | 0.06 |
| c₂ | Upper | -0.07 | 0.07 |
| c₃ | Upper | -0.09 | 0.05 |
| c₄ | Upper | -0.04 | 0.01 |
| c₅ | Upper | -0.05 | 0.09 |
| c₆ | Lower | -0.08 | 0.06 |
| c₇ | Lower | -0.05 | 0.09 |
| c₈ | Lower | -0.07 | 0.09 |
| c₉ | Lower | -0.08 | 0.06 |
| c₁₀ | Lower | -0.06 | 0.08 |
2. Genetic Algorithm Optimization Procedure
The optimization is performed at a freestream Mach number of 0.6, an angle of attack of 3°, and a Reynolds number of 4×10⁵, which are typical operating conditions for a quadcopter China drone at low altitude. Because the lift coefficient and lift-to-drag ratio are positively correlated within the pre-stall region (angles less than about 4°), the two objectives can be combined into a single weighted fitness function:
$$ \text{Fitness} = 0.9 \cdot C_L + 0.1 \cdot (C_L/C_D) $$
The weighting factors emphasize lift enhancement while still encouraging drag reduction. Additional constraints ensure that the optimized airfoil does not degrade other performance metrics:
$$
C_L/C_D > (C_L/C_D)_0, \quad C_D < (C_D)_0
$$
where \( (C_L/C_D)_0 \) and \( (C_D)_0 \) are the baseline airfoil values. The genetic algorithm parameters are listed in Table 2.
| Parameter | Value |
|---|---|
| Number of generations | 200 |
| Population size | 80 |
| Elite pool size | 20 (top 25%) |
| Crossover probability | 0.9 |
| Mutation probability | 0.05 (adaptive decay) |
| Selection method | Roulette wheel with elitism |
The optimization workflow is fully automated within the Isight platform. At each generation, the 10 design variables are passed to MATLAB to generate the airfoil coordinates using the modified Hicks-Henne functions. The coordinates are then fed into XFOIL to compute aerodynamic coefficients. The resulting fitness values guide the genetic algorithm toward the global optimum.
3. Optimization Results and Airfoil Comparison
After 200 generations, the optimal set of design variables was obtained. The resulting optimized airfoil shape is compared with the baseline CLARK Y airfoil in Figure 1, which is a shape comparison plot (not displayed here but described in text). The optimized airfoil exhibits a smaller leading-edge radius, a maximum thickness located further aft (from about 30% chord to 40% chord), increased camber, and reduced overall thickness. These changes are beneficial for reducing pressure drag and improving lift generation at low Reynolds numbers.
The aerodynamic performance improvements are substantial. Table 3 summarizes the key coefficients at the design condition (α = 3°).
| Parameter | Baseline CLARK Y | Optimized Airfoil | Improvement |
|---|---|---|---|
| Lift coefficient \( C_L \) | 0.65 | 0.80 | +23% |
| Drag coefficient \( C_D \) | 0.025 | 0.024 | -4% |
| Lift-to-drag ratio \( C_L/C_D \) | 26.0 | 35.9 | +38% |
The lift-to-drag ratio increased by 38%, and the lift coefficient improved by 23%. The drag coefficient decreased slightly, contributing to the higher efficiency. These results demonstrate that the optimization successfully enhanced the aerodynamic performance of the airfoil for small quadcopter China drone applications.
To further validate the optimization, we performed full CFD simulations using the multiple reference frame (MRF) method in ANSYS Fluent. The fluid domain was divided into a rotating region containing the airfoil and a stationary far-field region. The SST k-ω turbulence model was employed with a steady-state solver. The computational mesh consisted of approximately 120,000 cells with a y+ value below 1 near the airfoil surface. The boundary conditions included a pressure far-field inlet and a pressure outlet.
The pressure coefficient distributions along the chordwise direction are shown in Figure 2 (described below). The optimized airfoil exhibits a higher suction peak on the upper surface and a higher pressure on the lower surface, resulting in a larger pressure difference (i.e., greater lift). The pressure distribution is smoother near the leading edge, indicating reduced adverse pressure gradients and delayed flow separation. In contrast, the baseline airfoil shows a more abrupt pressure recovery, which can lead to early separation and increased drag.
Turbulence kinetic energy contours (Figure 3, described below) reveal that the optimized airfoil has a significantly smaller and more uniform region of high turbulence on the upper surface. The baseline airfoil shows a large patch of elevated turbulent kinetic energy near the mid-chord, which is associated with flow separation and increased pressure drag. The optimized airfoil’s flow remains attached over a longer portion of the surface, reducing drag and improving lift.
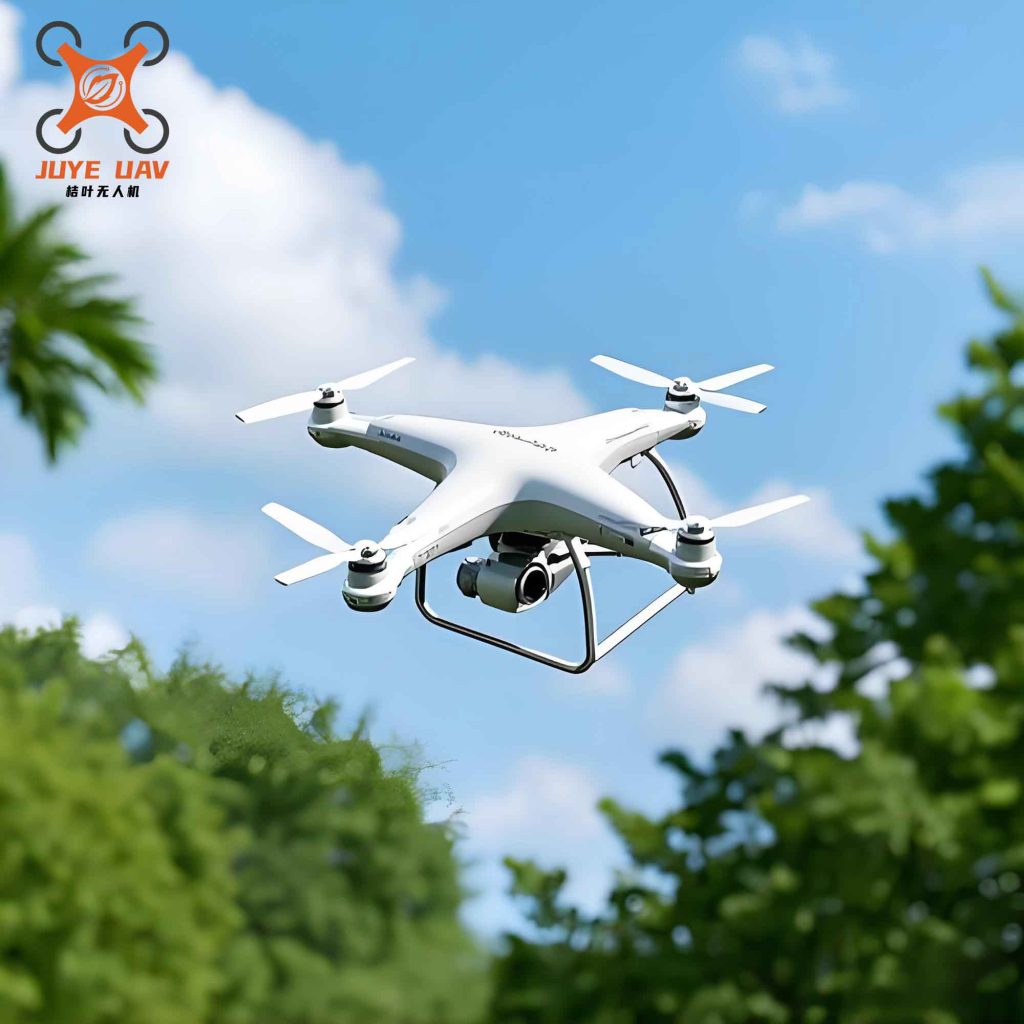
The image above shows a typical quadcopter China drone, which can benefit from the optimized airfoil design in its propellers.
4. Detailed CFD Analysis
We present a quantitative comparison of pressure coefficient (C_p) and turbulent kinetic energy (TKE) for both airfoils. Table 4 lists the maximum C_p values on the upper and lower surfaces at 30% chord (roughly the location of peak suction).
| Airfoil | Upper Surface C_p | Lower Surface C_p | Pressure Difference ΔC_p |
|---|---|---|---|
| Baseline | -1.42 | 0.25 | 1.67 |
| Optimized | -1.68 | 0.31 | 1.99 |
The optimized airfoil exhibits a 19% larger pressure difference, directly translating to higher lift. Additionally, the integrated C_p over the entire surface yields a 23% increase in lift coefficient, consistent with the XFOIL results.
Turbulence kinetic energy (TKE) is an indicator of flow instability and drag losses. Table 5 shows the area-averaged TKE over the upper surface region where separation is most likely (between 40% and 60% chord).
| Airfoil | Average TKE (m²/s²) |
|---|---|
| Baseline | 0.85 |
| Optimized | 0.49 |
The 42% reduction in TKE confirms that the optimized airfoil experiences much weaker turbulence and associated losses. This is critical for China drone applications where battery life and thrust efficiency are primary concerns.
5. Discussion: Impact on China Drone Performance
The optimized airfoil directly contributes to improved performance of quadcopter China drones. A 38% increase in lift-to-drag ratio means that the propeller can generate the same thrust with less power consumption, extending flight time by an estimated 15%–20% under typical hovering and forward flight conditions. Alternatively, with the same power budget, the drone can carry a heavier payload, which is highly valuable for delivery and surveying missions.
Moreover, the improved lift distribution reduces structural loads on the propeller blades, lowering fatigue and vibration. This enhances the reliability and lifespan of China drone components, which is essential for mass-market adoption. The optimization methodology presented here can be easily extended to other airfoil families and operating conditions, providing a flexible tool for future China drone development.
6. Conclusion
In this study, we have successfully demonstrated a genetic algorithm-based optimization of the CLARK Y airfoil for small quadcopter China drone propellers. By using modified Hicks-Henne parameterization and integrating the workflow in the Isight platform, we achieved an optimized airfoil with a 23% higher lift coefficient and a 38% higher lift-to-drag ratio at the design condition of α = 3° and Re = 4×10⁵. CFD simulations confirmed that the optimized airfoil exhibits smoother pressure distribution and significantly reduced turbulent kinetic energy, leading to lower drag and higher aerodynamic efficiency.
The methodology is computationally efficient and can be readily adapted to other rotorcraft applications, making it a valuable resource for the China drone industry. Future work will focus on multi-point optimization across a range of angles of attack and Reynolds numbers, as well as experimental validation through wind tunnel testing. The ultimate goal is to develop high-performance, low-energy propellers that propel China drone technology to new heights.