
Mountain landslides frequently occur in regions with complex topography, causing severe damage to road infrastructure and impeding traffic safety, rescue operations, and post-disaster reconstruction. Traditional road surveying methods suffer from low accuracy, poor efficiency, and inadequate adaptability in such challenging environments. To address these issues, we propose a novel surveying technique that integrates 3D laser scanning with UAV drone photogrammetry. By constructing a multi-source point cloud acquisition system and optimizing data processing algorithms, our method significantly improves the accuracy and completeness of road extraction in landslide areas. This paper presents the full workflow, including point cloud acquisition, statistical denoising, elevation-normal vector joint filtering, and Euclidean clustering for road surface identification. Experimental results demonstrate that the proposed technique achieves a road extraction accuracy of 95.15%, completeness of 97.37%, and quality of 96.46%, outperforming raw data approaches. The combination of 3D laser scanning and UAV drone technology offers a robust solution for rapid and precise road surveying in mountainous landslide zones.
Our study area is a typical low-mountain terrain region in southwestern China, characterized by an east–west elevation gradient and frequent landslide activities. The landslide body parameters are summarized in Table 1. The overall surveying workflow, as depicted conceptually, involves four core steps: (1) acquiring point cloud data using both a terrestrial 3D laser scanner and a UAV drone; (2) preprocessing the point cloud via denoising and filtering; (3) generating high-resolution digital elevation models (DEMs) and 3D models of the landslide area; and (4) applying Euclidean clustering to extract road information from the point cloud. This multi-source collaborative approach ensures high precision even under adverse topographic conditions.
| Parameter | Value |
|---|---|
| Rear elevation (m) | 950 |
| Front elevation (m) | 905 |
| Landslide shape | Circular armchair |
| Profile shape | Broken line |
| Slope angle (°) | 8–25 |
| Transverse width (m) | 110 |
| Longitudinal width (m) | 180 |
| Thickness (m) | 5–14 |
| Average thickness (m) | 10 |
| Volume (m³) | 1.98×10⁵ |
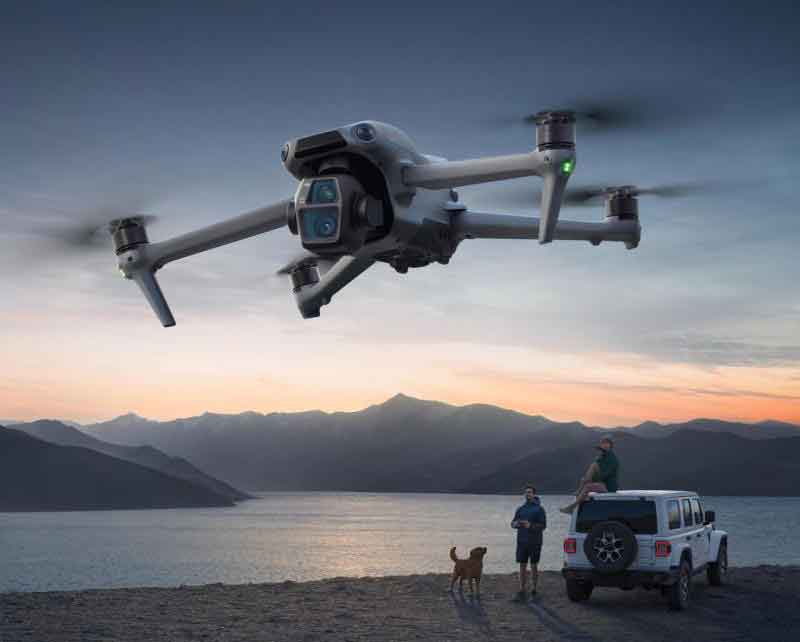
To obtain high-quality point cloud data, we employed a SX10 3D laser scanner for ground-based acquisition and a DJI Phantom 4 UAV drone for aerial complementation. The SX10 has a scanning field of 360°×300°, a range of 600 m, and a scanning rate of up to 26,600 points per second. Three scanning modes (coarse, standard, and precise) were tested, and the precise mode was selected for its richer point cloud information. Table 2 details the point cloud counts under different scanning distances and modes. The UAV drone, operated at a speed of 4 m/s, captured 1,400 images over the landslide area, generating 465,912,013 dense points with an error of less than 0.056494 m. The resulting 3D model covered approximately 3.4 km² with 86,215,932 faces and 46,952,597 vertices. This demonstrates that the UAV drone photogrammetry significantly enhances data completeness in regions inaccessible to the ground scanner.
| Scan mode & distance | Total points | Landslide points | Landslide ratio (%) |
|---|---|---|---|
| 40cm-coarse | 37,002 | 4,276 | 11.56 |
| 80cm-coarse | 36,824 | 6,590 | 17.90 |
| 120cm-coarse | 36,827 | 10,148 | 27.56 |
| 160cm-coarse | 36,886 | 11,077 | 30.03 |
| 40cm-standard | 145,137 | 16,794 | 11.57 |
| 80cm-standard | 146,233 | 26,108 | 17.85 |
| 120cm-standard | 144,460 | 40,171 | 27.81 |
| 160cm-standard | 144,636 | 43,907 | 30.36 |
| 40cm-precise | 576,704 | 65,678 | 11.39 |
| 80cm-precise | 574,016 | 95,262 | 16.60 |
| 120cm-precise | 573,952 | 145,960 | 25.43 |
| 160cm-precise | 574,916 | 171,842 | 29.89 |
The raw point clouds invariably contain noise from birds, floating objects, vegetation, and other interferences. To purify the data, we first applied statistical filtering. This method assumes that the average distance from each point to its k nearest neighbors follows a Gaussian distribution. The mean μ and standard deviation σ of these distances are computed, and points whose average distances lie outside the interval [μ − ασ, μ + ασ] are considered outliers and removed. The filtered point cloud (as visualized in the removed noise results) shows clearer features, facilitating subsequent processing.
After denoising, we performed elevation filtering to separate ground points from above-ground objects such as trees and buildings. The procedure is as follows: first, the point cloud is divided into vertical columns; within each column, points are sorted by elevation. To prevent the influence of outliers, the lowest K points are averaged to obtain a ground reference Z_min. Through repeated experiments, we determined that K in the range of 75 to 150 yields optimal results. Points with elevations within [Z_min, Z_min + h_ground] are retained, where h_ground = 2.0 m represents the maximum elevation variation of the ground surface. This step effectively removes most tall objects while preserving road surfaces and low-lying features.
However, elevation filtering alone cannot eliminate objects with heights similar to the ground, such as pedestrians, vehicles, or tree stumps. To further refine the point cloud, we employed local normal vector filtering using Principal Component Analysis (PCA). The normal vector of a road surface is nearly vertical (parallel to the Z-axis), whereas other objects exhibit more dispersed orientations. The PCA-based computation for a point p and its 20 nearest neighbors proceeds as follows:
$$ \tilde{x}_i = \frac{x_i – \bar{x}}{\sqrt{V(x)}} $$
$$ \tilde{y}_i = \frac{y_i – \bar{y}}{\sqrt{V(y)}} $$
$$ \tilde{z}_i = \frac{z_i – \bar{z}}{\sqrt{V(z)}} $$
where x̄, ȳ, z̄ are the means and V(x), V(y), V(z) the variances of the local coordinates. The correlation matrix R is then formed:
$$ R = \begin{bmatrix} r_{XX} & r_{XY} & r_{XZ} \\ r_{YX} & r_{YY} & r_{YZ} \\ r_{ZX} & r_{ZY} & r_{ZZ} \end{bmatrix} $$
From this matrix, the eigenvectors and eigenvalues are derived; the eigenvector corresponding to the smallest eigenvalue gives the normal vector. By computing the angle between the normal vector and the Z-axis, we define a threshold to retain only points whose normals are close to vertical. This operation removes most small objects while preserving road pavement points and flat stones.
Finally, we extract the road surface point cloud using Euclidean clustering. The algorithm randomly selects a seed point p and groups all points within a distance threshold r into a cluster S. It then iteratively expands S by checking the neighbors of newly added points and including them if they satisfy the distance condition. The process stops when no more points can be added or the cluster size falls below a minimum limit. The Euclidean distance between two points p and q is:
$$ d(p,q) = \sqrt{(x_p – x_q)^2 + (y_p – y_q)^2 + (z_p – z_q)^2} $$
Through this clustering, all points belonging to the road are grouped together, completing the road surveying task.
To evaluate the effectiveness of our proposed technique, we conducted a comparative experiment using two datasets: Dataset 1 consists of raw, unprocessed point clouds; Dataset 2 goes through the complete denoising and filtering pipeline. Both datasets were then processed with Euclidean clustering to extract road information. The results are shown in Table 3.
| Metric | Dataset 1 (Raw) | Dataset 2 (Processed) |
|---|---|---|
| Nearest neighbor search radius (m) | 0.10 | 0.07 |
| Minimum cluster points | 5,000 | 4,100,000 |
| Maximum cluster points | 3,000,000 | 7,000,000 |
| Total data points | 4,327,613 | 7,260,881 |
| Accuracy (%) | 87.48 | 95.15 |
| Completeness (%) | 91.64 | 97.37 |
| Extraction quality (%) | 84.64 | 96.46 |
As shown in Table 3, Dataset 1, which lacked preprocessing, contained significant noise and interference, leading to low accuracy (87.48%), completeness (91.64%), and extraction quality (84.64%). In contrast, Dataset 2, after statistical denoising, elevation filtering, and normal vector filtering, achieved substantial improvements: accuracy reached 95.15%, completeness 97.37%, and extraction quality 96.46%. These results confirm that the combined use of 3D laser scanning and UAV drone photogrammetry, together with our optimized processing pipeline, significantly enhances the reliability of road surveying in mountain landslide areas.
In conclusion, the integration of 3D laser scanning and UAV drone photogrammetry provides a powerful solution for rapid and accurate road surveying in complex landslide terrains. Our methodology effectively removes noise and non-ground points, allowing the Euclidean clustering algorithm to precisely delineate road surfaces. The experimental validation demonstrates that the proposed technique meets the stringent requirements of post-disaster road reconstruction and can be widely applied in similar mountainous regions. Future work will focus on automating the parameter selection and extending the method to real-time monitoring using UAV drone swarms.