
As a seasoned operator in disaster response, I have come to rely heavily on the transformative capabilities of fire drones to navigate the chaos that follows catastrophic events. The rapid acquisition of accurate situational awareness is not just beneficial—it is a lifeline that dictates the success of rescue missions. In my extensive field experience, particularly during large-scale flood disasters, the integration of fire drone technology has fundamentally altered our operational landscape. These unmanned aerial systems provide an unparalleled vantage point, enabling real-time assessment, strategic planning, and precise intervention. This article delves into the multifaceted applications of fire drones, drawing from firsthand实战 encounters to elucidate their role in enhancing emergency response efficacy, supported by technical analyses, tabular summaries, and mathematical models.
The cornerstone of effective disaster management lies in comprehensive感知. During a major flood operation, our team deployed a混合 fleet of fire drones to survey vast inundated regions. We employed a strategy of “high-low mix and point-area combination,” utilizing long-endurance fixed-wing fire drones for broad tactical reconnaissance and agile multi-rotor fire drones for detailed inspections. For instance, over a single affected city spanning approximately 100 square kilometers, fixed-wing fire drones operating at 1000 meters altitude captured thousands of high-resolution images. The ground sample distance (GSD), a critical metric for image detail, is given by:
$$ \text{GSD} = \frac{H \times s}{f} $$
where \( H \) is the飞行 altitude, \( s \) is the sensor pixel size, and \( f \) is the lens focal length. For a typical fire drone equipped with a camera having \( s = 2.4 \, \mu\text{m} \) and \( f = 24 \, \text{mm} \), flying at \( H = 1000 \, \text{m} \), the GSD calculates to:
$$ \text{GSD} = \frac{1000 \, \text{m} \times 2.4 \times 10^{-6} \, \text{m}}{0.024 \, \text{m}} = 0.1 \, \text{m} = 10 \, \text{cm} $$
This 10 cm resolution imagery enabled us to identify critical infrastructure damage, breach points in levees, and extensive urban waterlogging with precision. The following table summarizes the key parameters of the fire drone types deployed in such scenarios:
| Drone Type | Endurance (hours) | Typical Altitude (m) | Coverage Area per Sortie (km²) | Primary Sensor Payload | Optimal Use Case |
|---|---|---|---|---|---|
| Fixed-wing Fire Drone | >2.5 | 500-1500 | 20-50 | High-resolution RGB, multispectral | Large-area mapping, rapid assessment |
| VTOL Fixed-wing Fire Drone | 1.5-2 | 200-1000 | 10-25 | RGB, thermal | Medium-area surveys, flexible takeoff/landing |
| Multi-rotor Fire Drone | 0.3-0.7 | 50-200 | 0.5-2 | RGB, thermal, loudspeaker, spotlight | Close inspection,搜救, payload delivery |
The operational coverage area \( A_{\text{cov}} \) for a fire drone following a systematic grid pattern can be modeled as:
$$ A_{\text{cov}} = N \times (L \times W) $$
where \( N \) is the number of flight lines, \( L \) is the length of the area, and \( W \) is the swath width. For a fixed-wing fire drone with a swath width \( W = 200 \, \text{m} \), covering a rectangular region of length \( L = 10 \, \text{km} \) with 50 flight lines, the area is:
$$ A_{\text{cov}} = 50 \times (10,000 \, \text{m} \times 200 \, \text{m}) = 100,000,000 \, \text{m}^2 = 100 \, \text{km}^2 $$
This extensive coverage proved invaluable in提前 grasping the scale of disasters, such as identifying massive urban inundation and levee breaches across multiple cities totaling over 300 km². The imagery captured by these fire drones forms the backbone of our decision-support系统. To illustrate the visual impact, consider the following representative output from our fire drone missions:
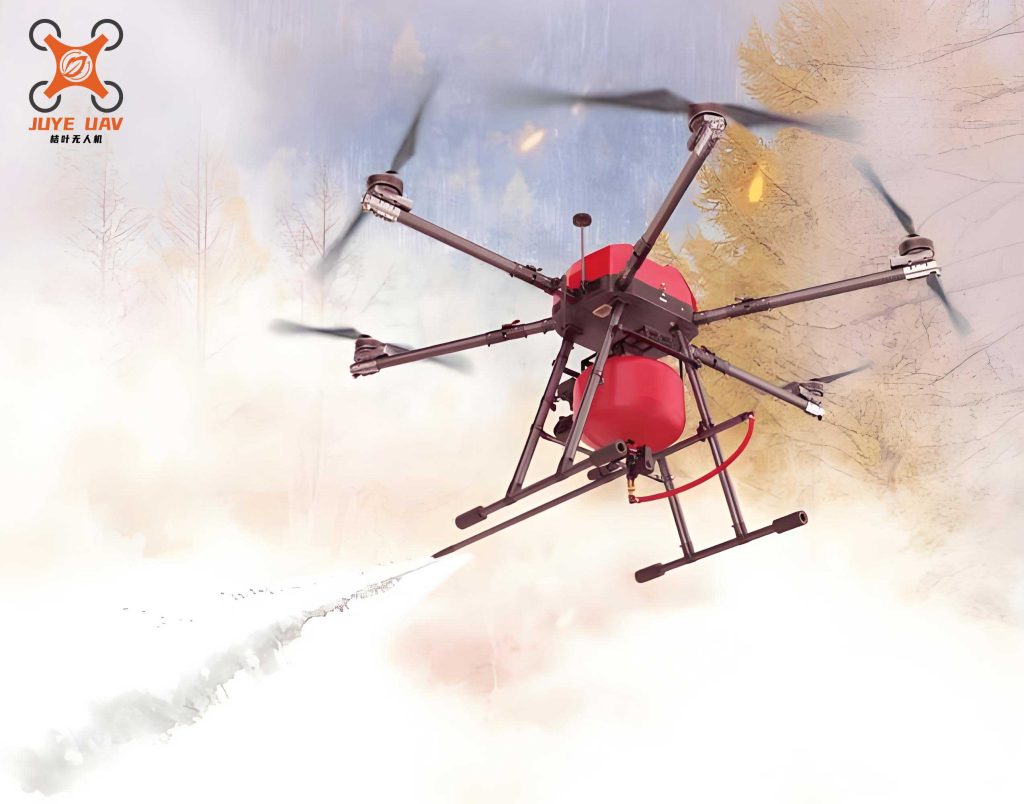
Such imagery, often processed into orthomosaics and digital surface models, provides commanders with a clear, actionable view of the terrain, significantly accelerating response timelines.
Beyond mere data collection, the true power of fire drones lies in their ability to deliver insights rapidly to decision-makers. In the field, communication networks are often degraded or nonexistent. To overcome this, we established forward and rear data processing cells专门 for fire drone outputs. Using lightweight applications and secure links, commanders could access live video feeds, panoramic views, and 2D/3D reconstructions directly on mobile devices. The efficiency of data transmission is crucial; the time \( T_{\text{proc}} \) from acquisition to availability can be expressed as:
$$ T_{\text{proc}} = T_{\text{flight}} + T_{\text{downlink}} + T_{\text{process}} $$
where \( T_{\text{flight}} \) is the mission time, \( T_{\text{downlink}} \) is the data downlink time, and \( T_{\text{process}} \) is the processing time. For a typical sortie producing 5000 images (each 10 MB) from a fire drone, the total data volume \( D \) is \( 5000 \times 10 \, \text{MB} = 50 \, \text{GB} \). With a downlink rate \( R \) of 10 Mbps, the downlink time alone would be:
$$ T_{\text{downlink}} = \frac{D}{R} = \frac{50 \times 10^9 \times 8 \, \text{bits}}{10 \times 10^6 \, \text{bps}} = 40,000 \, \text{s} \approx 11.1 \, \text{hours} $$
To circumvent this, we employed onboard processing and selective streaming, reducing \( T_{\text{downlink}} \) dramatically. Daily, we generated annotated “road inundation reality maps,” color-coding roads as passable (green), submerged (red), or涉水 (amber). This tabular summary was often presented alongside imagery:
| Zone | Area Covered (km²) | Critical Findings | Road Status (km) | Recommended Actions |
|---|---|---|---|---|
| City Center | 15.2 | Hospital isolated, power outage | Green: 5, Red: 8, Amber: 12 | Prioritize boat rescue, deploy generators |
| Residential Suburb | 22.7 | Widespread flooding up to 2m | Green: 2, Red: 15, Amber: 10 | Conduct house-to-house search, airdrop supplies |
| Industrial Park | 18.5 | Chemical storage compromised | Green: 10, Red: 5, Amber: 8 | Establish containment, assess hazardous material leak |
The agility of fire drones allows for tailored applications during active rescue phases. I recall instances where multi-rotor fire drones equipped with thermal cameras and loudspeakers were instrumental in夜间 operations. During a hospital evacuation, a fire drone guided boats through treacherous waters by providing real-time infrared imagery, effectively acting as a pathfinder. The effectiveness of a搜救 pattern using fire drones can be quantified by the probability of detection \( P_d \) over an area \( A \):
$$ P_d = 1 – e^{-\lambda \cdot A \cdot t} $$
where \( \lambda \) is the detection rate constant (inversely proportional to altitude and vegetation density), and \( t \) is the search time. For a fire drone covering \( A = 1 \, \text{km}^2 \) with \( \lambda = 0.05 \, \text{km}^{-2}\text{h}^{-1} \) over \( t = 2 \, \text{hours} \):
$$ P_d = 1 – e^{-0.05 \times 1 \times 2} = 1 – e^{-0.1} \approx 0.095 $$
While this seems low, deploying multiple fire drones in parallel significantly enhances \( P_d \). Moreover, the附加 of loudspeakers and spotlights amplified our “grid-search, door-to-door” efforts, as the drone could broadcast instructions and illuminate areas inaccessible to ground teams. The versatility of payloads is a key strength; the following table enumerates common fire drone payloads and their utility:
| Payload Type | Specifications | Operational Function | Impact Metric |
|---|---|---|---|
| High-resolution RGB Camera | 20 MP, gimbal-stabilized | Detailed imagery, damage assessment | Ground resolution ≤10 cm |
| Thermal Imaging Camera | 640×512 resolution, 7.5-13.5 μm | Night operations, heat signature detection | Detection range up to 500 m |
| LiDAR Sensor | 100,000 points/sec, 150 m range | 3D mapping, volumetric analysis of debris | Vertical accuracy ±5 cm |
| Loudspeaker | 100 dB at 10 m | Public address,搜救 guidance | Coverage radius ~200 m |
| Spotlight | 2000 lumens | Illumination for night rescues | Illuminated area ~100 m² |
| Emergency Supply Dropper | 5 kg capacity | Delivery of life jackets, medicines | Drop accuracy ±3 m |
Collaboration magnifies the impact of fire drone operations. During large-scale responses, we worked alongside national减灾 agencies, forming joint fire drone task forces. This partnership enabled synchronized mission planning and resource sharing. The daily flight tasking followed a rigorous process: based on pumping and evacuation priorities, we crafted flight plans that optimized sortie schedules, sensor selections, and data products. The overall effectiveness \( E \) of such a collaborative fire drone network can be modeled as a function of the number of units \( n \), coordination factor \( \alpha \) (0 ≤ α ≤ 1), and individual capability \( C \):
$$ E = \alpha \cdot n \cdot C \cdot e^{-\beta t} $$
where \( \beta \) is a decay factor accounting for fatigue and logistical delays, and \( t \) is time into the operation. With \( \alpha = 0.8 \), \( n = 10 \) drones, \( C = 1 \) (normalized), and \( \beta = 0.05 \, \text{day}^{-1} \), after 3 days (\( t=3 \)):
$$ E = 0.8 \times 10 \times 1 \times e^{-0.05 \times 3} \approx 8 \times e^{-0.15} \approx 8 \times 0.8607 \approx 6.89 $$
This indicates sustained high effectiveness through cooperation. Together, we produced over 20 detailed reports and thematic maps per day, synthesizing 2D and 3D geospatial data from主要 affected zones. The integration of data from diverse fire drone platforms was facilitated by standardized formats, such as GeoTIFF for imagery and LAS for point clouds, ensuring interoperability.
However,实战暴露 several limitations in our fire drone ecosystem. A persistent challenge was the shortage of trained pilots, especially for long-endurance fixed-wing platforms. The demand for real-time data often outstripped our processing capacity, and the cartographic outputs sometimes lacked the granularity required for tactical decisions. Mathematically, the pilot shortage can be framed as a resource constraint problem. Let \( P_{\text{req}} \) be the required pilot-hours per day, \( P_{\text{avail}} \) be the available pilot-hours, and \( M \) be the number of operational fire drones. For \( M = 15 \) drones each needing 4 hours of pilot oversight daily, \( P_{\text{req}} = 60 \) hours. If \( P_{\text{avail}} = 40 \) hours, the deficit \( \Delta P \) is:
$$ \Delta P = P_{\text{req}} – P_{\text{avail}} = 20 \, \text{hours} $$
This gap forces suboptimal utilization of assets. Additionally, the number of long-endurance fixed-wing fire drones was insufficient for continuous wide-area monitoring. The optimal fleet mix can be determined by solving a linear programming problem to maximize coverage area \( A_{\text{total}} \):
$$ \text{Maximize } A_{\text{total}} = \sum_{i} x_i \cdot a_i $$
subject to constraints:
$$ \sum_{i} x_i \cdot c_i \leq B, \quad \sum_{i} x_i \cdot p_i \leq P, \quad x_i \geq 0 $$
where \( x_i \) is the number of drones of type \( i \), \( a_i \) is the coverage area per sortie, \( c_i \) is the cost, \( B \) is the budget, \( p_i \) is the pilot hours required, and \( P \) is the total pilot availability. For two types—fixed-wing (FW) and multi-rotor (MR)—with \( a_{\text{FW}} = 30 \, \text{km}^2 \), \( c_{\text{FW}} = 50 \), \( p_{\text{FW}} = 4 \); \( a_{\text{MR}} = 1 \, \text{km}^2 \), \( c_{\text{MR}} = 10 \), \( p_{\text{MR}} = 1 \); and constraints \( B = 200 \), \( P = 40 \), the solution would yield the ideal composition. Typically, we found a ratio of 1:5 for FW:MR fire drones balanced capabilities with resources.
To address these shortcomings, we are institutionalizing proven fire drone tactics. This includes formalizing protocols for aerial reconnaissance, underground structure inspection using specialized collision-tolerant fire drones, and real-time map annotation. Training regimens now emphasize simulator-based sorties, data processing drills, and cross-functional exercises with rescue teams. The learning curve for fire drone operators can be described by a logistic growth model for proficiency \( S(t) \):
$$ S(t) = \frac{K}{1 + e^{-r(t-t_0)}} $$
where \( K \) is the maximum proficiency level, \( r \) is the learning rate, \( t \) is training time, and \( t_0 \) is the inflection point. With \( K = 100\% \), \( r = 0.3 \, \text{week}^{-1} \), and \( t_0 = 4 \, \text{weeks} \), after 8 weeks (\( t=8 \)):
$$ S(8) = \frac{100}{1 + e^{-0.3 \times (8-4)}} = \frac{100}{1 + e^{-1.2}} \approx \frac{100}{1 + 0.3012} \approx 76.9\% $$
This underscores the need for sustained training investment. Moreover, we are enhancing collaboration with operations departments to ensure fire drone missions are tightly aligned with evolving tactical needs. Future developments focus on automating flight planning via AI, integrating real-time analytics for instant damage quantification, and expanding the fleet with hybrid fire drones boasting extended endurance. The ultimate goal is to create a seamless fire drone-enabled response network where data flows unimpeded from sky to commander, empowering decisions that save lives and mitigate suffering.
In reflection, the evolution of fire drone technology has been nothing short of revolutionary in my career. From providing that first overarching glimpse of devastation to guiding a rescue boat through pitch-black waters, these systems have proven indispensable. The mathematical frameworks and systematic approaches outlined herein not only validate their utility but also chart a course for future innovation. As we continue to refine tactics, overcome limitations, and foster collaboration, the fire drone will undoubtedly remain at the forefront of emergency response, transforming chaos into coordinated action and despair into hope.