
Rapid and accurate acquisition of agricultural information and crop planting structure is crucial for ensuring food security and sustainable agricultural development. This study establishes a novel framework for precise crop classification by integrating agricultural UAV-based hyperspectral imagery with object-oriented analysis. Agricultural drones equipped with hyperspectral sensors provide unprecedented spatial-spectral resolution, capturing subtle differences in crop spectral signatures that are critical for distinguishing morphologically similar species. The methodology addresses key limitations in traditional satellite-based approaches, including mixed pixels and spectral confusion, which hinder accurate classification in fragmented agricultural landscapes.
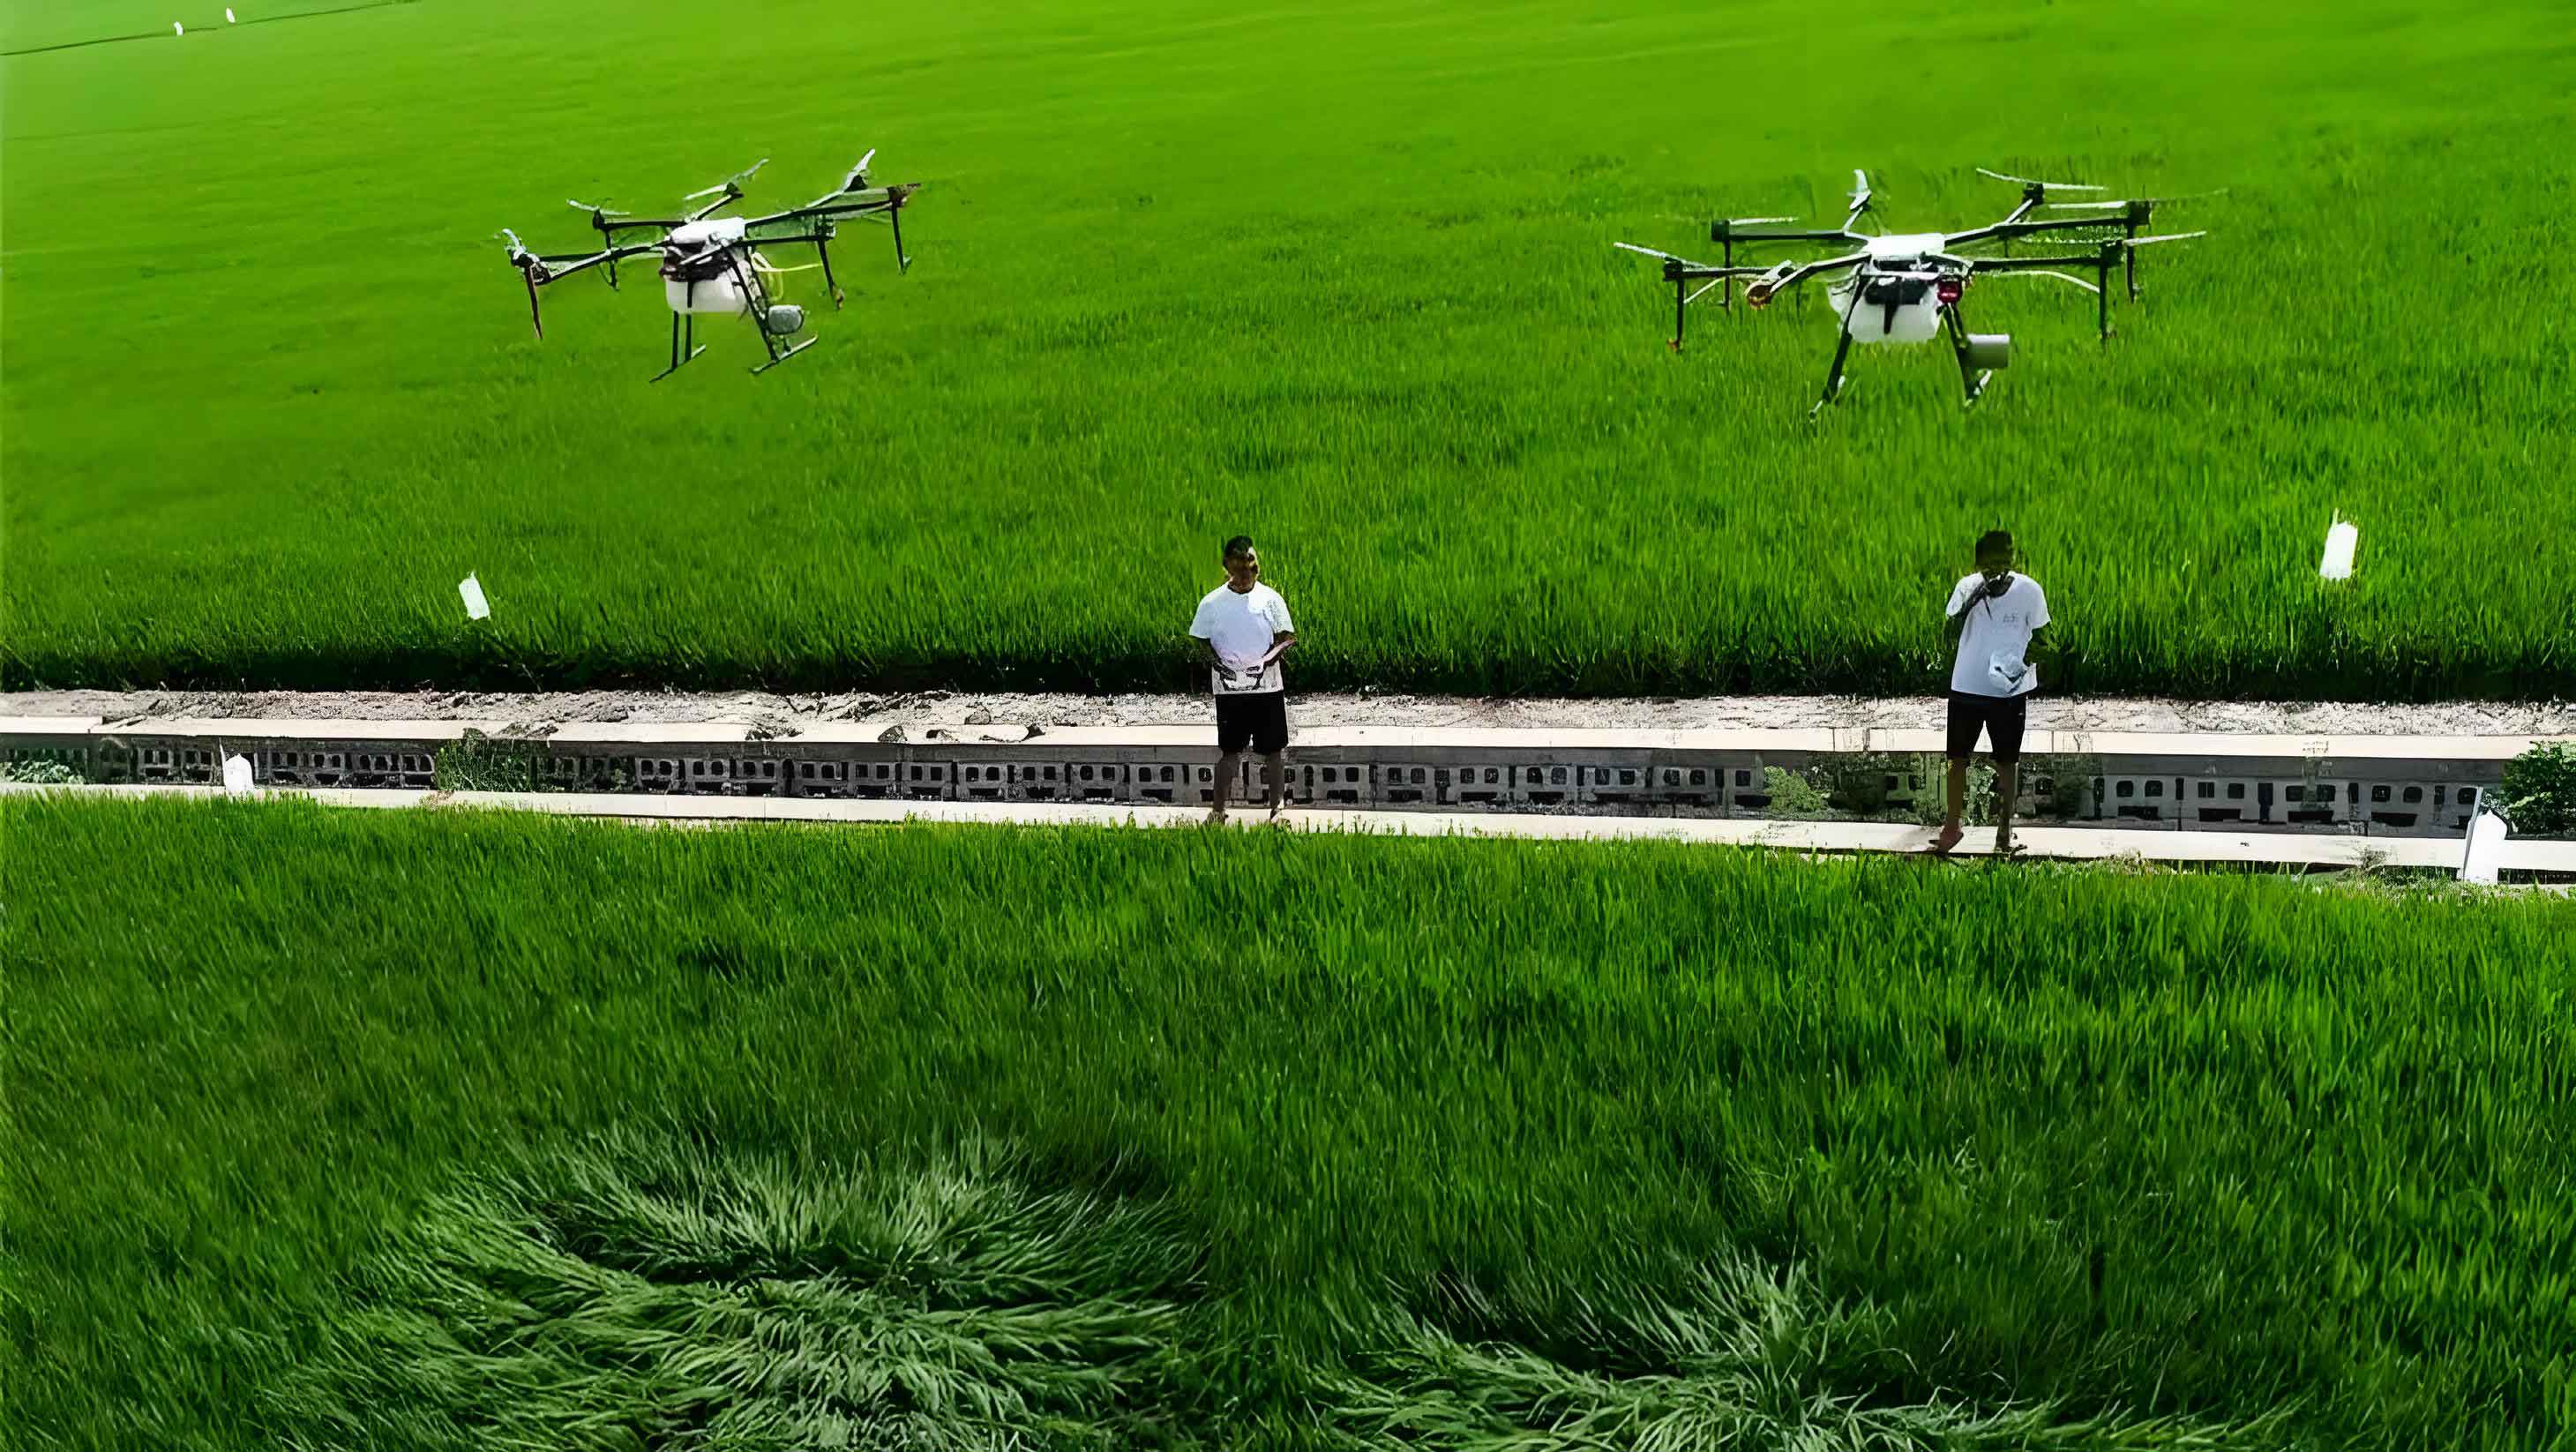
The hyperspectral dataset was acquired using Headwall Nano-Hyperspec sensors mounted on agricultural UAV platforms flying at 500m altitude under clear atmospheric conditions (36°C, 65% relative humidity). The imagery covers 270 spectral bands (400-1000nm) at 0.463m spatial resolution, capturing six major crop types: corn, sesame, cotton, rice, broadleaf soybean, and narrowleaf soybean. Agricultural drone technology enabled the collection of high-fidelity spectral-spatial data essential for fine-scale discrimination of phenotypically similar crops.
Preprocessing began with Minimum Noise Fraction (MNF) transformation to reduce dimensionality while preserving discriminative features. The MNF transformation decomposes hyperspectral data $X$ into noise-whitened components:
$$MNF = \Phi^T \Psi^{-1/2} X$$
where $\Phi$ contains eigenvectors and $\Psi$ eigenvalues from the noise covariance matrix. Eigenvalue analysis (Figure 2) determined retention of the first 10 MNF components containing 98.7% of cumulative information. Subsequent multiscale segmentation in eCognition employed the Estimation of Scale Parameter (ESP2) algorithm, which optimizes segmentation scale by calculating local variance (LV) change rates:
$$ROC-LV = \frac{\Delta LV}{\Delta scale}$$
Peak values in ROC-LV curves (Figure 3a) identified optimal scale parameters, with shape and compactness factors empirically set to 1.0 and 0.5 respectively. This generated homogeneous image objects while preserving field boundaries (Figure 3b).
Feature extraction yielded 46 spectral, shape, and texture attributes per object. Feature Space Optimization reduced redundancy by eliminating low-discriminative features through correlation analysis. The optimal 13-feature subset included:
| Feature Category | Selected Features |
|---|---|
| Spectral | Band 2 mean, Band 3 mean, Band 5 mean, Band 2 std, Band 5 std |
| Shape | Area, Length, Width, Asymmetry, Roundness, Elliptic fit, Border index, Max ellipse radius |
Four machine learning classifiers were implemented for object-based classification:
- K-Nearest Neighbors (KNN): Classifies objects based on majority vote of k most similar training samples using Euclidean distance:
$$d(p,q) = \sqrt{\sum_{i=1}^{n}(p_i – q_i)^2}$$ - Classification and Regression Trees (CART): Recursive partitioning minimizing Gini impurity at each node:
$$G = 1 – \sum_{i=1}^{c}(p_i)^2$$ - Support Vector Machines (SVM): Maximizes hyperplane margin using radial basis function kernel:
$$K(x_i,x_j) = \exp\left(-\gamma \|x_i – x_j\|^2\right)$$ - Random Forests (RF): Ensemble of decorrelated decision trees using bootstrap aggregation:
$$\hat{f}_{RF} = \frac{1}{B}\sum_{b=1}^{B}T_b(x)$$
Classification outcomes revealed substantial performance differences. RF achieved superior accuracy with well-defined field boundaries and minimal confusion between spectrally adjacent crops (Figure 4d). Quantitative evaluation demonstrated RF’s dominance across all metrics:
| Classifier | Overall Accuracy (%) | Kappa Coefficient |
|---|---|---|
| KNN | 87.41 | 0.8432 |
| CART | 91.52 | 0.8950 |
| SVM | 93.64 | 0.9212 |
| RF | 95.84 | 0.9487 |
Per-crop analysis revealed classifier-specific strengths. RF excelled in producer accuracy for corn (96.99%) and rice (97.40%), while SVM achieved perfect user accuracy for corn, sesame, and rice but suffered significant omission errors. RF maintained balanced performance across all crops, evidenced by comprehensive accuracy metrics:
| Crop | Classifier | User Accuracy (%) | Producer Accuracy (%) |
|---|---|---|---|
| Corn | KNN | 79.20 | 88.28 |
| CART | 94.50 | 91.32 | |
| SVM | 100.00 | 87.22 | |
| RF | 97.73 | 96.99 | |
| Rice | KNN | 100.00 | 83.63 |
| CART | 75.65 | 79.81 | |
| SVM | 100.00 | 97.27 | |
| RF | 93.43 | 97.40 | |
| Sesame | KNN | 63.65 | 83.83 |
| CART | 100.00 | 92.42 | |
| SVM | 100.00 | 83.83 | |
| RF | 85.91 | 92.42 |
Agricultural UAV hyperspectral systems coupled with object-oriented RF classification demonstrate exceptional capability for fine-scale crop mapping. RF’s ensemble structure effectively managed high-dimensional feature spaces while resisting overfitting – particularly advantageous for agricultural drone applications with complex spectral signatures. The 95.84% accuracy represents significant improvement over pixel-based methods, primarily through elimination of salt-and-pepper noise and enhanced boundary delineation. Agricultural drone platforms enabled this precision by providing centimeter-resolution imagery essential for distinguishing intercropped species and fragmented fields.
This research establishes agricultural UAV hyperspectral remote sensing as a transformative technology for precision agriculture. Future work will investigate multi-temporal agricultural drone data fusion and deep learning architectures to enhance classification of spectrally similar cultivars. Integration with agricultural UAV-based multisensor platforms will advance capabilities for comprehensive crop monitoring, yield prediction, and stress detection across diverse agricultural systems.